Bill Gates’ $33B Portfolio | No AI Hype, Just the Real EconomyWhile Wall Street chases AI chips, cloud computing and the next tech moonshot, the Gates Foundation Trust has built a portfolio heavily concentrated in railroads, waste management, industrial machinery and Berkshire Hathaway
The Trust reported 24 stock positions worth $34.4 billion at the end of June. Based on subsequent share prices, the estimated value fell to roughly $33 billion by October 15.
Four stocks account for about 75% of that estimated value
📊 The portfolio by the numbers
Be
Berkshire Hathaway Inc.
No trades
No trades
In-depth trading ideas
*BRK.B* - Prime Accumulation Zone at 10% Discount💎 BRK.B - Prime Accumulation Zone at 10% Discount
🎯 Critical Price Zones
🟢 Demand / Accumulation Area: $485.00 - $497.00
🔴 Invalidation / Stop Loss: $460.00 (Weekly Close)
🏁 Short-Term Target: $540.00
Following the recent corrective wave, Berkshire Hathaway (BRK.B) is trading below $500, offering an attractive ~10% discount from local highs. For conservative and long-term investors, the current consolidation around $497.00 marks an appealing accumulation entry, with $485.00 providing a final d
BRK.B | Continued stock growth- Timeframe: Weekly
- Trade type: Buy stop order
- Price: 508.95
- Take Profit: Open
- Stop Loss: 501.27 (-1.50 %)
Idea: Long on a breakout above last week's high - bullish momentum continuation.
Entry: Buy stop above last week’s high.
Stop-loss: Below the low of the same candle.
If the weekly candle closes below this level, the trade is invalidated.
Take Profit: Trailing stop following the lows of new weekly candles.
Market Cap vs Share Price: Difference Every Trader Should KnowOr why a $500,000 stock can be cheaper than a $50 stock.
Berkshire Hathaway Class A shares NYSE:BRK.A famously trade for hundreds of thousands of dollars apiece, while thousands of companies on Wall Street can be bought for less than the price of dinner.
So Berkshire must be incredibly expensive and SpaceX NASDAQ:SPCX at around $150 must be cheap , right?
Here comes one of the first traps awaiting new investors: share price tells you almost nothing about how expensive a company truly i
Berkshire Hathaway — Pullback to 488, Target 560Berkshire Hathaway is approaching a potentially attractive buying zone, but the setup suggests that price may first experience a corrective move before the next major upside leg develops.
The primary scenario is a short-term decline toward the 488 area, where price could find renewed buying interest and establish the base required for a stronger recovery. Rather than chasing the market at elevated levels, the focus remains on allowing this retracement to develop and waiting for confirmation aro
Berkshire Hathaway: Toward the Target ZoneBerkshire Hathaway Inc. shares have moved lower as anticipated in recent sessions, briefly dipping below the $500 mark. Currently, the price appears to be in a corrective phase and is heading toward our green Target Zone ($444.68–$415.61). We expect the correction low to form within this range, followed by the start of a new upward move. If the correction has already ended, the price could break out directly above resistance at $575.02 without first pulling back into the green Target Zone (proba
BRK.B — The $500 Support Zone Is Being TestedBerkshire Hathaway remains in a long-term constructive structure, but the recent rejection from the $537 area has triggered a meaningful pullback.
Price is now testing the key psychological and technical zone around $498–$500. The reaction from this area is encouraging, but it is still too early to call it a confirmed bullish reversal.
As long as BRK.B holds above $498, buyers retain a chance to rebuild momentum. A weekly close above $512 would be the first positive confirmation, while a break
BRK.B | The time to go long has come- Timeframe: Weekly
- Trade type: Buy stop order
- Price: 497.29
- Take Profit: Open
- Stop Loss: 486.06 (-2.30 %)
Idea: Long on a breakout above last week's high - bullish momentum continuation.
Entry: Buy stop above last week’s high.
Stop-loss: Below the low of the same candle.
If the weekly candle closes below this level, the trade is invalidated.
Take Profit: Trailing stop following the lows of new weekly candles.
BERKSHIRE: Bull-Flag-Formation Forming, Levels to Watch!Hello Community,
welcome to my new analysis of BERKSHIRE from a weekly timeframe perspective. The stock market in recent times is determining interesting setups which can lead to strong opportunities along the line. One of them is BERKSHIRE. The stock is forming a solid setup with great potential for completion. I have detected all the important factors to consider with BERKSHIRE next.
When looking at my chart, we can see how BERKSHIRE is moving within this continuous uptrend. It has a pivota
Berkshire Hathaway: Can the Breakout Hold After a Year of Consol**Year-Long Consolidation Finally Breaks
Berkshire Hathaway has broken above a range that had contained price for almost a year. Importantly, the trend preceding this consolidation was higher, giving bulls the initial advantage following the breakout.
**Was the Range a Period of Accumulation?
The lengthy sideways period may have represented a phase of accumulation before the eventual move higher. While that cannot be confirmed from price action alone, the breakout raises the possibility that
Berkshire Turns Buyer: What’s Buffett’s Successor Shopping For?So... bottom’s in?
Berkshire Hathaway NYSE:BRK.A is probably about as far from the average retail trade as you can get.
Warren Buffett resisted splitting its Class A shares largely because he wanted long-term owners rather than day traders like you jumping in and out. The result is the world's most expensive publicly traded stock on a per-share basis, a badge Berkshire wears comfortably.
Still, retail traders can learn plenty from the conglomerate's latest quarter (ref: Earnings Calenda
BRK.A Ascending Triangle Breakout: Eyeing the Historic $1 milion1. Technical Signals & Trend Context
Timeframes: Weekly (1W) / Monthly (1M)
Price Pattern: Ascending Triangle
Status: Confirmed Breakout
On higher timeframes, BRK.A has just completed a period of extremely tight price compression beneath the flat resistance level at $743,000. The supporting uptrend line has proven highly effective, consistently establishing higher lows.
Latest Update: The price has officially broken above the upper boundary of the Ascending Triangle, driven by overwhelming b
Berkshire Hathaway Earnings | Buffett's Empire Still Prints Cash🛡️Insurance Engine Remains Berkshire’s Biggest Competitive Advantage
Berkshire Hathaway continues to demonstrate why its insurance empire is the foundation of the entire company. While underwriting results can fluctuate because of catastrophe losses and pricing cycles, the insurance business continues to generate enormous amounts of investable "float" that fuels Berkshire's investment strategy.. Investors should focus less on quarter to quarter GAAP earnings and more on operating earnings, whi
Berkshire Hathaway Inc. BRK.B – Bullish Setup | Target: 505 #36Berkshire Hathaway Inc. (BRK.B) has generated a bullish Fibonacci Arc setup, with a projected move toward 505.
This analysis combines price and time using Fibonacci Arcs and represents a technical market scenario rather than investment advice.
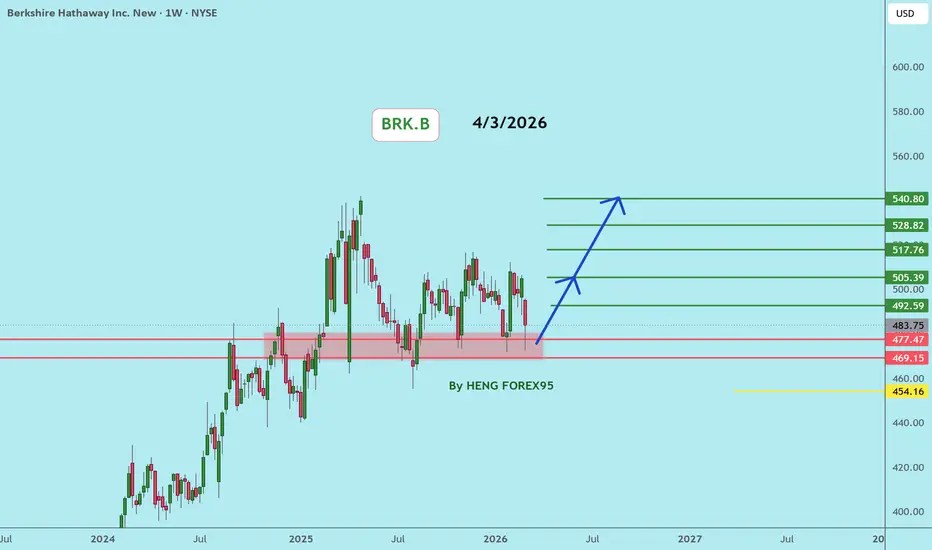
BRK.BBRK.B is currently near the support zone of $477-469. If the price can hold above $456, I expect there is a chance of a rebound.
🔥Trading futures, forex, CFDs and stocks carries a risk of loss.
Please consider carefully whether such trading is suitable for you.
This content is not financial advice. Always conduct your own financial due diligence.
>>GooD Luck 😊
❤️ Like and subscribe to never miss a new idea!
Berkshire Hathaway Acting as a Stability Anchor for the MarketCurrent Price: 0.00
Direction: LONG
Confidence level: 85%(Trader consensus remains unified across group metrics.)
Targets
Target 1: 433.50
Target 2: 437.00
Stop Levels
Stop 1: 426.50
Stop 2: 423.00
Wisdom of Professional Traders:
Here's the big picture for TODAY only. When I combine YouTube trader commentary with real‑time X sentiment, the dominant narrative is still the AI‑led mega‑cap momentum trade pushing indices higher intraday.
Several professional traders I tracked emphasize that
BERKSHIRE HATHAWAY not a long-term buy yet.Berkshire Hathaway (BRK.A) has been trading within a 17-year Channel Up, which made a Higher High Top last April (2025) and has been declining ever since.
Technically this is a standard pause that the stock historically displays after long-term rallies and it's was on one since the late 2022 bottom. The Channel Up has seen 4 such pauses, all correcting by a minimum of -18.05% and a maximum of -31.15%.
Unless the 1M RSI enters its long-term Support Zone (in which case it's an automatic Buy as t
Berkshire: Huge 51%+ Gap vs S&P 500 + Cash Pile + AI Play?I've been talking about Berkshire Hathaway (BRK.B) for a while and I think the opportunity is better than ever. Berkshire is presenting a rare long-term buying opportunity.
As shown in the chart (May 2025 – May 2026):
BRK.B: -8.86%, while
SPX: +42.49% a gap of over 51 percentage points — one of the widest divergences in modern history.
The ratio between NYSE:BRK.B and SP:SPX (BRK.B / SPX) has collapsed to the 0.65, while in the past it used to be close to 1. Still, Berkshire maintain