COMP - Big Cup & Handle Setup Above 50 SMA💡 Swing setup idea
Resistance retest / cup and handle breakout
🔎 Analysis summary:
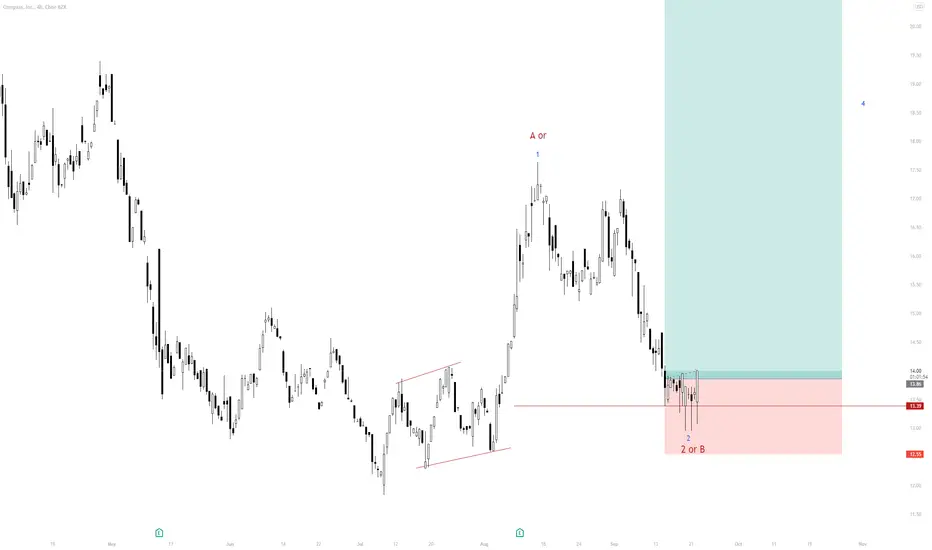
The stock is trading comfortably above the 50 SMA and reached key resistance. We can see the closing of a large cup and handle structure, with the upside potential projected by the depth of the cup from the breakout point.
👀 Levels to watch:
Entry trigger: Break above $13.65
Target: $20.50
Stop: Under the breakout level
💬 Will the stock break through resistance this time? Let me know in the comments! 👇
In-depth trading ideas
COMP | Real Estate Services on the Rise | LONGCompass, Inc. engages in the provision of an online real estate platform. Its platform provides an integrated suite of software for customer relationship management, marketing, client service, operations and other critical functionality, as well as brokerage services and adjacent services. The company was founded by Ori Allon and Robert Reffkin in 2012 and is headquartered in New York, NY.
To know where you are, you need a Compass. Opendoor Technology's ( NASDAQ:OPEN ) recent surge (20x of lows) caused me to wonder what the theme is. After all, rarely is a movement motivated by nothing.
I've determined the only logical conclusion is the correlation of Real Estate to interest rates.
Opendoor is a REIT disguised as a tech company and without the hefty dividend. While they offer tools for homeowners to exit / enter homes quickly, they really are just operating a fat inventory of housing. This is a difficult asset to man
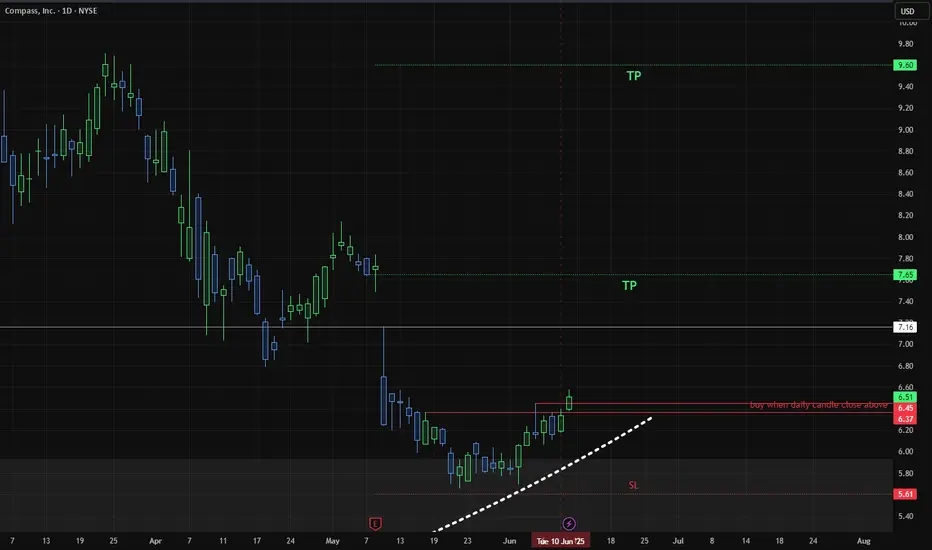
Hello BullishHello Again, entered long for Compass Inc. with shown entry, SL and TP1 and TP2 points.
I see daily candle confirmation. along with expected incoming interest rate variation, I expect booming. Let's us. Compare my analysis to yours and take it on your own responsibility.
As usual, this is not a financial advice.
Give me your thoughts!
Compass well placed for US housing bounceCompass sits at the heart of the US residential real estate recovery. As housing demand rebounds, Compass stands to gain directly from rising activity. Its tech-enabled platform and scale afford it an edge when sellers return.
Slowing economic data and persistent high rates will eventually force the Fed’s hand. As data turns softer, rate cuts will arrive sooner than expected. Lower rates fuel home buying, Compass’s core driver.
Buyer and seller behaviour matters deeply. As more homes come to m
COMP/USD – 30-Min Breakout Trade Setup!📌
🔹 Asset: Compass, Inc. (COMP/USD)
🔹 Timeframe: 30-Min Chart
🔹 Setup Type: Symmetrical Triangle Breakout
📌 Trade Plan (Long Position)
✅ Entry Zone: Above $9.10 (Breakout Confirmation)
✅ Stop-Loss (SL): Below $8.60 (Break of Support & Triangle)
🎯 Take Profit Targets
📌 TP1: $9.61 (First Resistance Level)
📌 TP2: $10.28 (Final Target – Extended Move)
📊 Risk-Reward Ratio Calculation
📈 Risk (SL Distance): $9.10 - $8.60 = $0.50 risk per share
📈 Reward to TP1: $9.61 - $9.10 = $0.51 (1:1.02 R/R)
📈 R
COMP/USD – 30-Min Long Trade Setup!📊 🚀
🔹 Asset: COMP/USD
🔹 Timeframe: 30-Min Chart
🔹 Setup Type: Bullish Wedge Breakout
🚀 Trade Plan (Long Position):
✅ Entry Zone: Above 10.23 USD (Breakout Confirmation)
✅ Stop-Loss (SL): Below 9.60 USD (Breakout Invalidated)
🎯 Take Profit Targets:
📌 TP1: 11.08 USD (First Resistance Level)
📌 TP2: 12.06 USD (Extended Bullish Target)
📊 Risk-Reward Ratio Calculation:
📈 Risk (SL Distance): Below 9.60 USD
📈 Reward to TP1: 11.08 USD
📈 Reward to TP2: 12.06 USD
🔍 Technical Analysis & Strategy:
📌 Bre
Symmetrical triangle on $COMP. Low Volatility ahead of earningsTechnical Setup: NYSE:COMP has shown lower highs and higher lows, forming a classic symmetrical triangle, suggesting potential for either a continuation of the current trend or a reversal.
Key Levels to Watch: Watch for a breakout above the upper trendline for a potential bullish move or a breakdown below the lower trendline for a bearish scenario.
Volatility Note: Low volatility is typical in symmetrical triangles; expect an increase in volume and price movement around earnings. Earnings
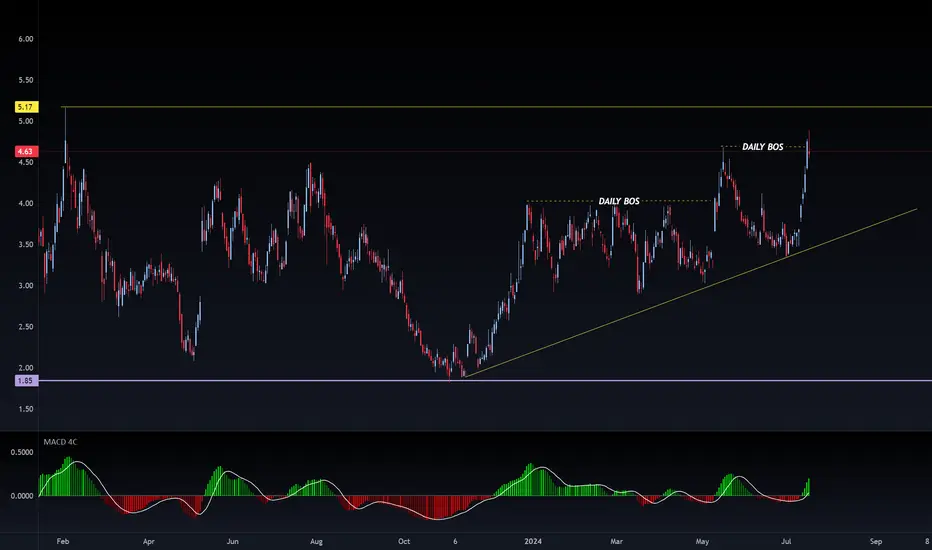
$compCan compass finally make a move after IPO? Was beat down during covid highs, beat down on interest rates, stock is down 90% since its public offering. Looks like it made a 100% move recently after hitting its 1.84 low... Stock looks like it is neutralizing- not sure how much longer the shorts can grab off a 90% sell off- looks like there is some opportunity opening up for bulls.
COMP long
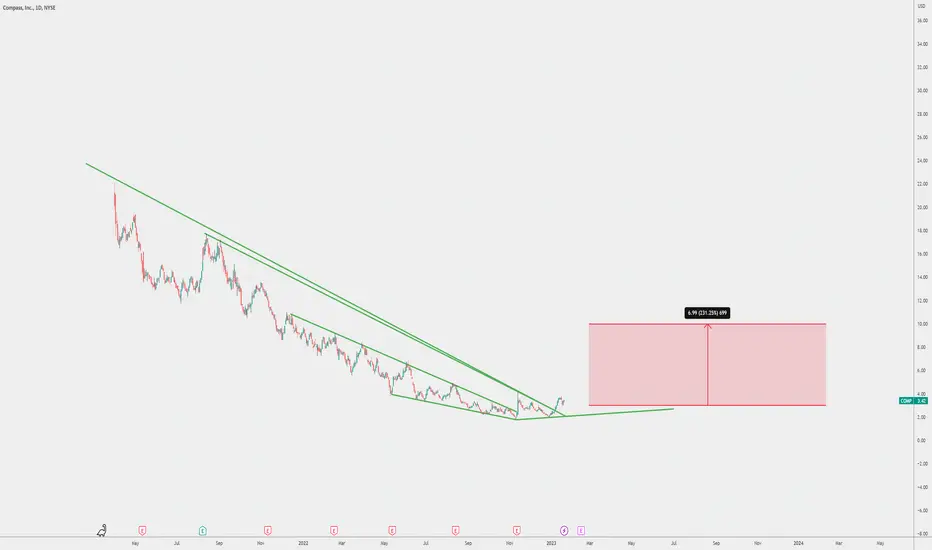
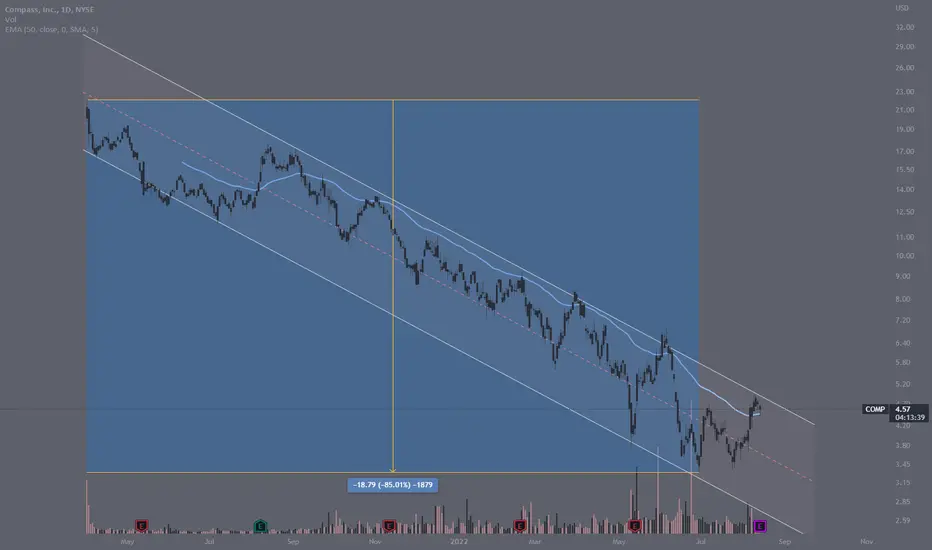
Price is down 85% from the top at $22
They have been dumping equity stakes onto their own agents for 2 years as a voluntary alternative to paying out commission. Many people have been burned leading to a class action suit (several over their history)
They have 3 quarters of cash left
They are doing mass layoffs of 450 employees
I'm not giving away my price targets this time.
Get good.
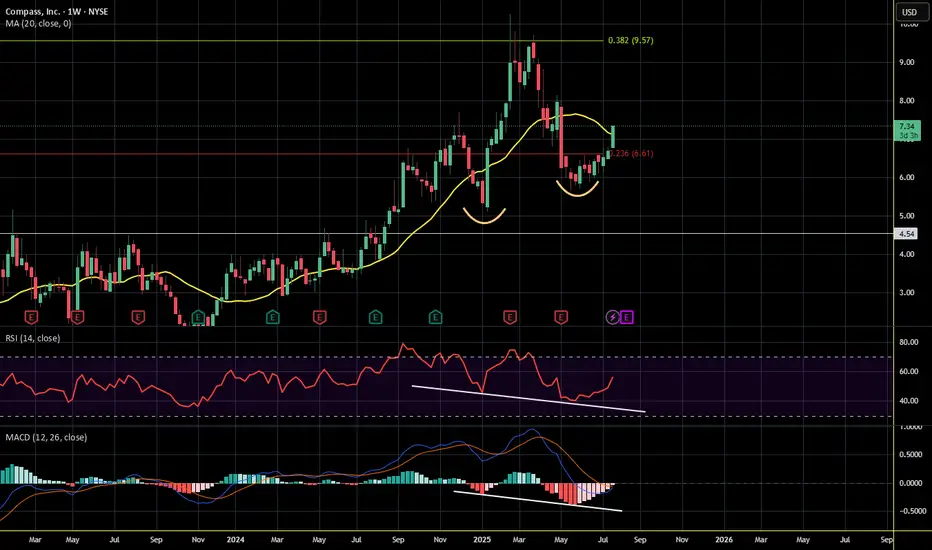
$COMP: Double Bottom with Bullish Divergence Channel BreakoutCOMP is Double Bottoming after showing 3 Instances of Bullish Divergence on the RSI and is now trading above an Assumed Channel which if it hold could signal a Break Hook and Go that could take it up to as high as a 1.618 Fibonacci Extension.
COMP Trade zones Taking a look at this stock because of a screener alert.
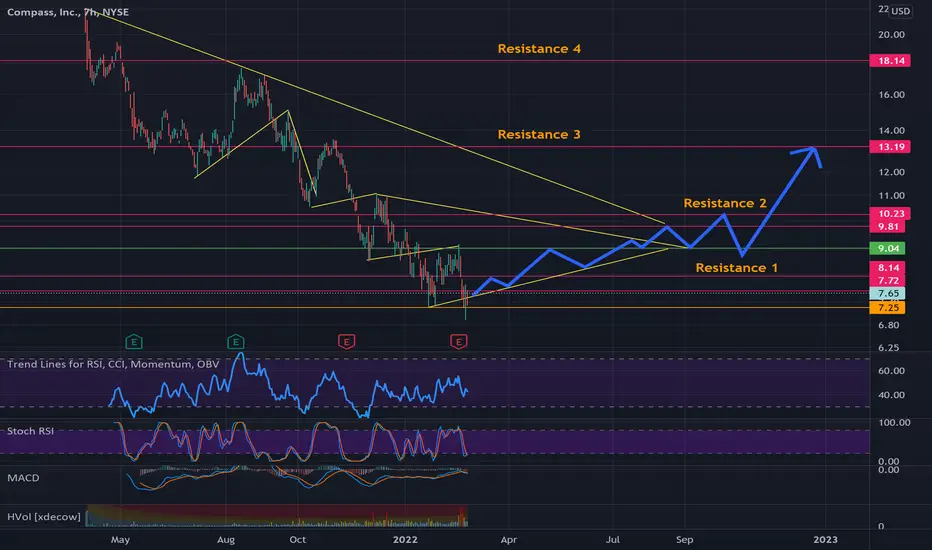
Here's a chart with zones marked. It looks like in the really long term you might see upwards of $13, but I wouldn't expect it to be higher than $18.
I think currently, $9 seems to be where this stock is heading.
A Monday morning dip could definitely be a buy opportunity to $9.
I also, am noticing a lot of trends in the market leading to march 17th through the 23rd which are showing a possible big movement (crash maybe). I'll keep wat