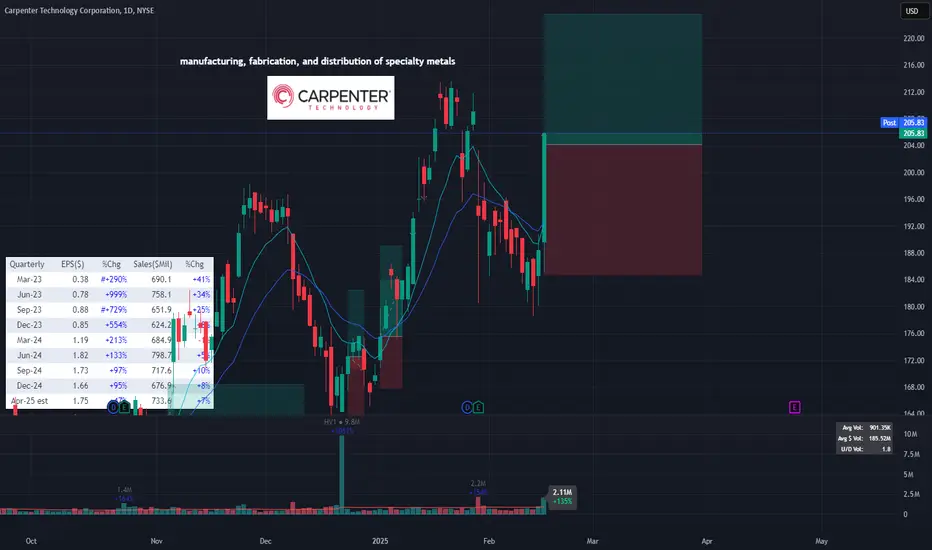
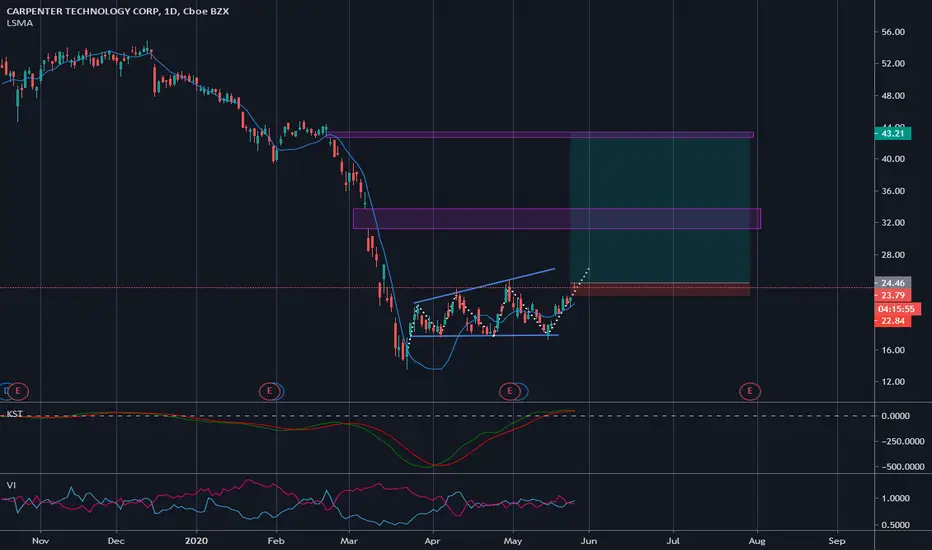
AERISPACE & DEFENSE (XAR) KEEPS GETTING MONEY #CRSI think CRS will continue to rise. Money is flowing in fast, XAR. Peer assessment shows CRS is not overvalued and is also outperforming the other cheap ones in 1Y performance. We have had positive earnings as well. These factors combined lead me to believe that we will be above the current price in the next 48 days. I do have an options structure of a bull call spread. I also have a very OTM call option as well, in case of a crazy move. I just don’t believe we will be lower in about a month or t
In-depth trading ideas
Bullish Thesis on CRSStrong Uptrend Intact
CRS is trading at $428.14, holding firmly above the rising 10 and 21 EMAs, with the 50-day moving average sloping up steeply below price. The stock has been in a clean stage 2 uptrend since the February shakeout, making higher highs and higher lows into April.
Healthy Pullback to Support
After tagging a recent high near $470, price pulled back and is now consolidating tightly right on the 21 EMA around $425 to $430. This is a textbook low-risk continuation setup, tight ran
CRS support areasMy dowsing chose this on 11/25th as part of a bunch of picks I did back then over a couple days, but especially wanted me to pay extra attention to it on Friday. I started putting levels on my chart to share this idea, but got super frustrated because it wasn't clear enough.
I was confident in $290, but suggestions lower were all over and even down to $234.
The main way I get information is with my pendulum & scales I've created over the years.
I get numbers for prices, percentages, points and
CRS - LONGCRS was taken as a rotation out of OKLO which was a naughty loser today.
Love the look of this chart and todays up move on volume , def a super performer here , albeit late in its move , this does not mean we cant make bank . CRS themselves is making bank so we can take some of that :) We could lose money too but that is a 60%+ odds candle in my opinion of atleast a 1R move in the good direction.
Great vol too .
Possible Long Entry for CRS
Chart looks like a bullush trend;
Tenkan crossing up through Kijun (but below the cloud);
Chikou is above the cloud but close to price action - possible consolidation;
Bars have broken out above the cloud, but a 3 bar pattern has not yet been established...2 of the bars dipped back into the cloud restarting the count
XME Components Analysis Number 11: CRS (Carpenter Tech)I have recently published a series of bullish articles about-XME.
CRS-is one of the components of-XME. The strength of this chart speaks for itself -
It is one of the metals stocks which is contributing to the strength in-XME.
XME-is the-SPDR S&P-Metals and Mining ETF-which offers broad exposure to industrial-and precious metals and mining, with a strong emphasis at the lower end of the capitalization spectrum. It holds 25 components in an equal weighted market cap.
I believe by showing you some
Bearish technicals. Strong resistance overhead & RSI double topStrong overhead resistance has formed from the down-trending channel that begun in August 2014. There is also a fib retracement level @ 41.38 which the price has also recently respected, giving weight to its significance. The RSI has also topped out at a level consistent with the previous high made in late February 2015. Volume is falling as buying interest wanes after the recent rebound off the near record lows made in April 2015.