In-depth trading ideas
As $USO goes $CVX $XOM will followAMEX:USO is currently making a v-shape recovery back to it's previous highs. Unsure if it will return there but this is my idea.
If AMEX:USO can get above the 61.8% on the fib around $134, I would say yes. Have you missed the entire move? No as it still will track back towards $150 before it will hit a bit of exhaustion, before another decision in the market is made.
Trade ideas NYSE:CVX NYSE:XOM
Sell Side Institutions vs Buy Side Institutions
Sell Side Institutions are the Money Center Banks and Giant Financial Services companies such as JPM Bank and Goldman Sachs, the Giant Financial Services company. Sell Side are short term traders. Each Bank and Financial Services company has a huge floor of traders. They do not use AI to make trading decisions. Mostly AI is used for routing on the millisecond.
Floor traders can and do use millisecond routing. Sell Side Institutions have access to all the retail side trading activity BEFORE the retail side orders are filled by the PFOF Payment for Order Flow Market Makers.
When studying a chart, it is important to be able to identify who is in control of price. Is it the Buy Side Institutions? Is it the Sell Side Institutions? Is it Small Funds Managers with less than 5 billion in assets?
How price and volume will behave is defined by who is in control of price. In most downtrends the Sell Side Institutions control price.
Bearish potential detected for CVXEntry conditions:
(i) lower share price for NYSE:CVX along with continued lower highs and lower lows in the lagging indicator (green line) of the Ichimoku indicator, and
(ii) swing up of indicators such as DMI/ADX (bearish) and swing down in RSI, and
(iii) observe market reaction around the long-term support/resistance line of $172.65 from the open of 29th January.
Depending on risk tolerance, the stop loss for the trade would be:
(i) above the recent swing high of $176.40 from 23rd June, or
(ii) above the declining 15 day EMA (currently $178.28).
Chevron (CVX) is approaching a critical decision pointPrice is currently testing a key support level at $171.74, which corresponds to the high of Wave 1 from January. With CVX trading less than 1% above this level, the market is now at a pivotal stage for the broader wave count.
As long as support holds, the current structure continues to favor the completion of Wave A and the potential formation of a Wave B low, setting the stage for a Wave C advance to complete the larger Wave 2 correction. This scenario could open the door for a bullish corrective move of around 20% before the next major impulsive phase develops.
However, a decisive break below support would increase the probability of a more extended Wave B decline and force a reassessment of the current outlook.
The next reaction from this area will be crucial in determining which scenario takes control.
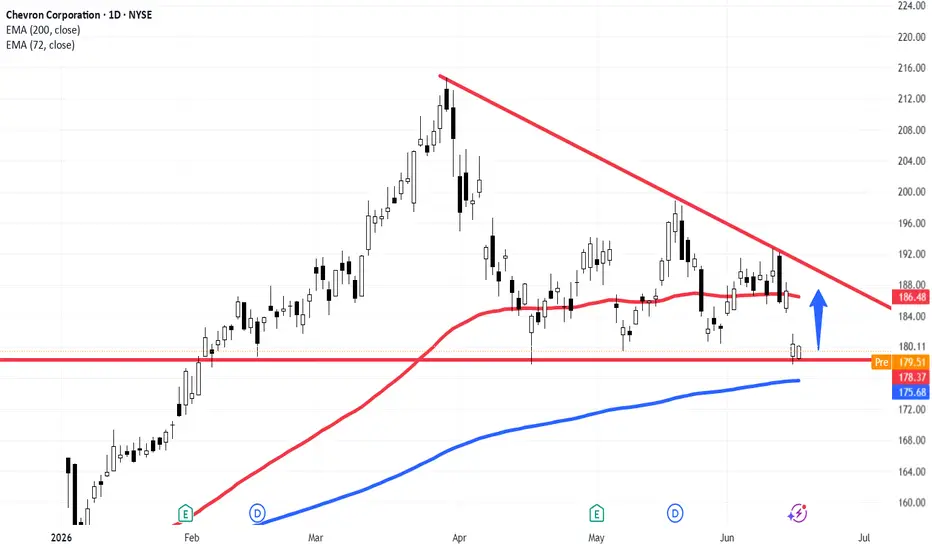
Chevron ($CVX) Daily: Testing Key Support – Mapping Risk Chevron ( NYSE:CVX ) Daily: Testing Key Support – Mapping Risk Profiles Near 200 EMA For Mean-Reversion Long
### 🛢️ Chevron Corporation ( NYSE:CVX ) Daily Technical Study (Ref: CVX_2026-06-17_11-53-39.png)
We are analyzing Chevron Corporation ( NYSE:CVX - NYSE) on the Daily (1D) timeframe, where price action is currently intersecting a critical structural value zone.
The stock concluded its last formal session printing at **180.11 (-0.16%)**, with immediate pre-market indicators registering at **179.30**. The price is reacting directly on top of a significant multi-month horizontal support baseline.
---
### 🔍 Technical Geometry & Market Context:
1. **The Horizontal Demand Floor:** Price is testing the immediate horizontal support level marked at **178.37** (red horizontal line).
2. **The 200 EMA Threat/Magnet:** As a professional analyst, one must account for near-term volatility. There is an active risk that price action may sweep liquidity slightly lower to test the long-term institutional trend filter—the **200-period EMA (blue line at 175.68)**—before fully initiating a sustained bounce.
3. **The Upside Destination:** The primary macro target for this technical mean-reversion move is the dominant **Descending Trendline (LTB - upper diagonal red line)**, which heavily converges just above the current position of the **72-period EMA (red line at 186.48)**.
---
### 🛡️ Operational Execution & Risk Architecture:
We have established two distinct defensive frameworks depending on your capital-risk tolerances:
* **Option A: The Institutional Conservative Blueprint (Prudent)**
Place the protective Stop Loss securely **below the 200-period EMA (below 175.68)**. This approach grants the market sufficient breathing room to absorb a potential secondary liquidity sweep without prematurely invalidating the bullish thesis.
* **Option B: The Aggressive Intraday Blueprint (Higher Risk)**
Place a tighter protective Stop Loss immediately below the horizontal support line of **178.37**. While this maximizes the structural Risk/Reward ratio, it leaves the position highly vulnerable to local stop-hunting spikes before a reversal occurs.
### 🎯 Systematic Position Management:
* **Milestone 1 (1:1 Risk/Reward):** Upon price achieving our initial **1RR** upside extension, a partial profit management trigger is activated. The remaining protective Stop Loss is systematically trailed to the **original entry point (Break-Even/ZERO risk)**.
* **Milestone 2 (2:1 Risk/Reward):** With all downside exposure eliminated, the runner position is managed to target the structural deceleration zone near the overhead LTB for a full **2RR** cycle completion.
---
📊 **ChartPro Data**
*Systematic Energy Sector Research, Position Architecture & Mathematical Risk Management.*
⚠️ **Disclaimer:** For educational and informational purposes only. This active chart study represents a personal trading framework and does not constitute financial or investment advice.
My #1 Gift For You --Buy This Stock NowThis stock is going to go up and here is why.
So about a week ago
this oil stock showed us a buy signal
and now it has bounced from the re-entry
It looks oversold
but this is now a short squeeze..
Now i must warn you
this strategy is a level 3
its the lowest trading strategy
but it will get you some scores
I know my audience..
i know you love stock options
so this one will make you happy this is my gift
to you for following
me for such a long time
now i wont be trading it
but my hope is that you
make some bucks for yourself
remember to give some
of your profits
some of it to charity
trade safe my friend.
Rocket boost this content to learn more
Disclaimer:Trading is risky please use a
simulation trading account before you trade
with real money.
before you trade with real money.
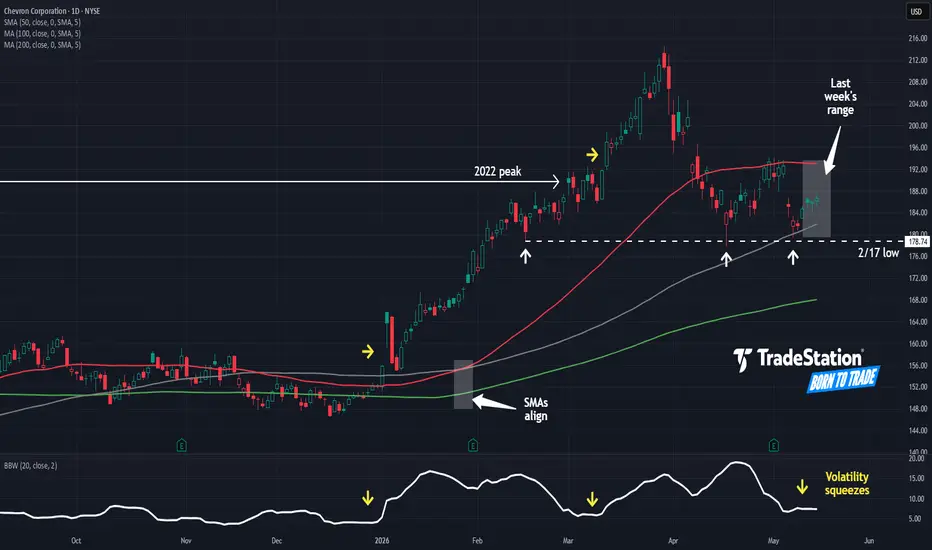
Chevron Squeezes Near Old HighsChevron has been squeezing near previous highs, and some traders may see further upside.
The first pattern on today’s chart is November 2022’s record peak of $189.68. The oil-and-gas giant paused below that level before breaking out last March. CVX pulled back near it without a significant move below. Is old resistance becoming new support?
Speaking of support, the stock has bounced multiple times at the mid-February low of $178.75.
Third, long-term simple moving averages (SMAs) moved into a potentially bullish sequence in January. (The 50-day SMA moved above the 100-day SMA. Both are above the slower 200-day SMA.)
Next, Bollinger Band Width compressed in December and early March. Rallies followed both times. (See the yellow arrows.)
Finally, the current range is potentially turning into a bullish inside week versus the May 4-8 period. That can suggest a pullback is ending.
TradeStation has, for decades, advanced the trading industry, providing access to stocks, options and futures. If you're born to trade, we could be for you. Learn more here about TradingView’s Broker of the Year!
Past performance, whether actual or indicated by historical tests of strategies, is no guarantee of future performance or success. There is a possibility that you may sustain a loss equal to or greater than your entire investment regardless of which asset class you trade (equities, options or futures); therefore, you should not invest or risk money that you cannot afford to lose. Online trading is not suitable for all investors. View the document titled Characteristics and Risks of Standardized Options at www.TradeStation.com . Before trading any asset class, customers must read the relevant risk disclosure statements on www.TradeStation.com . System access and trade placement and execution may be delayed or fail due to market volatility and volume, quote delays, system and software errors, Internet traffic, outages and other factors.
Securities and futures trading is offered to self-directed customers by TradeStation Securities, Inc., a broker-dealer registered with the Securities and Exchange Commission and a futures commission merchant licensed with the Commodity Futures Trading Commission). TradeStation Securities is a member of the Financial Industry Regulatory Authority, the National Futures Association, and a number of exchanges.
TradeStation Securities, Inc. and TradeStation Technologies, Inc. are each wholly owned subsidiaries of TradeStation Group, Inc., both operating, and providing products and services, under the TradeStation brand and trademark. When applying for, or purchasing, accounts, subscriptions, products and services, it is important that you know which company you will be dealing with. Visit www.TradeStation.com for further important information explaining what this means.
CVX Chevron Corporation Options Ahead of EarningsIf you haven`t sold CVX before the retracement:
Now analyzing the options chain and the chart patterns of CVX Chevron Corporation prior to the earnings report this week,
I would consider purchasing the 200usd strike price Calls with
an expiration date of 2027-6-17,
for a premium of approximately $19.15.
If these options prove to be profitable prior to the earnings release, I would sell at least half of them.
CVX, Oil Price Spike to Fuel Bullish Trend!Hello There,
welcome to my new analysis about CVX (Chevron) on the global timeframe perspective. The oil shortage and oil price spikes are continue to increase. This is driving surplus earnings of oil companies such as CVX higher. Currently, there is an increased likelihood that this will continue.
As seen in my chart CVX already completed this massive ascending triangle formation. The breakout above the upper boundary has been the turning point of a massive spike in bullish volume and volatility. Right now CVX already bounced avove the 200 mark and is preparing the next bullish formation.
Above the crucial level of 190 the price action is now building up. The several bounces within this area are the initiating points of this continuational bull flag formation. Such a formation is marking the continuation formation of a continued trend.
In the next times, I am expecting the price action to form the next bullish inclinments with the price moving above the 200 level again and building up above it. Once this happens it is likely that the price action is going to complete this major bull flag formation.
With the formation completed the minimum target zone of this ongoing volatility cycle will be within the 370 area marked in my chart. Once this zone has been reached further assumptions about the trend direction and momentum need to be made.
Also, as the supply shortage and increased demand moves further this is also offering fundamentally bullish signals. It is also likely that speculative whale money is moving into the market more and more as they bet on an ongoing shortage and increased surplus values.
What do you think about the stock? Are you currently trading the stock? Would you prefer a bullish outcome?
Let us know in the comments!
Thank you a lot for the support!
VP
CVX | Houston, We Have A Problem | LONGChevron Corp. engages in the provision of oil and gas energy solutions. It provides crude oil and natural gas, manufactures transportation fuels, lubricants, petrochemicals, and additives, and develops technologies that enhance business and the industry. It operates through the Upstream and Downstream segments. The Upstream segment consists of the exploration, development, and production of crude oil and natural gas, the liquefaction, transportation, and regasification associated with liquefied natural gas, the transporting of crude oil by major international oil export pipelines, the processing, transporting, storage, and marketing of natural gas, and a gas-to-liquids plant. The Downstream segment consists of the refining of crude oil into petroleum products, the marketing of crude oil and refined products, the transporting of crude oil and refined products by pipeline, marine vessel, motor equipment, and rail car, and the manufacturing and marketing of commodity petrochemicals and plastics for industrial uses and fuel & lubricant additives. The company was founded on September 10, 1879 and is headquartered in Houston, TX.
What next for CVXChevron, Oil, and the Lag Effect: Mapping the Next Test Zone
This is a structural observation based on repeated behaviour between oil and Chevron (CVX), and how price has responded to prior impulses.
The relationship is straightforward in principle.
Oil leads. CVX follows, but with a delay.
How will that correlation express itself over time?
Looking at the chart, there are multiple instances where oil pushes aggressively higher while CVX lags. In each case, oil expands first, pauses or consolidates, and only then does CVX continue higher into its own move.
CVX completes its move after oil stabilises.
That is the key behavioural pattern.
Now bring that forward to the current structure.
Oil is again pushing into highs, approaching or testing the 120 region. CVX, meanwhile, has only recently reclaimed the 200–203 zone and is beginning to re-enter prior structure.
This creates a familiar setup:
* Leader extended (oil)
* Follower mid-expansion (CVX)
The prior high in CVX, around 214–216, becomes relevant in this context. Because it represents an unfinished auction. Price previously failed there while oil rotated lower. Now that oil has returned to strength, that same supply zone is likely to be revisited. (gap concept).
Between current price and that prior high sits a zone that has not yet been fully re-tested under current macro conditions. If oil holds elevated levels and does not reject, CVX has a structural pathway to rotate into that area.
That is the hypothesis and importantly, a conditional map.
So, if oil holds strength:
* CVX likely continues its catch-up phase
* The prior high (~214–216) becomes the next logical test zone
If oil rejects:
* CVX likely stalls back into the 200–203 region
* The rotation remains incomplete
That prior high represents a reaction zone.
That is where supply previously entered - Acceptance or rejection will determine the next phase.
The “ghost feed” drawn on the chart reflects the prior sequence:
impulse → pause → continuation.
That level becomes structurally relevant given oil’s positioning and the historical lag between the two.
Right now, CVX is early in its catch-up phase.
That is what keeps the prior high in play.
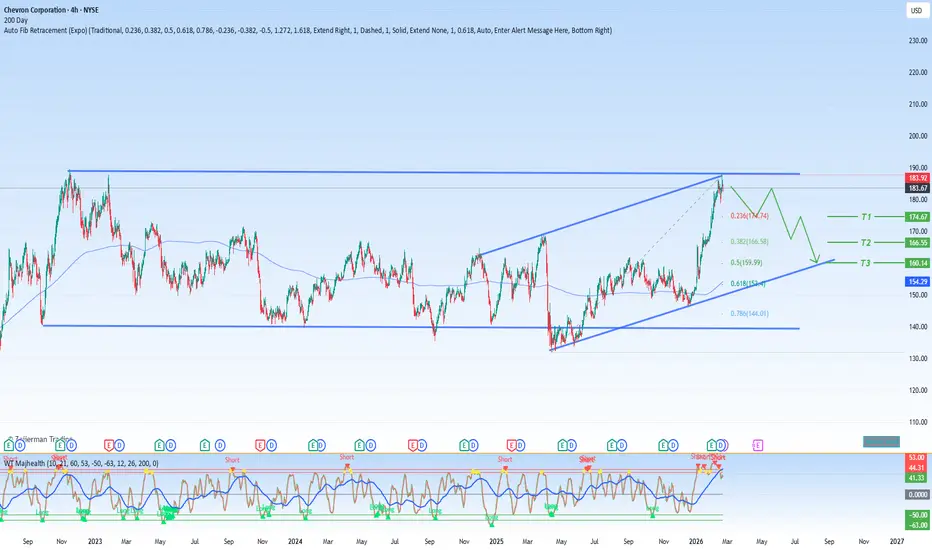
Chevron in a years time 80% higherBullish view on Chevron, because the war in middle east is pushing oil prices higher.
There is a long term channel which the price action oscillates in
Although we dont normally draw flag targets like this there are several factors suggesting that this price action on the flag could develop
I think the flag pole length is extreme but it you mute it down a little we still have 100 % upside from its key level of support under a triangle
So even at todays price we still have like 80% to move up to the top of the channel.
The Top 3 Trading Secrets I want to introduce you to my trading strategy.
It has the RSI Indicator, 50 EMA, & Candlestick detection.
So yesterday I was working in my mobile money booth.
I turned on the radio,
"Breaking News - Oil Prices ⛽ Skyrocket!!"
I heard it over a local radio station,under business news.
The following day, i looked at the charts and i saw a pattern.
This pattern does not respect,
Market indicators
Or Market manipulation.
It's independent once you see it
That's the entry.
I saw this pattern over and over again.
It's not perfect.But it works - it's a system.
It's based on 3 things:
-
Bullish Engulfing
Bullish Kicker
Candlestick Confirmation
-
These 3 things, helped me learn how to trade the right way.
They helped me gain confidence at the market open.
It's not over we keep going & learning.
If you want you can ignore this pattern and create your own.
But if you want to master trading then follow me for more content.
And Rocket Boost this content.
Disclaimer 🚧 Trading is risky please use risk management and profit taking strategies.
Feel free to use a simulation trading account before you trade with real money.
Chevron (CVX) — Technical AnalysisChevron (CVX) — Technical Analysis
Trend
The structure is bullish. Price is moving inside a rising channel formed by two ascending trendlines, showing strong momentum since the start of 2026. The market has produced a sequence of higher highs and higher lows, confirming a continuation trend.
The lower red trendline acts as dynamic support, while the upper trendline defines the acceleration of the bullish move.
Key Support Levels
191.20 – Immediate support and recent breakout level
Lower ascending trendline – Dynamic support maintaining the uptrend
188–189 zone – Short-term structural support
As long as price holds above 191, the bullish structure remains valid.
Resistance Levels
194.75 – First resistance
198.29 – Major resistance and upper target zone
Price is currently consolidating below this resistance cluster.
Bullish Scenario
If price holds above the 191 support:
Break above 194.75 → continuation toward 198.29
Break above 198.29 → extension toward 200+
This would confirm continuation of the bullish channel.
Bearish / Correction Scenario
If price fails to hold 191:
A retracement toward 188 → 184 becomes possible.
A break below the lower trendline would indicate momentum weakening and could trigger a deeper correction toward 180.
Conclusion
Chevron remains in a strong bullish structure supported by an ascending channel. The key technical focus is 191 as support and 198 as the next major resistance. A confirmed breakout above 198 would likely trigger the next bullish leg toward 200+.
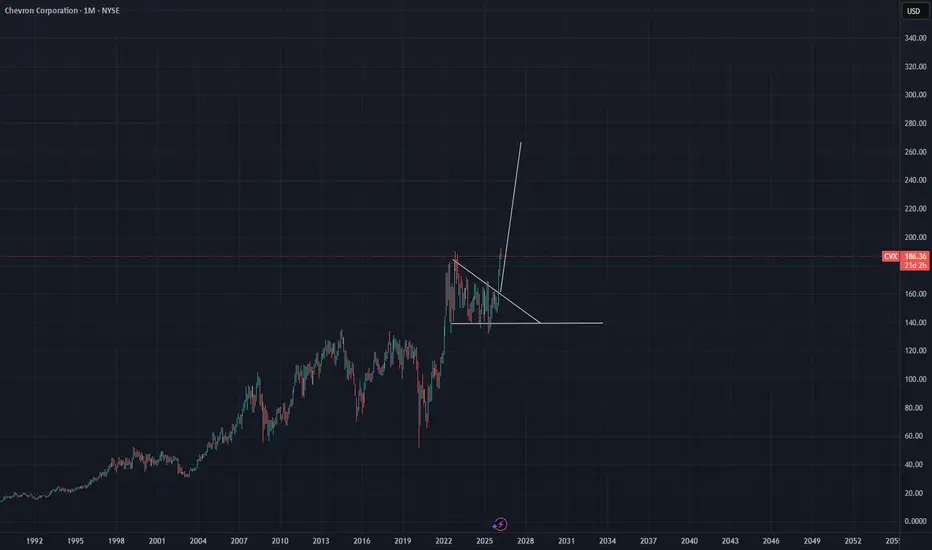
CVX at a Historic Breakout LevelTechnical Analysis
The chart shows a medium-term cup pattern with price testing major resistance around $189–190, which has capped price for the past two years.
Momentum is strong and price is trading above the moving average. This is a critical breakout zone.
Short-Term Outlook
Bullish Scenario (Break Above $190)
Targets:
• $200
• $210
• $220
Stop Loss:
• Below $182
• Conservative: Below $178
Pullback Scenario
If resistance holds:
Support Levels:
• $180
• $170
• $160
Long-Term Outlook
If the cup breakout confirms:
Pattern Target:
• $220–230
Extended cycle targets:
• $240
• $260
Long-Term Stop Loss:
• Break below $160
Chevron at $183.93: Breakout Setup Targets $190 This Week:Current Price: 183.93 (Analysis was generated on Monday Morning)
Direction: LONG
Confidence level: 62%(Several professional traders consistently describe a breakout setup with upside toward $188–$190, while institutional accumulation supports the move. Confidence is moderated by limited social chatter.)
Targets
Target 1: 188.00
Target 2: 190.00
Stop Levels
Stop 1: 180.00
Stop 2: 178.00
Key Insights:
Here’s what’s driving this setup. Several traders repeatedly point to Chevron breaking out of a long-term descending channel, with price holding well above key moving averages. That’s not subtle language — breakout, gearing up for fresh highs, targets pushing toward $190 and even $200 longer term. For a weekly trade, the $188–$190 zone shows up again and again as the next logical test.
What’s also interesting is how traders frame Chevron’s role in portfolios. It’s consistently described as a “safe but strong” energy play, backed by steady cash flows, a strong dividend, and institutional accumulation. Even traders who call it boring still frame it as reliable, which tells me downside expectations are limited near current levels.
Recent Performance:
Chevron is trading around $183.93 after a strong push higher, holding gains rather than fading them. The stock remains well above its 50‑day and 200‑day averages, which tells me buyers are still in control. Price is consolidating just below resistance instead of selling off — that’s usually how continuation moves start.
Expert Analysis:
Several professional traders I tracked mentioned the $185–$188 zone as the first real test. A clean push through there opens the door to $190, which lines up with the 52‑week high area. On the downside, $180 comes up repeatedly as the level buyers should defend. If that breaks, traders generally step aside — which is why I’m using it as a first stop reference.
News Impact:
Institutional buying, especially Berkshire Hathaway’s continued exposure, keeps showing up in trader discussions. Add in ongoing geopolitical tailwinds in global energy markets and Chevron’s positioning in both traditional energy and future-facing investments, and the news flow supports staying on the long side for now.
Trading Recommendation:
Here’s my take. I’m staying LONG on Chevron for this week, looking for a push into $188 first and $190 if momentum builds. I’d manage risk tightly with stops at $180 and $178, because a loss of that support would change the short-term picture. Confidence isn’t extreme, but the trader consensus clearly leans higher, and the risk-reward still makes sense.
How Repsol Is Poised to Triple Production in a PostSanctions EraThe Spanish Oil Major Betting Big on Venezuela's Future: How Repsol Is Poised to Triple Production in a Post-Sanctions Era
For most Americans, the name Repsol doesn't carry the same weight as Exxon or Chevron. But that anonymity could be short-lived. As geopolitical tides shift in early 2026, the Spanish energy giant is positioning itself for a dramatic resurgence in one of the world's most oil-rich—and historically volatile—nations. With the capture and removal of former President Nicolás Maduro and the subsequent easing of U.S. sanctions, Repsol is doubling down on Venezuela, leveraging three decades of on-the-ground experience to tap into the country's staggering 303 billion barrels of proven reserves.
A Calculated Bet on Political Change
The political landscape in Venezuela shifted seismically in early 2026. The departure of Maduro and the installation of a transitional government have opened the door for Western energy companies to re-engage with a nation that sits atop the world's largest proven oil reserves. For Repsol, this represents a pivotal moment. The company has maintained a presence in Venezuela through years of upheaval, nationalizations, and sanctions, a "wait and see" strategy that is now poised to pay dividends.
The U.S. government has facilitated this reopening through specific regulatory relief. New licenses from the Office of Foreign Assets Control (OFAC), particularly General License 49, now permit U.S. entities and their partners to negotiate new upstream contracts in Venezuela. This regulatory green light has given Repsol the clarity and confidence to move from a defensive posture to an aggressive offensive strategy.
From Debt Recovery to Production Surge
To be clear, Repsol's relationship with Venezuela has been far from frictionless. The country owes the Spanish major billions of dollars tied to past asset seizures and unpaid debts. During the company's February 2026 earnings call, CEO Josu Jon Imaz acknowledged these outstanding obligations but struck a notably optimistic tone. Rather than focusing solely on recouping past losses, Imaz signaled a strategic pivot toward future growth.
The company has unveiled an aggressive investment plan designed to triple its crude production in Venezuela to approximately 135,000 barrels per day within the next three years. The near-term target is even more ambitious: a 50% increase in output over the next 12 months. This production surge will be enabled by the new OFAC licenses and will focus on refurbishing dilapidated infrastructure—much of which has fallen into disrepair during years of underinvestment—to unlock stagnant reserves.
Looking further ahead, Repsol is already in active discussions with Venezuela's transition government about acquiring additional exploration and production blocks. The company is particularly focused on expanding its footprint near its existing holdings in the resource-rich Orinoco Belt, a region known for its massive deposits of extra-heavy crude.
Who Is Repsol? A European Powerhouse in Its Own Right
For investors unfamiliar with the Spanish major, Repsol is a large-cap integrated energy company that sits just below the "Big Five" supermajors—ExxonMobil, Chevron, Shell, BP, and TotalEnergies. As of February 2026, it ranks as the sixth-largest oil and gas company in Europe by revenue, trailing the supermajors but outpacing regional competitors like Poland's PKN Orlen and Austria's OMV.
Globally, Repsol is a significant mid-tier multinational. Its market capitalization of approximately $24 billion is a fraction of Chevron's $300 billion, but it punches above its weight in specific sectors. The company is a world leader in renewable fuels and made history as the first major oil company to commit to a "Net Zero by 2050" target, a pledge that underscores its dual focus on traditional hydrocarbons and the energy transition. Currently, Repsol produces about 550,000 barrels of oil equivalent per day, roughly one-fifth the output of a supermajor like Chevron.
From Spanish Monopoly to Global Player: A Brief History
Repsol's story begins in 1987, when it was founded as a state-owned entity tasked with consolidating Spain's fragmented energy sector. Interestingly, the name "Repsol" was not initially intended as the corporate identity; it was a popular brand of lubricant sold by its predecessor, REPESA, since 1951. The brand was so well-recognized by the Spanish public that the government adopted it as the official corporate name upon the company's founding.
Following Spain's entry into the European Economic Community, Repsol underwent a massive privatization process from 1989 to 1997, transitioning from a state monopoly to a publicly traded company. Its transformation into a global powerhouse accelerated in 1999 with the acquisition of the Argentine firm YPF, though that relationship ended bitterly in 2012 when the Argentine government nationalized its stake in a high-profile conflict.
A Survivor's Strategy: Three Decades in Venezuela
Repsol's commitment to Venezuela is not a recent development. The company first entered the country in 1993, building a 33-year history that has tested its resilience. Unlike many Western peers that fled during the era of nationalizations and sanctions, Repsol—alongside Chevron and Italy's Eni—maintained a "wait and see" presence, preserving its operational footprint and joint venture relationships.
Today, Repsol operates through several joint ventures with the state-owned PDVSA, most notably in the Petroquiriquire and Petrocarabobo oil fields. It also holds a 50% stake in the Cardón IV joint venture with Eni, which operates the Perla Field, one of the largest offshore gas discoveries in Latin American history.
Repsol's Venezuela Asset Portfolio: A Detailed Breakdown
As of 2026, Repsol's Venezuelan portfolio is diverse and strategically positioned across both oil and gas assets:
Petroquiriquire (Onshore Oil): Repsol holds a 40% stake in this joint venture with PDVSA/CVP. The asset operates across three fields—Quiriquire in Monagas State, Mene Grande in Zulia, and Barúa-Motatán in Trujillo—producing medium and heavy crude. This is Repsol's primary crude asset, and it just secured a 20-year extension through 2048, providing long-term visibility for its ambitious production targets.
Cardón IV / Perla Field (Offshore Gas): Repsol owns 50% of this joint venture with Italy's Eni. Located in the Gulf of Venezuela, the Perla Field is one of Latin America's largest offshore gas fields, currently producing approximately 580 million cubic feet of gas per day. This gas is critical for Venezuela's domestic power grid, and Repsol is targeting a 10% increase in output for 2026.
Petrocarabobo (Orinoco Belt Oil): Repsol holds an 11% stake in this consortium-based project within the Carabobo 1 project in the Orinoco Belt. While its stake is relatively small, the asset provides a strategic foothold in the region that holds the world's largest reserves of extra-heavy crude.
Quiriquire Profundo (Gas Exploration): Repsol holds a 60% stake in this dedicated license for non-associated gas exploration in Monagas state, covering approximately 93 square kilometers.
As of 2024, Venezuela was Repsol's second-largest market by production volume after the United States, with 256 million barrels of oil equivalent on its books. The country accounts for a significant 15% of the company's total proven reserves, underscoring its strategic importance.
The Debt Question: A Secondary Priority
Historically, Repsol had been receiving Venezuelan oil as payment for natural gas and naphtha—a diluent required to pump, pipe, and process the country's sludge-like heavy oil. This arrangement was disrupted in 2025 when the previous U.S. administration ended that relationship, leaving Repsol holding significant IOUs from the Venezuelan government.
While CEO Imaz is certainly interested in recouping the billions owed to the company, that effort has become secondary to the growth opportunity now presenting itself. In 2026, the long game is finally paying off. By maintaining its presence through years of uncertainty, Repsol has secured the operational knowledge, local relationships, and regulatory approvals needed to move swiftly as the country's energy sector reopens.
Beyond Venezuela: The Alaska Catalyst
While Venezuela captures the headlines, it is not the only driver of Repsol's near-term production growth. In a separate but equally significant development, the company is poised to achieve "first oil" at its Pikka Phase 1 project on Alaska's North Slope in March 2026. This project represents a major milestone for Repsol's global portfolio and will provide an immediate boost to production volumes independent of the Venezuelan ramp-up.
The Verdict: A Unique Opportunity in a High-Risk, High-Reward Environment
Repsol's aggressive push into Venezuela represents a high-stakes bet on the country's political and economic stabilization. The potential rewards are enormous: access to the world's largest oil reserves, a pathway to triple production, and the chance to leverage decades of operational experience ahead of competitors who are only now re-entering the market.
However, the risks remain significant. Venezuela's infrastructure is dilapidated, its institutions are fragile, and the transition government's longevity is untested. For Repsol, the decision to move forward reflects a calculated judgment that the opportunity outweighs the uncertainty. For investors, the company's dual drivers—a Venezuelan resurgence and an Alaskan production ramp-up—present a compelling narrative of growth from two very different frontiers. Whether this bet pays off will depend on Repsol's ability to execute in two of the world's most challenging operating environments.