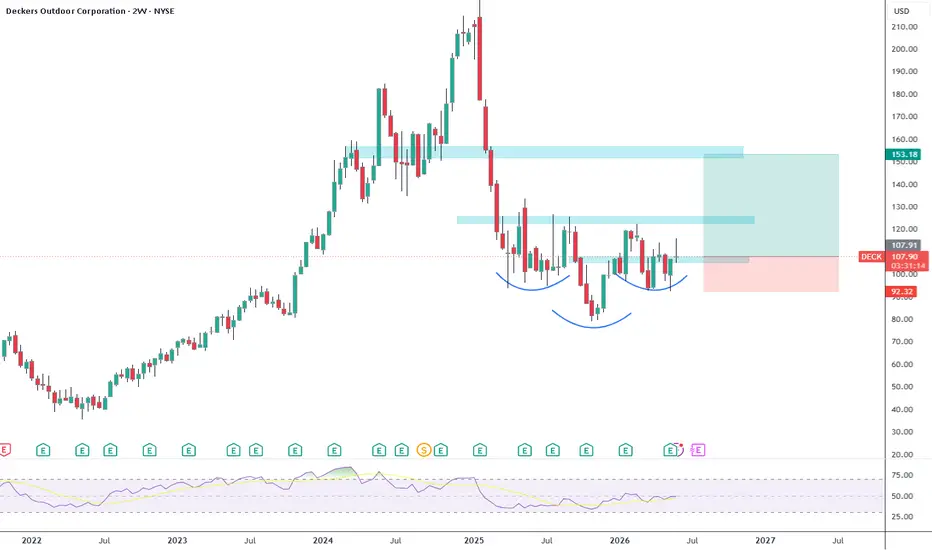
All Hands On DECK!Opened a position at 89.45 after hours. 3:1 RR Continues to show strength in UGG & HOKA brands. Guidance was slightly positive.Longby BogbeeUpdated 0
Explosive ideaInverse HS in two weekly timeframe, also looks good in the monthly timeframe. It is a clear reversal pattern and when it breaks out nothing is going to stop it. I have calls for Jan 2027 strike 125. SL triggers if a weekly candle closes as shown. I doubt it but it could happen. Longby ArturoLUpdated 110
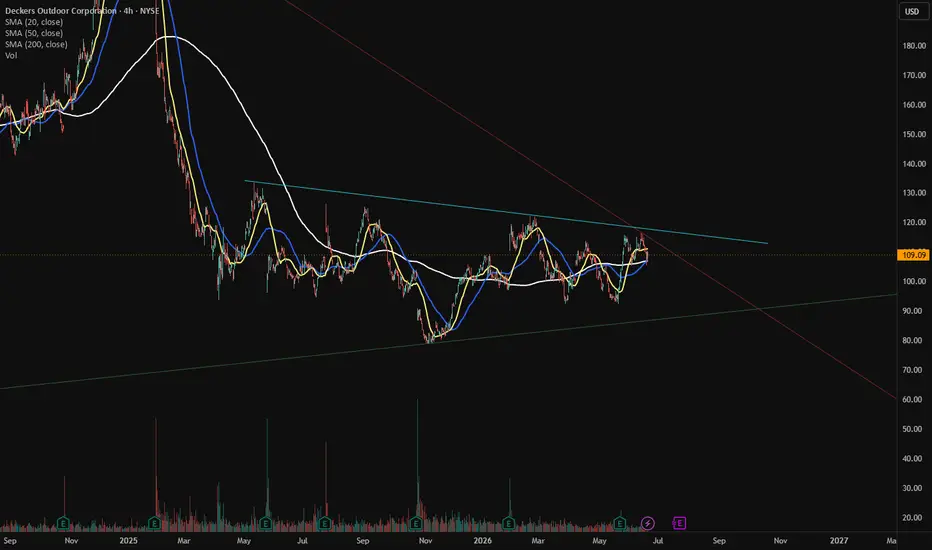
DECK - What side are you on ?ATH and long term support forming a wedge, most recent downtrend line rejecting price for a 3rd time. W pattern in price and 20MA with 20/50/200 converging. You could loosely call it a double bottom at $92, i don't buy that's the bottom right now. Macro tailwinds of economic pressures worldwide, inflation risks upcoming in July. UGG loses patent hearing. I believe if a retest at $110 fails, $105 support must hold or downside to $100 is in play. I will be watching for the break above or rejection. If rejected Jul17 - $105 put ($300) - Delta .333 / Theta.077. If a clear breakout above $110 a Jul 17 - $115 call ($300) - Delta .345 / Theta .077. $5 move either way could produce $150 (50%) gain/ROI. This is not investment advise - only my opinion - like it matters anyway, I was just bored this morning and needed something to do. NYSE:DECK by foggynogginUpdated 0
Big Base for $DECKThe bigger the base… NYSE:DECK continues to shake into this big base that started more than a year ago. Waiting for the new bullish waveLongby TizyCharts2
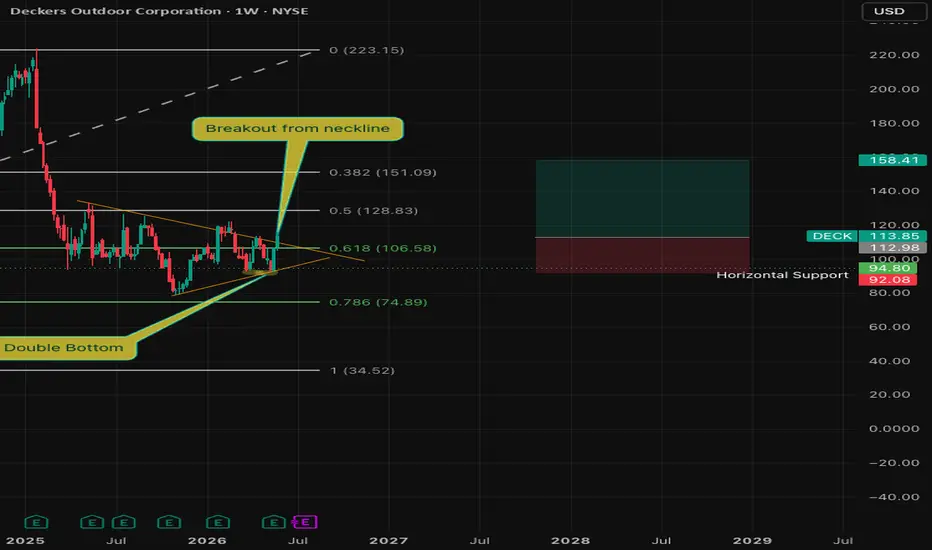
DECK: Symmetrical Triangle & Double Bottom Breakout Eyed Above $Macro Picture & Market Structure Deckers Outdoor Corporation (DECK) is showing an incredibly clean market structure right now, sitting in a prime location for a high-reward swing trade. After a period of consolidation, the price action is compressing into a well-defined symmetrical triangle, right at a critical inflection point. Technical Catalysts The Double Bottom ("W" Pattern): Looking at the chart, a clear double bottom has formed. We have successfully broken out of the "W" neckline, signaling strong accumulation and a shift in momentum from bearish to bullish. Symmetrical Triangle Compression: Price is currently squeezing hard against the upper descending resistance line of the triangle. The Trigger: While the intraday price action looks incredibly promising, the high-probability move requires patience. We are strictly waiting for a daily close above $115 to confirm the breakout and validate the pattern. Trade Parameters Entry Trigger: $115.00 (On a confirmed daily close above resistance) Take Profit (TP): $154.00 (Targeting the next major structural liquidity pool) Stop Loss (SL): $92.00 (Placed safely below the recent consolidation support to invalidate the thesis) Risk-to-Reward Ratio: ~1.7 reputation-builder. Let's see if the bulls can close the week strong and force the breakout.Longby InvestDeeper111
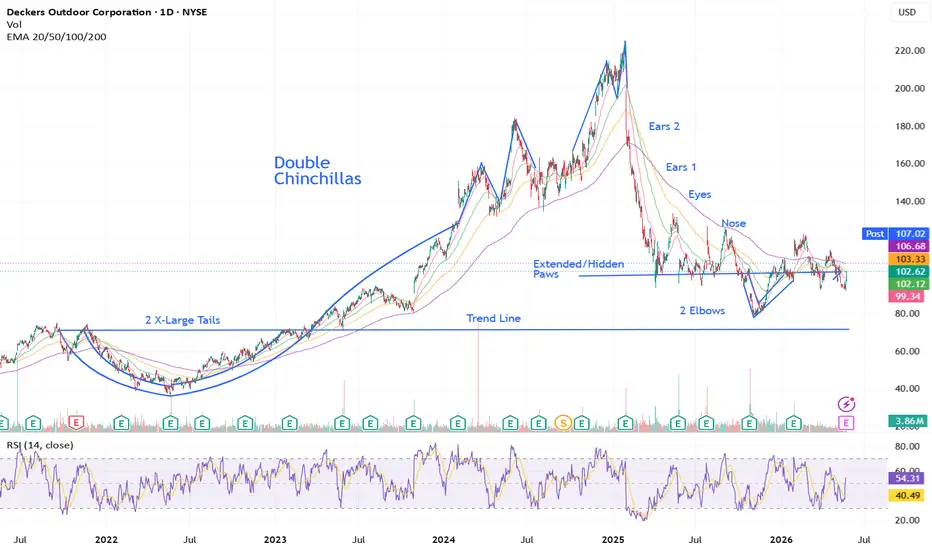
DECK Double Chinchilla Bounce UptrendThis is an informative, storytelling method to explain my idea. In this particular pattern, we encounter 2 chinchillas, or the 'Double Chinchilla' Bounce Uptrend. They are both ready to bounce or spring upwards. This analysis involves complex technical analysis and chart patterns, which I’ll explain from the perspective of a chinchilla. (And yes, being a chinchilla owner adds a playful twist to my approach to trading.) It's also a method for understanding how a stock works, as almost if has 'breath' allowing some up and down movement, as it moves up. Highlights: - Manufacturer of HOKA and UGG brand shoes - Earnings & revenues strong - Strong forward guidance - More share buyback approved In summary: Deckers Outdoor Corporation (DECK) provides great consumer brand names both in USA and internationally. RYW_Method research and analysis identifies DECK is well-positioned to gain growth through this year. Target 1: 108 Paws Target 2: 127 Nose Target 3: 141 Eyes Target 4: 155 Ears, from 1st Chinchilla Target 5: 176+ Ears, from 2nd Chinchilla * Exercise caution, as 2 chinchillas can bounce to unpredictable vertical heights, before a drop back down. And, these targets are not time-based, expect 'pullbacks/breathing' on the way up. Trading will fail if the paws drop below Trend Line: 71 I appreciate the opportunity to share this story, my observations on the stock, and my predictions. Please note, this is not financial advice.Longby RYW_Method1
5/14/26 - $deck - already px'ing in... buy5/14/26 :: VROCKSTAR :: NYSE:DECK already px'ing in... buy - hoka trends > on - valuation perhaps cleanest at 10x ebitda and mid-teens PE - HSD fcf generation on a net cash balance shee - NYSE:ONON and NYSE:BIRK results and consumer data showing slowdown in consumer is not news to us at this point - this stock already px'ing in that action - i'd be a buyer lower - and unlike NYSE:YETI (where GT's confirmed and chart had nice setup), this one does have that lower high may (but it's not dissimilar to the other shoe brands except the sell off already happened). the google trends (GTs) look solid and still above trend - i'd buy this here and lower - expect a pop into results. i'm necking out w/ some 70 delta calls for sep for juice VLongby VROCKSTAR3
DECK — Compression Near Resistance: Breakout Setup Building?Hello Everyone, followers, DECK - Deckers Outdoor Corporation is the last one from my side for this week. Let's drill down: 📊 Technical Overview DECK is forming higher lows while pressing into a strong resistance zone around $128–130 . Price recently broke above the short-term downtrend and is now compressing — a typical pre-breakout structure. Moving averages are flattening and turning upward, suggesting momentum is rebuilding after the previous correction. 🔹 Key Levels Support 112 → Key structural support 100 → Major demand zone 85 – 90 → Long-term support Resistance / Targets 128 – 130 → Breakout trigger level 133 → Next supply zone 150 → Major upside target 🔮 Outlook The structure favors a bullish breakout scenario, but confirmation requires a strong daily close above resistance. 🎯 What I Expect If price breaks and holds above 130 , momentum could accelerate toward 133–150 . Failure at resistance could lead to another pullback toward 112 before the next attempt. If you enjoy and like clean, simple analysis — follow me for more. This is just my thinking and it is not invesment suggestion , please do not make any decision with my anaylsis. Have a lovely Sunday to all and hopefully green trade day for next Week. #TechnicalAnalysis #TradingView #Stocks #USStocks #PriceAction #TrendTrading #SwingTrading #BreakoutSetup #Consolidation #TradingSetupLongby streak35Updated 111
Deckers May Have StalledDeckers Outdoors plunged in late 2025, and now traders may see further downside risk. The first pattern on today’s chart is the drop on October 24 after guidance trailed estimates. The footwear company rebounded in December, but it could be showing signs of stalling this month. Second is the $99.70 level, the final price on Friday, December 5. DECK mostly stayed above that weekly close until breaking sharply below it yesterday. Third, the current weakness is occurring at the falling 100- and 200-day simple moving averages. That may confirm a long-term downtrend. Fourth, the 8-day exponential moving average (EMA) just crossed below the 21-day EMA. MACD is also falling. Those signals may reflect short-term bearishness. Finally, DECK made a 2 1/2-year low of $78.91 in November. Could trend followers view that as a natural level for a retest? TradeStation has, for decades, advanced the trading industry, providing access to stocks, options and futures. If you're born to trade, we could be for you. See our Overview for more. Past performance, whether actual or indicated by historical tests of strategies, is no guarantee of future performance or success. There is a possibility that you may sustain a loss equal to or greater than your entire investment regardless of which asset class you trade (equities, options or futures); therefore, you should not invest or risk money that you cannot afford to lose. Online trading is not suitable for all investors. View the document titled Characteristics and Risks of Standardized Options at www.TradeStation.com . Before trading any asset class, customers must read the relevant risk disclosure statements on www.TradeStation.com . System access and trade placement and execution may be delayed or fail due to market volatility and volume, quote delays, system and software errors, Internet traffic, outages and other factors. Securities and futures trading is offered to self-directed customers by TradeStation Securities, Inc., a broker-dealer registered with the Securities and Exchange Commission and a futures commission merchant licensed with the Commodity Futures Trading Commission). TradeStation Securities is a member of the Financial Industry Regulatory Authority, the National Futures Association, and a number of exchanges. TradeStation Securities, Inc. and TradeStation Technologies, Inc. are each wholly owned subsidiaries of TradeStation Group, Inc., both operating, and providing products and services, under the TradeStation brand and trademark. When applying for, or purchasing, accounts, subscriptions, products and services, it is important that you know which company you will be dealing with. Visit www.TradeStation.com for further important information explaining what this means.by TradeStation3
Reversing The price seems to have found a bottom and is beginning to rise, supported by rating upgrades and strong sales forecasts for the next quarter. It is approaching a breakout above the black resistance, with the next target at $104.10 (light blue resistance), the previous high, where it will also meet the weekly SMA200. This could be a potential entry or accumulation opportunity. For greater safety, wait for a confirmed close above $104.10 to validate the bullish signal.Longby balinor115
ALL-IN DECK!!!!Boys let's go ALL-IN!!!! Reversal expected from this level. Many stocks dropping giving us a chance to get them for cheap. Longby YFXTradingUpdated 779
Widening The Channel??Deckers looks appealing at its current price but I think a sideways move is in the future to widen the channel. Watch the lower timeframes for confirming the direction. Be patient and see what happens at the 40-60 zone in my opinion. by Cashcrash2
DECK in BUY ZONEMy trading plan is very simple. I buy or sell when at either of these events happen: * Price tags the top or bottom of parallel channel zones * Money flow volume spikes beyond it's Bollinger Bands So... Here's why I'm picking this symbol to do the thing. Price in buying zone at bottom of channel Money flow momentum is spiked negative and under at bottom of Bollinger Band Entry at $81.05 Target is upper lower channel around $96Longby chancethepug2
$DECK is getting ridiculously cheap- NYSE:DECK fundamentals are in tact and investors have panic sold shares because of tariff fears which are overblows. - NYSE:DECK has a long runway to grow internationally - NYSE:DECK might close the gap below and then close the earning gap above before next earnings. - NYSE:DECK earning reaction was most likely a kneejerk and definitely overblown. - NYSE:DECK has pending share authorization which they will employ to scoop cheap shares and boost EPS. - NYSE:DECK doesn't have debt therefore a pristine balance sheet as wellLongby bigbull037449
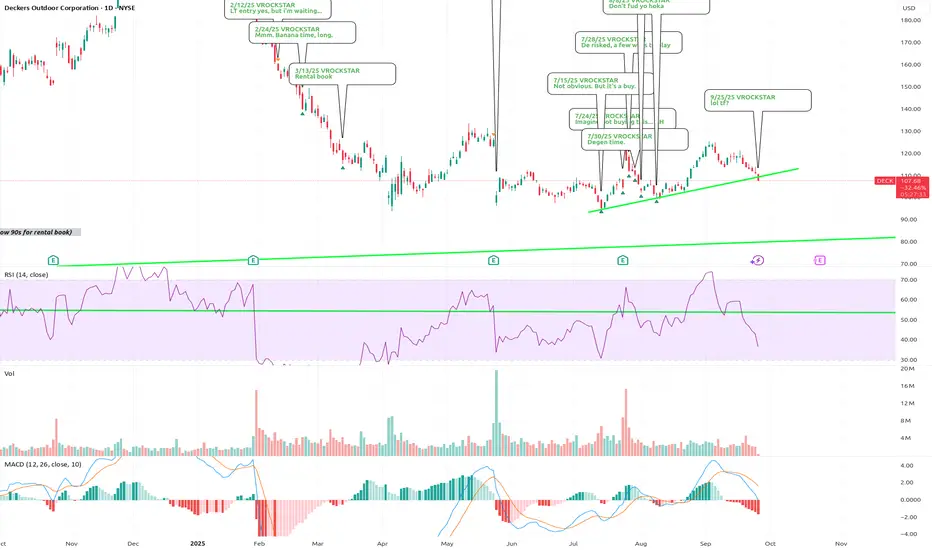
9/25/25 - $deck - lol tf?9/25/25 :: VROCKSTAR :: NYSE:DECK lol tf? - while the market bot the "generational dip" as X pnl posters call it, on quantum memes and underpants gnome nuke co's - here's a name that... still gets no love - people are going to walk around barefoot in an AI-youre-out-of-a-job-world... i guess. - don't overlook the low hanging fruit for the woman in the red dress, Neo VLongby VROCKSTARUpdated 773
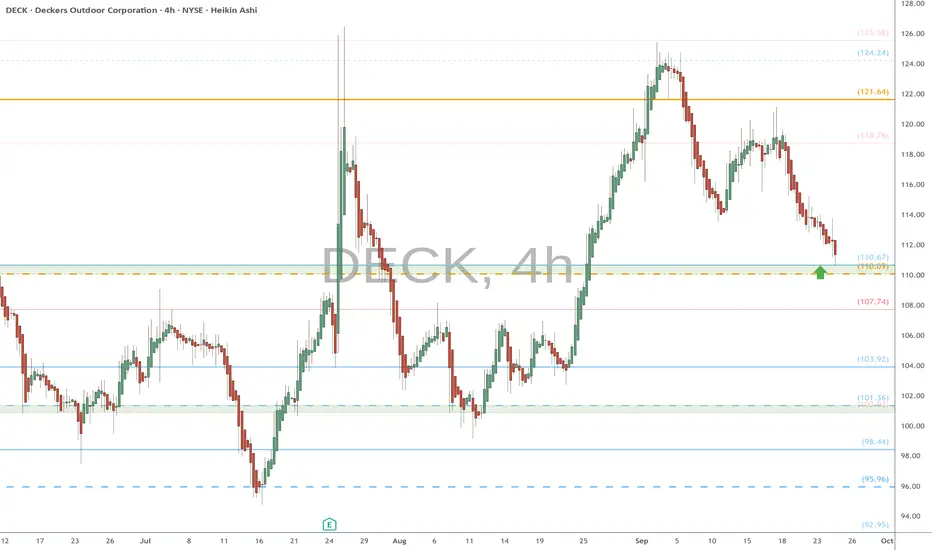
DECK eyes on $110: Key Support if held could mark BOTTOMDECK in a downtrend since our alert 9 months ago. Currently testing a key support at $110.09-110.67 Looking for a bounce here, with tight stop loss . Previous Analsis that caught the EXACT TOP: Hit BOOST and FOLLOW for more such PRECISE and TIMELY charts. ========================================================= .by EuroMotif333
8/8/25 - $deck - Don't fud yo hoka8/8/25 :: VROCKSTAR :: NYSE:DECK Don't fud yo hoka - idk why 7+% fcf yield, buybacks, 35%+ ROICs, growth in 2H (worst behind us) and growing HSD++ is unattractive in this tape - but i'll take the over here - here's the deal... NASDAQ:CROX result was pretty bad. but honestly even that thing's a trading buy here. - but if you're stacking size, you stack the best in class names. if you can get NYSE:ONON at a discount that's the diamond. but NYSE:DECK is for the rest of us. and it's a heck of a lot cheaper with great mgmt, results - don't forget that the NYSE:ANF chart compare we made in a few posts again is holding to a T - does that mean we r close to bottom? honestly that's not my game, i'll leave that to the 99% of tea leaf readers that post on TV - instead what i'll say is i'm stacking size in the 10-20% ITM leaps here and feeling uber comfy. actually reminds me a lot of uber when i was writing about that before last year. same sort of shaky shaky price action that scared out the norms before they got their hand held by papa ackman. well V is here to tell you, you owe it to your portfolio to turn over this rock with more seriousness ( NYSE:DECK ) be blessed. don't fud the hoka. VLongby VROCKSTAR114
8/1/25 - $deck - 50% position8/1/25 :: VROCKSTAR :: NYSE:DECK 50% position - if you have followed long enough, you know that when i write this sort of thing, it's maybe 5-10x a year, at most - i still think anything can happen here in the mkt, so there are a lot of arrangements i've made in my portfolio to account for further drawdowns - with that being said, conservatively DECK is 6% fcf money, and on my #s probably closer to 7%. when you're growing minimally MSD (nevermind HSD+) eventually this gets revalued - so my preference is to barbell exposure - i have a LT exposure w ITM leaps (jan '27 expire) and then i have my jet fuel that i'm burning in the last few sessions to get exposure higher - think about it like this - if 1 unit of risk costs me $1 today and $10-15 in 2027, if in this type of tape we leg down... if i say had 1 unit of risk on both of those exposures, i'd lose 1 on the first (zero) and then maybe 2...3...4 on the other. - which is to say, as we go lower here, i eventually find myself growing that LEAP exposure quite large. rn it's about 25% of my effective book on about 5x leverage. and the other 25% is spread between 10-1 and 20-1 leverage. if you look at ANF post results a month or so ago, this looks VERY similar and there are a lot of similarities in terms of how shorted/ positioning was into the event (same with NASDAQ:LULU btw, yet to report). by the 6th day... we ripped back to the first fib band. - that would put next week at 107/108 and if mkt is bid, we hit 110 again. so that's why i'm using the 10-1 and 20-1. it's actually in part a trading call as well backed by my own view/ conviction on fundamentals. i think the flows today took us now far below fair value and we've filled the pre-earnings gap, which was important to point out. - still doesn't rule out the mkt continues to puke, this is weak beta etc. etc. but from a 12-18 mo POV... this is money good in my estimation no matter what strike, unless you're degen'ing 10 delta BS (not recommended but also not my $, u do u) be well remember in this tape we all lose money it's just important to lose less and find spots that will get bid back first, i think deck is one of those *for me VLongby VROCKSTAR443
7/30/25 - $deck - Degen time.7/30/25 :: VROCKSTAR :: NYSE:DECK Degen time. - look at the last NYSE:ANF report... and tell me you're not noticing the exact same pattern. massive rip. massive gap fill retrace. - do we re-test pre-report levels mid to low $100s? - that's what keeps me buying ITM leaps here, but going quite large - i'm trying to figure out w/ $V report, consumer spending... all consistent w my views, why this doesn't become just the most obvious winner into 2H and '26 - so i'm buying myself some time w/ these expires and ITM - but it's degen time. VLongby VROCKSTAR2
7/28/25 - $deck - De risked, a few ways to play7/28/25 :: VROCKSTAR :: NYSE:DECK De risked, a few ways to play - mid teens PE - 2 brands hitting on all strides (pun intended) - great result, everyone offsides - the action you're seeing here is MM re-adjusting post pop - can buy spot/ sell covered calls for healthy mid 40s IV and roll - my sense is sub $110 you are getting almost a simple play into YE and anything lower is increasing value (mid singles FCF yield growing DD, "yes please") - so yeah, i like NASDAQ:LULU b/c of the google trends and valuation etc. etc. (go check that one out before tradingview removes it a third time) - but this one back in the sub $115 zone is comfy like an (h)ugg VLongby VROCKSTAR2
DECK - Is the GAP fill inevitable?📰 Deckers Outdoor (DECK) — Technical & Macro Update Ticker: DECK | Chart Timeframe: 30‑minute | Current Price: ~$117 Sector: Footwear & Apparel Date: July 26, 2025 ⚡ Market Recap Deckers made waves this week with a strong mix of earnings momentum and analyst reactions: 👟 Blowout Q1 Earnings: Revenue came in at $965M, up ~17% year-over-year. Hoka grew 20% and UGG grew 19%, with international sales surging nearly 50%. EPS of $0.93 smashed expectations. Management issued strong guidance: $1.38–$1.42B revenue for FY and EPS between $1.50–$1.55. 📈 Stock Surge Followed by Pullback: Shares spiked over 12% intraday after the earnings release, but cooled off shortly after, reflecting some hesitation or profit-taking. Volume doubled the 50-day average, showing strong investor attention. ⚠️ Price Target Downgrade from Goldman Sachs: Goldman Sachs cut its target from $90 to $87, maintaining a Sell rating. Their concern lies in margin pressure from tariff exposure in Deckers' overseas production chain. 🧾 Divergent Analyst Views: TD Cowen raised its target to $154, while other analysts remain neutral to bearish with targets ranging between $100 and $137. The Street’s average 12-month target hovers around $123, though the lowest target now sits at $87. 🔍 Technical Breakdown (Chart Overview) Price Structure: Price rallied into a key resistance zone after earnings and is currently consolidating just below $118. A broad consolidation range has formed between ~$105 support and ~$132 resistance. Chart suggests the formation of a potential double-bottom reversal pattern, anchored by the $95–$105 zone. ✅ Bullish Case Trigger: Break and close above $132–134 Target Zones: $150 → $160 → $182 Supporting Factors: Hoka and UGG continue to post record growth International expansion is offsetting soft U.S. sales Solid earnings guidance and positive revisions from bulls like TD Cowen ❌ Bearish Case Trigger: Breakdown below $105 Target Zones: $95 → $87 Risks: Exposure to tariffs and global supply chain constraints Sluggish domestic sales and brand saturation Goldman’s downgrade reflecting downside institutional risk 🧠 Strategic Takeaway Deckers is at a technical inflection point. The recent earnings beat lends credibility to the bullish case, but macro headwinds and analyst skepticism inject caution. Price is trapped below resistance, and traders should await confirmation of breakout or breakdown. Watch for a clean breakout above $132 or breakdown below $105 before committing to directional bias. Volatility and volume are elevated — trade setups could trigger fast. 📊 Summary Table Outlook Key Price Trigger Potential Targets Key Drivers Bullish Break above $132–134 $150 → $160 → $182 Hoka/UGG momentum, strong earnings, analyst upgrades Bearish Fall below $105 $95 → $87 Tariff exposure, U.S. softness, Goldman’s $87 price targetby QuantAi-Trend1
7/24/25 - $deck - Imagine not buying this... AH7/24/25 :: VROCKSTAR :: NYSE:DECK Imagine not buying this... AH - amazing to listen to the mental degradation of "sell side analysts". - the quarterly ritual when real shareholders must endure management answering the room temperature IQ questions from these "research" providers is a circus - right now there's a sell side "analyst" demanding an explanation for how 1 + 1 = 2. "put some meat on the bone" he says - then he interrupts - it's really amazing the way Elon handles these retards, i wish more mgmt teams would simply tell these folks the truth - but alas results is a smash. forget the minutia - big revenue beat - key brands growing (lol NYSE:NKE is not even growing and trades 2x multiples) - buying back shares - DTC is a tailwind so weird AH action to see +15-20% then retrace to +2% i'll be sizing this up and will respond tmr/ what i'm deciding. will be taking the 6x leverage on 1% 6mo ITM leverage to probably 2-3x leverage on 18 mo (jan '27) expires and targeting a gross of ~10%. be well. enjoy. VLongby VROCKSTAR5
Long $DECK - NYSE:DECK is the only growth story I'm comfortable buying. This was wall street darling for many years. I believe sell off was overdone. - It has lot of room to run. It is getting traction and NYSE:NKE because of law of large number is not growing much in %age. - However, NYSE:DECK has lot of road ahead and it can grow for many years to come. Global expansion is also not out of the question. - I strongly believe NYSE:DECK will make an all time high when this tariff narrative takes a backseat. - Another bullish thing for NYSE:DECK is that Trump doesn't plan to bring back shoes or clothing manufacturing back in US. Longby bigbull037Updated 553
 Long
Long