Freeport Might Be Breaking FreeFreeport-McMoRan hit a record high in August. Now after a pullback, some traders may see further upside.
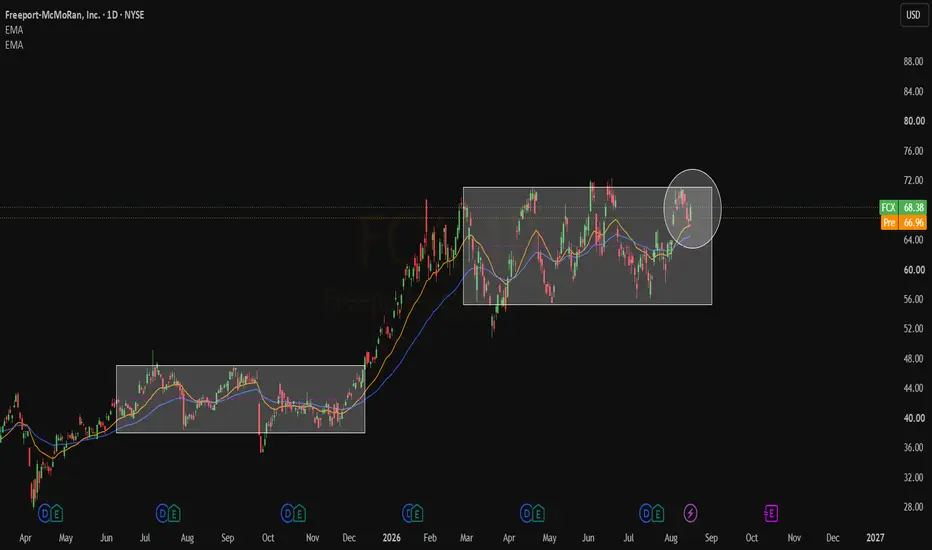
The first pattern on today’s chart is the narrowing range on either side of about $70, accompanied by tightening Bollinger Bandwidth. Does this compression create potential for a breakout and price expansion?
Second, the 50-day simple moving average (SMA) is above the 100-day SMA. Both are above the 200-day SMA. That configuration, with faster SMAs above the slower SMAs, could reflect a bul
In-depth trading ideas
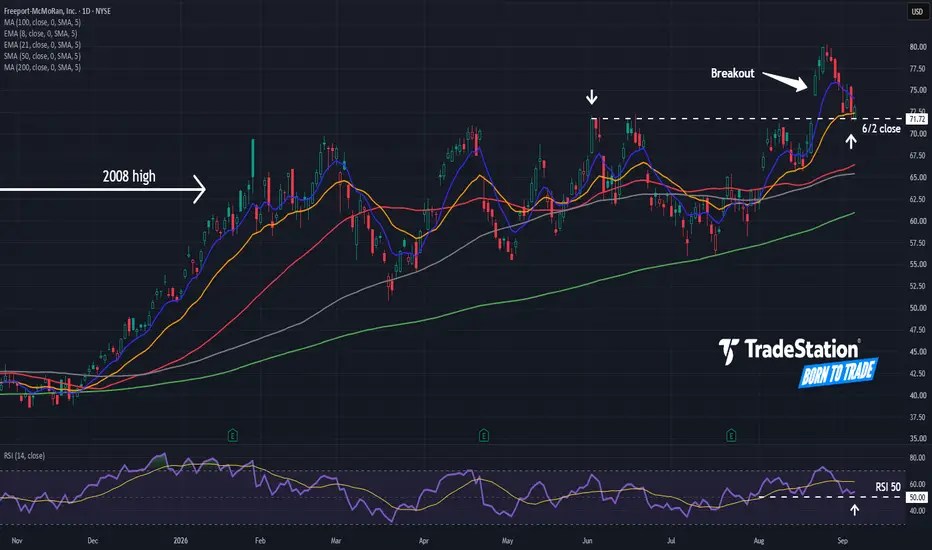
Freeport Pulls BackFreeport-McMoRan broke out two weeks ago, and now it’s pulled back.
The first pattern on today’s chart is the August 21 surge after intervention by the U.S. Treasury helped soften the U.S. dollar. That may suggest the presence of new buyers.
Second, the copper miner’s previous closing high of $71.72 occurred in early June. It’s now trying to hold that level. Is old resistance becoming new support?
Third, Wilder’s Relative Strength Index (RSI) has remained above 50 since the beginning of last
FCX | Continued stock growth- Timeframe: Weekly
- Trade type: Buy stop order
- Price: 63.65
- Take Profit: Open
- Stop Loss: 58.19 (-8.60 %)
Idea: Long on a breakout above last week's high - bullish momentum continuation.
Entry: Buy stop above last week’s high.
Stop-loss: Below the low of the same candle.
If the weekly candle closes below this level, the trade is invalidated.
Take Profit: Trailing stop following the lows of new weekly candles.
FCX Options Setup: Bearish Signal & Volatility📊 Signal Metrics & Confirmation
State: EARLY_CONFIRMATION
Current Spot Price: $75.39
RSI (14): 60.50
Signal Return: +3.86%
MFE / MAE: MFE 4.51% / MAE 1.81%
🎯 Option Contract Details
Contract: 75.00P · Expiring 18-Dec-2026
Delta: -0.430
DTE (Days to Expiration): 109
Bid/Ask Spread: 4.00%
Open Interest (OI): 452
Reasoning:
The BEARISH signal entered EARLY_CONFIRMATION within just 2 trading sessions as FCX pulled back from $78.42 to $75.39, deliv
$FCX, why I believe it has a realistic path to doubling.NYSE:FCX , why I believe it has a realistic path to doubling.
AI, data centers, grid expansion and electrification are all driving copper demand, while new supply takes years to bring online.
If copper enters a structural bull market, NYSE:FCX has significant upside.
NYSE:FCX #Copper #AI #Commodities
The long-term copper demand thesis is supported by AI/data-center growth and electrification, while supply expansion remains a major challenge.
Scarcity Portfolio: Long Copper, Power & Crashed MemoryI run a thematic long book built on one macro premise: physical scarcity is repricing faster than equities acknowledge. Four engines, ten positions, all catalyst-dated. Sharing the full logic and my actual allocation.
ENGINE 1 — COPPER: THE CLEANEST SCARCITY TRADE ( NYSE:FCX x15, NYSE:SCCO x5)
LME copper cancelled warrants (metal already earmarked for withdrawal, so not really available) hit 62.4% of total stock — versus 4-18% for every other base metal. Live stock is down 71.8% from the Apr
$FCX – The Copper Supercycle Breakout!!?The Pattern: NYSE:FCX has completed a massive, 10-year W-Bottom. The first trough was set in 2016 at **$3.52**, followed by a second higher low in 2020 at $4.82. The recent monthly close above the $60.00 neckline validates this multi-year trend reversal.
The Log Target: On a logarithmic scale, the measured move from the $3.52 low to the $60.00 neckline implies a potential technical target in the $1,000+ range if the full percentage-based move replicates. While that is a long-term "moonshot,"
FCX Long — $FCX pulling back to the breakout shelf at $69, HTF uOn the 4h chart, FCX has established a clear uptrend from the late-April low near $56 through successive higher highs and higher lows, culminating in a push to $72+ in early June. The most recent structural event is a mild pullback from that $72 high into the $69–70 zone, which previously acted as a consolidation shelf and breakout base in early June. Price is now sitting precisely at that retest level. On the 1h chart, the June 17 session printed a sharp bearish rejection off $72.28 that dragge
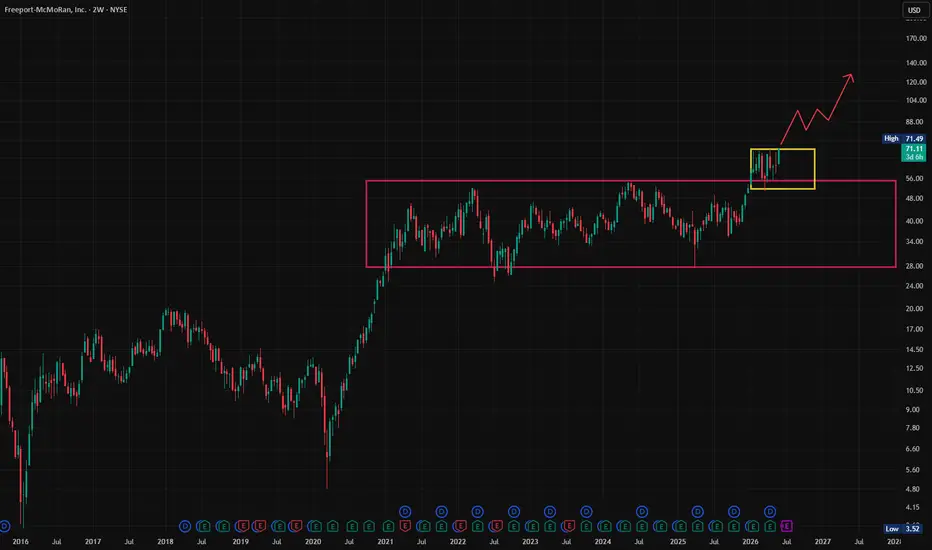
$FCX Breakout and bullish ascending triangleLooking at the charts for FCX today and we can see that we have a huge long term sideways price action over the past 20 years. We're the current price is looks like a steady increase in volume and a build up on the RSI.
I'm expecting that we might see another retracement, but ultimately building towards a strong breakout.
Watch this chart. I don't have a price target, but the move could be quite long and strong.
Freeport Flirts with Record HighsFreeport-McMoRan has been challenging a long-term level, and some traders may think a breakout is coming.
The first pattern on today’s chart is the series of higher lows since mid-March, which may reveal buying pressure.
Second is the previous all-time high of $63.62 from 2008. The copper miner jumped to that price zone in late January and has pushed against it repeatedly since. Could it move through the resistance soon?
Third, the 50-day simple moving average (SMA) is near the 100-day SMA. T
$FCX NEW ALL-TIME HIGH!I said in before that I was highly confident the stock would double from there, either this year or next year.
With this breakout to new highs, I believe the odds have increased significantly that it happens this year.
Bought a major position at the bottom and will sell it all in the highs.
FCX: bullish potential for 2026Among a few bullish trend structures we are currently watching and planning to participate on the long side.
Price has entered and already reacted from an important mid-term support zone at 54–50, where we expect a higher low formation and continuation toward the larger degree resistance zone at 78–89 in the coming months.
Chart:
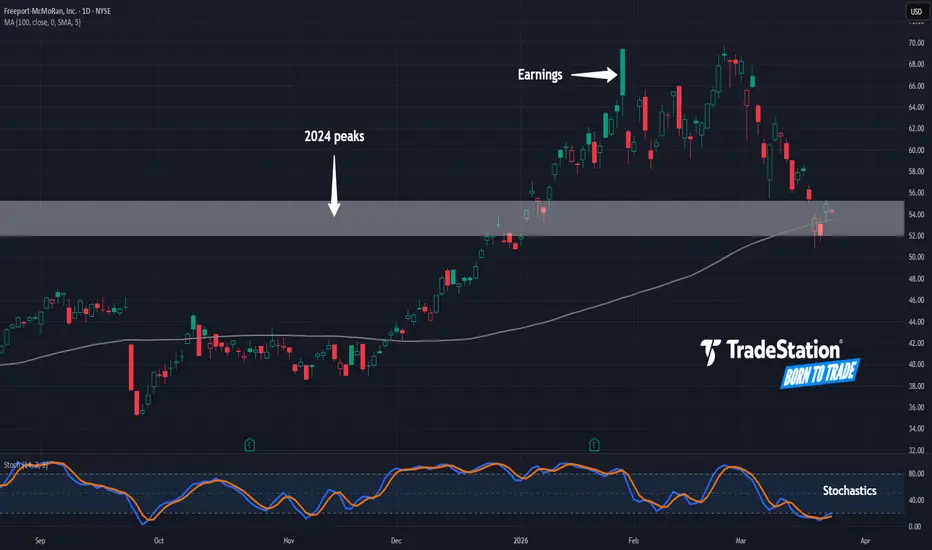
Freeport May Be OversoldMetal producers like Freeport-McMoRan outperformed before the Iran war, and now some traders may think the copper stock is oversold.
The first pattern on today’s chart is the price range between $52 and $55.30, which matches long-term peaks from 2024. With FCX holding those old highs, is resistance becoming support?
Second, the stock is bouncing at its rising 100-day simple moving average. That may suggest its longer-term uptrend remains intact.
Third, stochastics have dipped to an oversold c
FCX - Pick of the Week, March 2FCX is currently exhibiting a clean, persistent weekly uptrend, supported by:
• Strong higher highs and higher lows on the weekly timeframe
• Weekly momentum readings consistent with trend continuation
• Price action pressing into new highs rather than mean reverting
From a macro perspective, FCX remains tightly linked to copper supply narratives and operational developments, including production sensitivity and restart timelines extending into mid 2026. These factors create a plausible multi mo
FCX - We had a great month, can we continue with the uptrend?FCX
Looking for a potential buy!
🔍 Technical Context:
FCX had a tremendous up-beat with 24% increase in the stock just in march!
MACD Bullish Crossover: A clear bullish cross on the MACD confirmed upward momentum.
RSI Strength: The RSI remains in bullish territory, signaling further upside potential.
Favorable Risk-Reward Setup: The stock maintains support above breakout levels, offering an attractive trade opportunity.
📰 Fundamentals
Analyst Upgrades: J.P. Morgan and Scotiabank both issu
Freeport-McmoranFreeport-McMoRan Inc. (NYSE: FCX) is a leading international mining company and one of the world's largest publicly traded producers of copper. Headquartered in Phoenix, Arizona, the company also produces significant quantities of gold and molybdenum.
Core Operations & Assets
Freeport-McMoRan operates a diverse portfolio of long-lived assets across three continents:
Indonesia: Operates the Grasberg minerals district in Papua, which contains the world's largest gold mine and second-largest co
Earnings Conflict Alert: AI Turns Bearish Into FCXFCX Earnings Signal | 2026-01-21
🎯 Trade Bias
Primary Direction: BUY PUTS
Confidence: 55%
Conviction: MEDIUM
🧠 Trade Rationale (Why This Trade)
Katy AI predicts a short-term downside move (-0.77%)
Stock is overbought (RSI 75.7, Stochastics 85.8)
Setup favors a pre-earnings pullback / sell-the-news
Fundamentals are bullish → conflict increases volatility risk
💰 Options Trade Setup
Option Type: PUT
Strike: $60.00
Expiry: Jan 23, 2026
Entry: ~$1.40
Target 1: $2.10 (+50%)
Target 2: $
Freeport May Be Coming to LifeFreeport-McMoRan has been in a tight range for months, but some traders may think the copper miner is coming to life.
The first pattern on today’s chart is the falling trendline along the highs of late September and late October. Prices pushed above that line last week and are also challenging $43.31, the October 9 close that’s also presented resistance.
Second, the 50- and 200-day simple moving averages are almost on top of each other. That highlights the long period of sideways movement. Wit