Barrick GoldThe last time Gold was trading at $2100, Barrick Gold was at $26! Today it is still below $16. The world is obsessed with tech stocks while the gold stocks are deeply undervalued. This is such a strong buy.
This chart shows the physical Gold price versus Barrick Gold. Both have been rebased to 100 and so that they can be accurately compared. Gold has pushed to new highs while the mining stock has drifted lower and lower.
This gap will close, and we think the safest way to play it is to be lon
Gold.com, Inc.
No trades
No trades
In-depth trading ideas
Why $42.45 Could Decide the Next Trend Amid Rising Middle East TFor most of the past week, the market seemed comfortable believing geopolitical risks were beginning to ease. The preliminary US-Iran peace deal helped push crude oil back toward pre-conflict levels, reducing inflation concerns and encouraging some profit-taking in the US Dollar. On paper, that should have created a more supportive environment for gold.
That narrative may already be changing.
Reports that Iran's Islamic Revolutionary Guard Corps allegedly attacked a cargo ship passing through
Barrick Gold $GOLD | On The RadarToday on the radar, Barrick Gold
Barrick Gold has attracted some attention as major investors, including recently the notable Stanley Druckenmiller, have taken significant positions. With these influential players entering the fray, while the gold market experiencing remarkable momentum, the question emerges: Is this the right moment to buy? Well, let's dive on it and look at some fundemantals, some metrics and some technicals.
The fundemantals
Gold has exhibited remarkable resilience, maint
Barrick Gold Technical setup on the weeklyHello guys!
Barrick Gold on the weekly looks pretty bullish. In context of Gold rising, there is no telling where Gold could top out. It's RSI keeps making higher highs and canceling most bearish divergences, and so I think Gold's prices could remain elevated for years to come.
Barrick Gold (strong buy) I want you guys take a look at some things real quick
Current Environment Macro Landscape:
Defensive + Hard Assets -
Gold, Miners, Energy, Real Estate (inflation hedges)
AI & Mega Cap Tech -
MSFT, NVDA, AMZN — inflows
China / Trade War Plays -
FCX, CAT, Global Industrials
Reflation / Commodity Rotation-
Oil, Copper, Uranium, Ag plays
gold:
safe haven play amid geopolitical risk and tariffs
Strong correlation with real interest rates + USD — lower rates + weaker dollar = bullish
Tariffs = i
Long after earnings.Earnings Scenarios
Optimistic Scenario
Probability: 65%
Assumption:
The company will exceed EPS expectations (0.25 USD) due to increasing demand for gold as a safe-haven asset amid geopolitical uncertainties and inflation.
Market Reaction:
The stock price will rise to 18.5 USD (+10%).
4x Triangle breakout on Golds rising tide Bullish chart
Looks like multi year triangle break out my guess is upside
It could break out and stop at a fib target so guess round number is 80 at fib =1
I am tracking about 22% increase from here to gold base metal target so this is 4x of that move which seems a lot can it do that in 2025 or will we need a bit longer. I don't know, lets wait and see its a multi year chart so muli year target
Equites look over valued generally so this may be a safe haven in any bear market because it ho
Bullish on BarrickYeah so, my purchases of GOLD in the past few years haven't tracked the gold price very closely. As leverage on physical gold it hasn't been such a good pick.
However, I am seeing some signs of a change in price-action. Daily RSI is showing higher lows, while price is testing everyone's patience :) making lower lows. Normally hints at a change in direction is coming up. If we get a lower low in price, but the RSI level fails to dip below the 30 level, see that as confirmation. May or may not ge
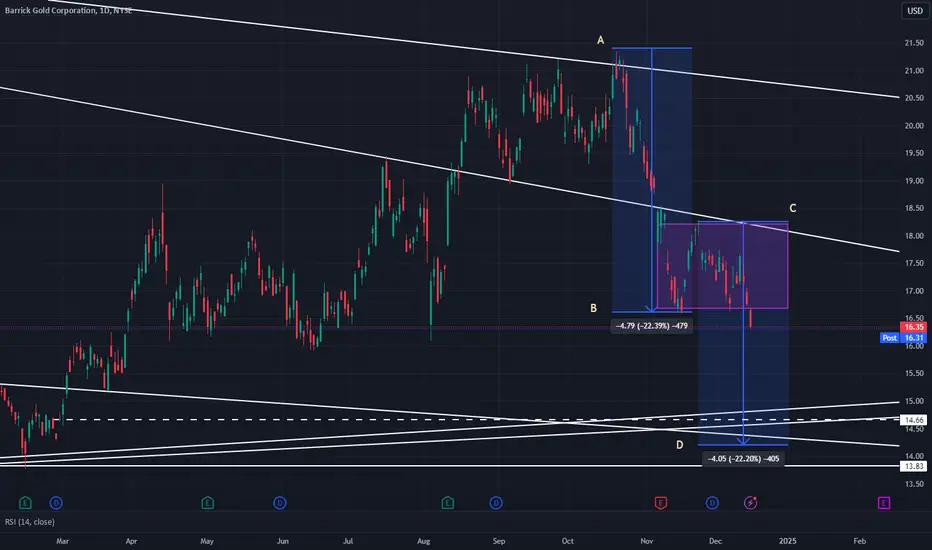
GOLD - Falling Wedge ABCD PatternGOLD has broken down from bearish rectangular consolidation. Prior to bearish rectangle, a falling wedge was formed from recent highs. Now it seems falling wedge is part of ABCD pattern, which means there is one more leg downwards to go.
In ABCD pattern, the size of the second move downwards is very much the same as first move (either in $ or % terms). The projected price of completion of this falling wedge with ABCD pattern is between 14 and 14.50 because this coincides with:
- a number of tr
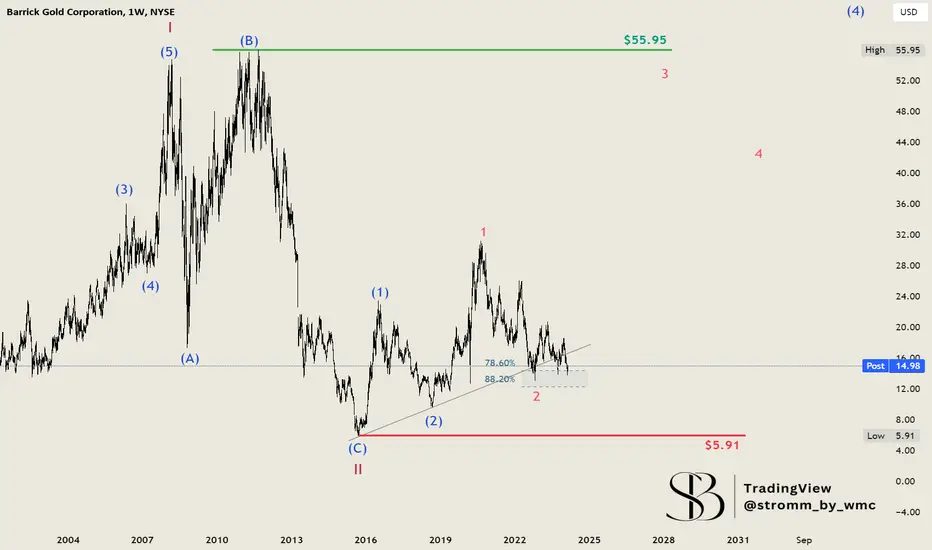
Barrick Gold Corporation to $3On the above 2 month chart price action has enjoyed a 340% rally from the $7 lows of 2016. A number of reasons now exist to take a bearish outlook.
1) Broken market structure printed in 2013. Confirmation of broken structure printed recently in March 2022 (yellow arrow).
2) Trend reversal. Lower high replaces higher high.
3) The rising flag pattern is undoubtably bearish for price action. The breakout printed on March 1st, the confirmation on May 1st. The flagpole extension measures out to 2
Barrick Gold (GOLD): Up 33%—Time to Take Profits?What a rise by Barrick Gold since we bought some shares at the end of February 2024. Patience pays off most of the time, and so it has with Barrick Gold. We are now up over 33% with this stock, and we’re very happy with this last-second entry before the stock took off. Gold continues to rise, and Barrick Gold is following suit. However, after every rise, a setback—whether major or minor—will happen sooner or later, and we’re definitely not getting greedy here.
We’re going to take our first prof
$GOLD is heading to $27; lagging behind #Gold.My thought process; I purchased 10/18 $24calls and I will be selling at $27 (most likely) next week. This is following (lagging) the commodity Gold that is heading towards its 2nd fibonacci target (similar to TVC:GOLD ’s $27 one) indicating TVC:GOLD will follow shortly. The TTM squeeze on the 2 hour is just 1 indicator this is ready to blow. My fibonacci .38 retracement zone method is continuously proven to be one of the best methods I ever learned. See you at 27. As always; have a stop loss
Barrick Gold: 520% possible MoveMany traders believe that investing in a wide variety of assets is the best way to achieve optimal diversification. However, we disagree with this notion. It's the correlations that matter. Holding 20 tech stocks, for example, results in a high correlation among investments, offering little in terms of true diversification. Therefore, we're also looking at a gold mining stock, Barrick Gold Corporation. Although it's a Canadian company, we're analyzing it based on its performance on the New York
Are we finally ready to move higher in GOLD?In a gold bear market, Barrick Gold's stock hasn't done much at all and ultimately has underperformed as investors anticipate lower earnings. However, investors might see this as a buying opportunity if precious metals see liquidity rotation out of the more overpriced and inflated assets.
Barrick Gold Beats Q2 2024 Earnings Expectations Stock up 4.48%Canada's Barrick Gold Corp (NYSE: TVC:GOLD ), one of the world's largest gold miners, has once again proven its resilience and operational strength, delivering impressive Q2 2024 results that surpassed market expectations. In a period marked by economic uncertainty and fluctuating commodity prices, Barrick's strategic focus on efficient production and cost management has positioned it as a standout performer in the mining sector.
Q2 2024 Earnings Beat Expectations
Barrick reported non-GAAP ear
GOLD - A potential setup for a swing tradeRemain vigilant for daily reversal candles occurring near the support area. In the event of a daily closing breach of the support levels (red lines), there is a possibility of further downward movement, emphasizing the importance of implementing risk management strategies.