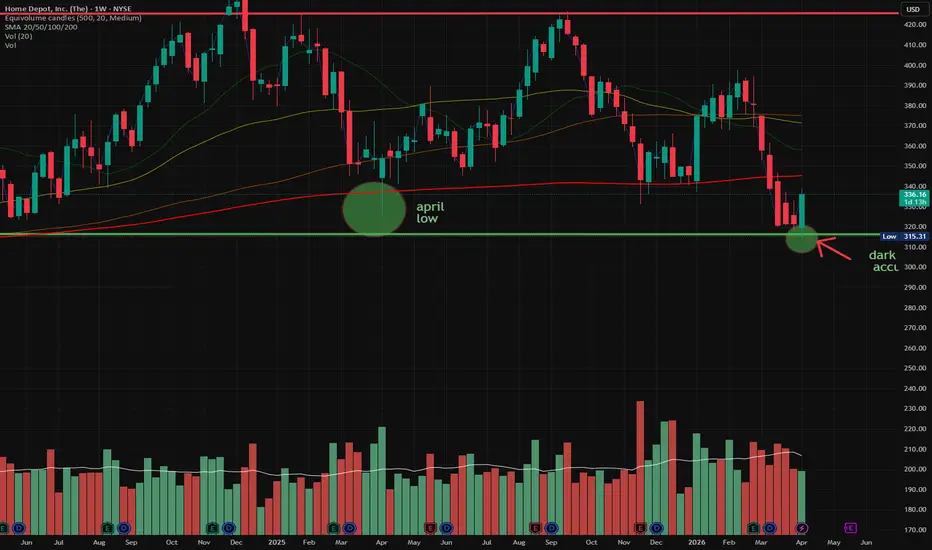
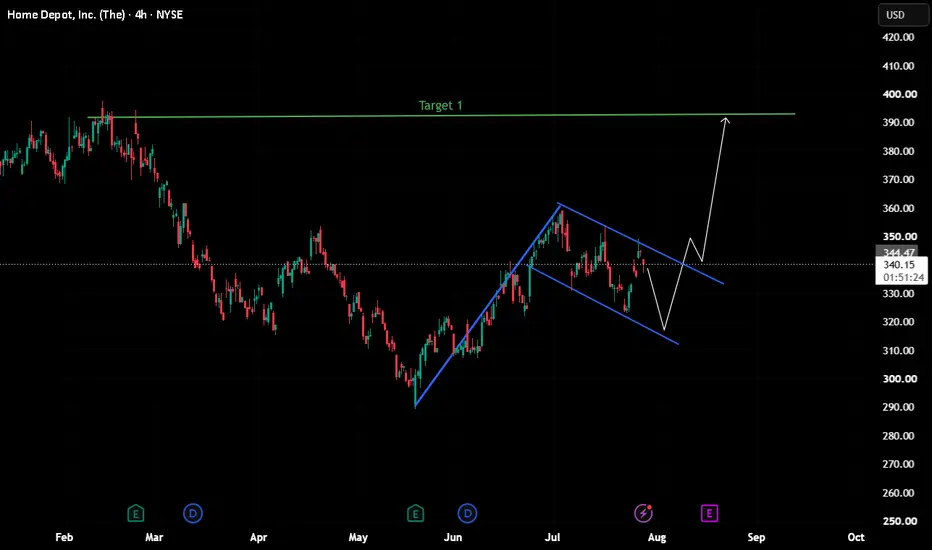
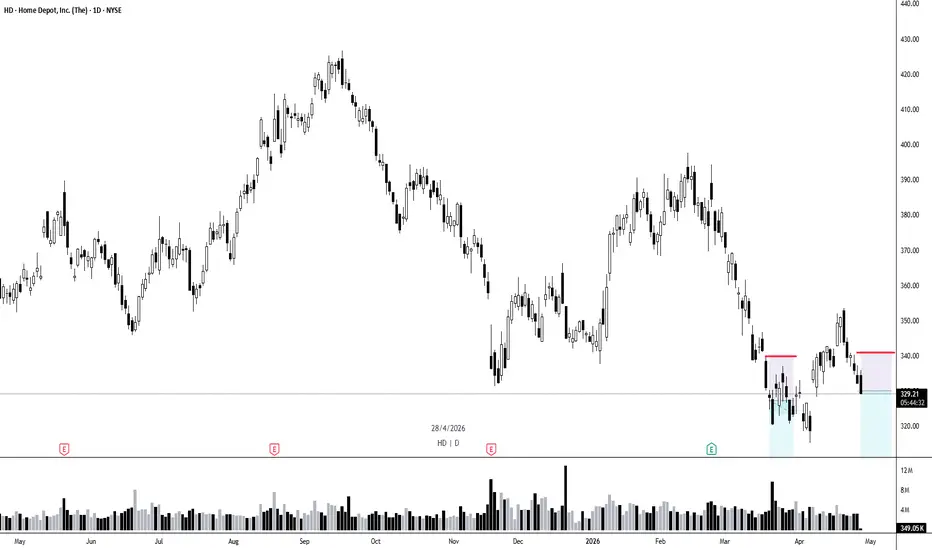
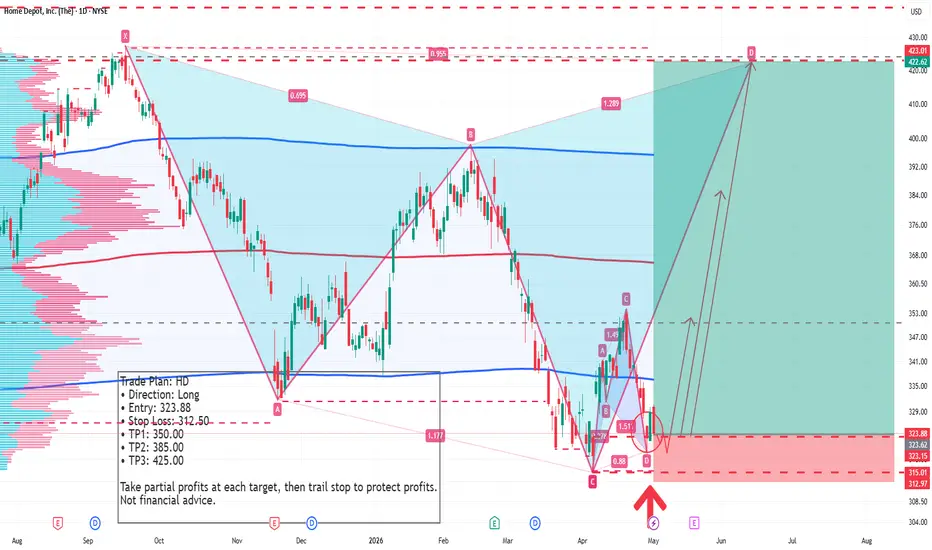
hd is a valuehd is on support also you can see that this is below the April lows.
this is exactly we the dark pools accumulate and buy at a bargain because we are lower than April, so this sock is a bargain right now.
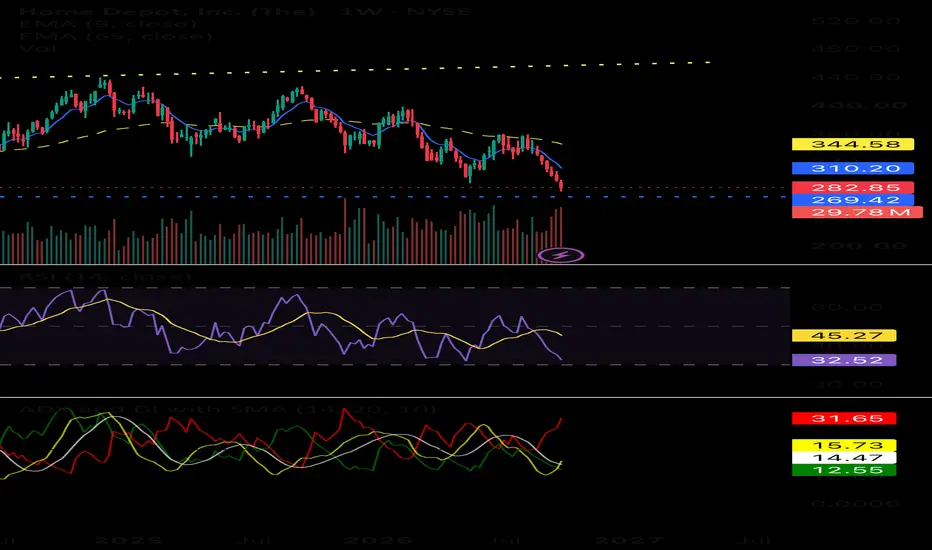
all indicators point bullish especially the rsi has a positive reversal in it on daily
In-depth trading ideas
$HDNYSE:HD HOME DEPOT — MACRO WATCH 🏠📈
As we get closer to the 2026 midterm elections, I’m watching how changes in immigration enforcement, labor availability, and government-assistance policies could start affecting consumer behavior and the housing market.
One trend I’m paying attention to: more homeowners may choose to renovate instead of selling.
When moving becomes expensive because of higher mortgage rates, home prices, and transaction costs, people may decide to stay where they are and p
Home Depot Wave Analysis – 24 September 2026– Home Depot broke key support level 305.00
– Likely to fall to support level 285.00
Home Depot (HD) recently broke through the key support level 305.00 (which previously stopped wave 2 in June) while continuing to fall within the daily down channel from August.
The breakout of the support level 305.00 accelerated the active minor impulse wave 5 that belongs to intermediate impulse wave (3) from August.
Given the strong downward trend, Home Depot stock can be expected to fall further toward t
Split the entry and the stop moves with it
Most people run one clock over everything they own. One method, one holding period, one way of placing a stop, applied to a two-week idea and a two-year idea alike.
That's how you end up right about a company and stopped out of it anyway.
Take the slow version, a position built around a rising long-term average rather than around a weekly trigger. Price finally arrives in the area you'd been waiting for. Three things are now different from a swing entry, and only one of them is obvious.
Fir
Home Depot, Inc. (HD) – Bearish Setup | Target: 331.85 #47Home Depot, Inc. (HD) – Bearish Setup | Target: 331.85 #47
Home Depot (HD) is showing a bearish setup within the current Arc Cycle, with the price structure favoring further downside toward the 331.85 target. The bearish scenario remains valid while the current Arc resistance structure holds.
HD at a Critical Turning Point | Breakout or Breakdown?🏠 Home Depot (HD) | Inside a Major Range: Breakout Setup for the Next Long-Term Move?
👋 Hello TradingView friends!
I hope you're all doing great and that your trading and investing journey is going well. 📊💚
Today, let's take a look at The Home Depot (HD) and analyze its current price structure to see where the next potential major move could come from.
🏢 Fundamental Overview | Why HD?
The Home Depot – Investor Relations
The Home Depot is one of the largest home improvement retailers in the U
$HD | Home Depot is setting up for a legit technical opportunityNYSE:HD might be one of the best setups I’ve stumbled across in a while and the timing is almost perfect. I can't wait to play this trade out!
Price is above the 20D (yellow) and 50D (purple), sitting just under the 200D (green) at $346.48, while RSI is only 52. We are catching key technical indicators as they are confirmed. And at the same time, the chart is compressing into a tight triangle right at resistance.
Then you add the quarter:
$4.92 EPS vs. $4.73 est.
$47.86B revenue vs. $47.24B
HD – Demand Zone Retest & Swing Long SetupInvestment Thesis & Context
Following post-earnings digestion and sector re-evaluations, The Home Depot ( NYSE:HD ) is retesting a high-conviction institutional support level in the $330–$340 region. Backed by resilience in the Professional ("Pro") contractor segment and solid operating cash flow ($16.3B), the stock is presenting a high-probability swing long entry at the lower boundary of its structural channel.
Trade Parameters (Swing / Position Trade)
Entry Zone: $340.00
Stop Loss (SL): $3
$HD slow grower trading at a generous valuation.- NYSE:HD is growing low single digit and growing EPS < 10% per year.
- We already know housing market is frozen.
- Why is NYSE:HD trading at 22-25x multiple?
- Fair multiple would be 15-17x for a mature business going through tough macro in my opinion.
- Fair stock value $224-260
HD - Resistance Retest and H&S Setup💡 Swing setup idea
Resistance retest / breakout setup
🔎 Analysis summary:
The price crossed above the 50 SMA and has now come back to resistance. We can also see a head and shoulders pattern forming, with buyers starting to step in.
👀 Levels to watch:
Entry trigger: Break above $358.20
Target: $417.20
Stop: Under the breakout level
💬 Will the price break through this area? Let me know in the comments! 👇
Good luck!
⚠️ Note: This is for educational purposes only and is not financial
Home Depot: Potential DowntrendHome Depot has struggled for months, and some traders may discern a potential downtrend.
The first pattern on today’s chart is the series of lower highs since last September. Combined with lower lows, those could suggest that sellers are active.
Second, the home-improvement chain’s 50-day simple moving average (SMA) has been under the 200-day SMA since early December. That may reflect a longer-term downtrend.
Third, HD ended Monday below its 21-day exponential moving average. MACD is also fal
Home Depot, Inc. (HD) – Bearish Setup | Target: 332.60 #34Based on my Fibonacci ARC analysis, Home Depot, Inc. (HD) has generated a bearish setup. Price is expected to decline toward 332.60 if the current scenario remains valid.
This analysis is based on the interaction between price and time using Fibonacci ARCs and represents a technical market scenario rather than investment advice.
HD Weekly Long Trading PlanHD Weekly Long Trading Plan
Symbol: HD
Timeframe: Weekly Chart
Trade Direction: Long
Entry: Enter long on lower timeframe pullback near $293.95
Stop-Loss: $269.00
Take Profit & Position Management:
1. First target near $350.00: Reduce half position and adjust stop loss for profit protection.
2. Second target near $408.00: Reduce half of the remaining position and trail stop loss again.
3. Third target near $485.00: Reduce half of the remaining position and keep trailing stop loss.
4. Let
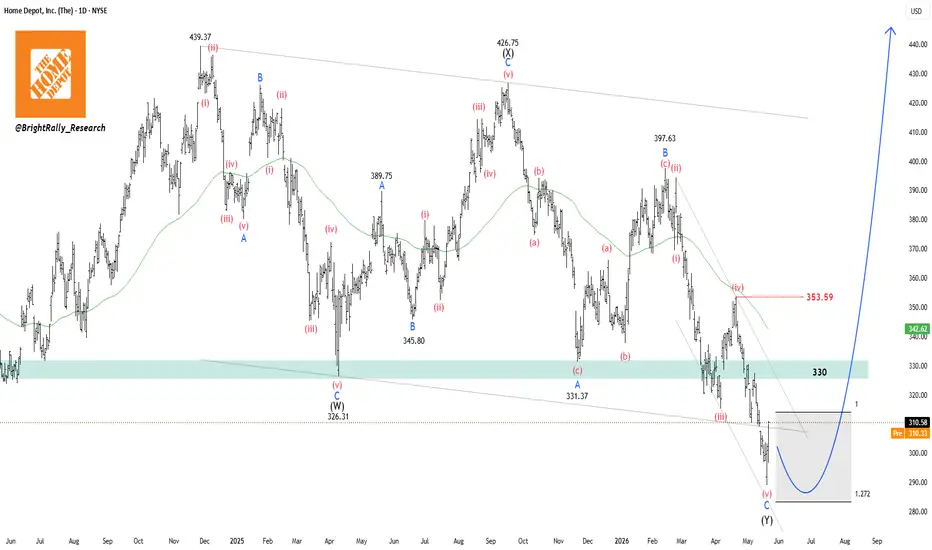
NYSE Home Depot Still Trapped Inside a Corrective ChannelNYSE:HD is still trading under pressure after breaking below the 330 support area. Price continues to make lower highs and lower lows, which keeps the short-term trend weak.
The current decline is now moving into the 300–285 support zone, where the correction could start slowing down. This area may act as the completion region for the ongoing wave structure.
As long as the price stays below 330 , the broader structure remains corrective. A move back above that level would be the first si
HD is about to test its resistancesHD is in a late-stage Accumulation / early Phase B-C structure. The 52-week low of $289 hit intraday on earnings day before recovering to close at $302 — a textbook Spring or Selling Climax (SC) action. The oversold bounce on heavy volume is consistent with Composite Operator absorption: institutions tested supply at $289 and absorbed it. The prior trend was Mark-Down from $427 → $289 (~32% decline), consistent with a completed Distribution that ran from late 2025 into early 2026.
Current Phase
Home Depot reaffirms guidance despite housing headwindsHD | 4H Technical Analysis — May 20, 2026
Home Depot beat Q1 estimates on both revenue and earnings, and reaffirmed its full-year guidance despite rising oil prices, weakening consumer confidence, and a sluggish housing market. However, same-store sales grew only 0.6% YoY, while transactions declined 1.3%, suggesting that inflation-driven price increases are masking underlying volume weakness. CFO McPhail acknowledged that homeowners remain financially resilient relative to other consumer segm
HD - A Compelling Bullish Case Ahead of EarningsWith Home Depot (HD) set to release its quarterly earnings report in just a few hours, the market is buzzing. An analysis of both the technical chart and the company's fundamental health reveals a highly favorable confluence of factors for investors seeking a bullish entry. While near-term growth has normalized, the combination of unmatched profitability, financial stability, and a classic technical reversal pattern points to a powerful setup for a post-earnings rally.
The Technical Canvas: Cl
HD TREND BULLISH Home depot - Bullish
Key points :
Tech View :
Weekly - Uptrend and Strong Support Level
Day - Higher High Makes ( Uptrend )
Wait for Little Bit Correction .
Entry - 398 $
Stoploss - 379 $
Target - 429 $
This is Not a Recommendation . Only for Educational Purpose ..
Thank You .. Happy Trading ..
NYSE – S&P 500 | Home Depot, Inc. | 27 Apr 2026Complex / Range Structure → Rotational Range
Trend: Sideways | Location: Upper Zone | Behaviour: Rotational
Structure assessed from earliest reliable data
Range-bound structure → complex / range structure
Showing rotational behaviour within range
Part of the S&P 500 Structural Census.
For educational purposes. Structural market observation.
Structure → Level → Trigger → Probability
#NF750Census #MarketStructure #HD