In-depth trading ideas
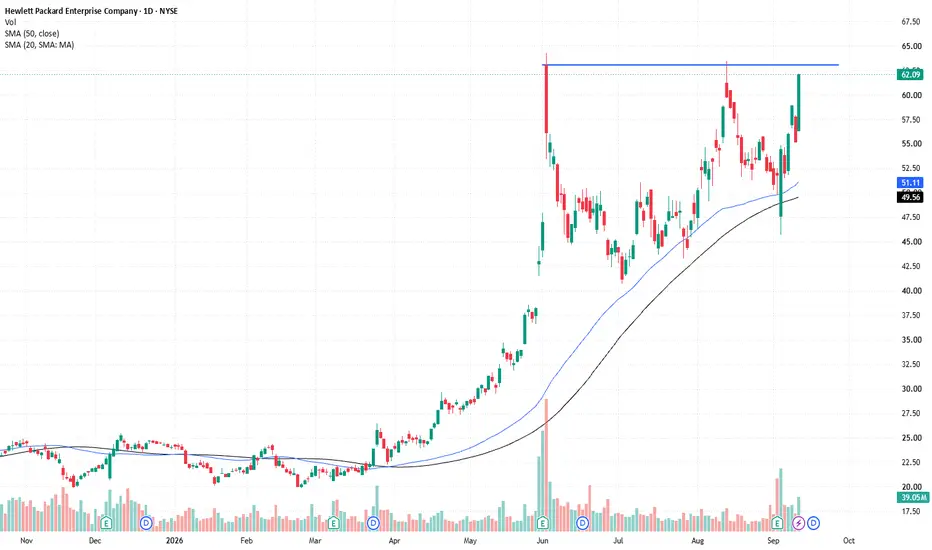
HPE — 4-Month Base at All-Time Highs + Daily VCPThe Setup:
Hewlett Packard Enterprise ( NYSE:HPE ) — enterprise servers, storage, and networking, a core AI/data-center build-out beneficiary. A 15-week base (~4 months) at all-time highs — strength on strength. The daily is coiling into a VCP (Volatility Contraction Pattern), the tightening that typically precedes an explosive move. The sector is leading, with peer NYSE:DELL already broken out.
Tip: Use CBOE:HPEL for 2x leveraged exposure. Note: 2x ETFs reset daily — size accordingly.
Reasoning:
4-Month Base at All-Time Highs (No overhead supply)
Daily VCP (Volatility contraction before a move)
Sector Leadership ( NYSE:DELL already broke out)
Enterprise AI / Data-Center Tailwind
$HPE — 4-Month Base at All-Time Highs + Daily VCPThe Setup:
Hewlett Packard Enterprise ( NYSE:HPE ) — enterprise servers, storage, and networking, a core AI/data-center build-out beneficiary. It's built a 15-week base (~4 months) at all-time highs — strength on strength. The daily is coiling into a VCP (Volatility Contraction Pattern), the kind of tightening that typically precedes an explosive move. The sector is leading, with peer NYSE:DELL already broken out.
Tip: Use CBOE:HPEL for 2x leveraged exposure. Note: 2x ETFs reset daily — size accordingly.
Reasoning:
4-Month Base at All-Time Highs (Strength on strength, no overhead supply)
Daily VCP (Volatility contraction before a move)
Sector Leadership ( NYSE:DELL already broke out)
Enterprise AI / Data-Center Tailwind
HPE – DELL Made Its Move. HPE Is Sitting Under 64 With Catch-Up HPE – Three Tests of 64. DELL Already Ran. Flat Top Breakout Loading.
─────────────────────────────────
HPE – Flat Top Breakout | Swing
DELL is doing the heavy lifting in AI servers right now. HPE is the same sector, same catalyst, and it hasn't broken out yet. 64 is the old high. It's been tested three times. That's the trigger.
─────────────────────────────────
THE SETUP
─────────────────────────────────
Three tests of the same resistance is a flat top. Each time price comes back to 64 and sellers show up, there are fewer of them. That's what a flat top breakout is – supply getting absorbed until there's nothing left overhead.
This is a top setup in the right sector. DELL made its move first. HPE is the laggard with catch-up to do, and laggards in a hot group don't stay laggards for long when the leader is holding its gains.
Watch the whole pack: DELL, SMCI, HPE. Same trade, different stages.
─────────────────────────────────
THE CATALYST
─────────────────────────────────
Sep 2 earnings: EPS $1.11 vs $0.92 expected. Revenue $12.2B, up 34%. Orders up 42%. AI systems orders $2.4B, up over 30% sequentially. Guidance raised for both fiscal 2026 and 2027.
Orders are growing 3.5x faster than revenue – that's a record backlog, and the supply constraint is component availability, not demand.
Stock fell on the print, then ripped to a record $61.62 on Sep 11. That's a post-earnings reversal into a flat top. Next earnings Dec 3.
─────────────────────────────────
TRADE PLAN
─────────────────────────────────
Entry: Break and hold over 64 with volume
Stop: Below the breakout day low – if it falls back under 61 the breakout failed
Pattern: Flat top breakout, three tests of resistance
Timeframe: Swing
Not in yet. Waiting for 64 to go.
─────────────────────────────────
THE RISK
─────────────────────────────────
Stop is defined. If 64 breaks and holds, the setup is clean. If it rejects a fourth time and rolls over, I'm not interested – four tests without a break starts looking like distribution, not accumulation.
Stock is up roughly 130% on the year. Extended names can gap against you. Size like it can move 5% either way on any given day, because it just did.
Hewlett Packard Enterprise Company (HPE) Expands AI ServersHewlett Packard Enterprise Company (HPE) provides servers, storage, networking, and cloud infrastructure that businesses use to run data centers and AI workloads. Its portfolio includes HPE ProLiant servers, Aruba Networking, GreenLake cloud services, and high-performance computing systems. Growth comes from AI server demand, networking expansion, hybrid cloud adoption, and rising investment in data center infrastructure.
On the chart, HPE printed a confirmation bar with increasing volume as price moved above the .236 Fibonacci level and into the momentum zone. A trailing stop can be established using Fibonacci levels on the Fibonacci snap tool, helping manage risk while allowing momentum to continue.
Sell AI and Tech Stocks at ATH Price has surged 200% straight up
Price should not be moving like this and yet most of the TECH sector are seeing moves like this
In my opinion its a good time to exit stocks like this at potential ATH's rather than chasing more when the market has been this generous
Current thoughts
HPE - Uptrend & 17% Upside potential
NYSE:HPE delivered a strong 226% rally before pulling back 37%. Since then, the stock has been trading sideways in a range that has now lasted for three months. What stands out is that buyers have been stepping in at progressively higher levels during these pullbacks, creating a series of higher lows.
On September 3, the stock opened with a gap down, but strong buying quickly followed, potentially forming the next higher low. If the price moves back above the large green candle, there is a strong possibility that it could continue higher and eventually retest its all-time high, representing roughly 17% upside from $84.88.
HPE — Hourly Structure: From Interesting to Potentially TradableThe daily chart told me NYSE:HPE was worth watching.
The hourly chart is where the setup starts getting more useful.
One thing to note: these scenarios extend roughly two weeks. I usually map about one week, but in this case I wanted enough room to show how the larger structure could develop around the major decision areas.
Right now, the chart gives me a fairly clean framework:
~60 — immediate Active AOA / bullish decision area
~55 — important intermediate structural level
~52–53 — Hourly AOA zone
~48–50 — Daily AOA zone
~45 — lower Hourly AOA
My current read is that the bullish scenario is structurally more attractive, but it is not confirmed.
For the bullish case, I would want to see price reclaim and accept above ~60. A brief move above it is not enough. I want evidence that price can hold the area and begin building structure above it.
If that happens, the green scenario becomes much more interesting.
For the bearish case, a rejection at 60 by itself is not enough for me.
Price could reject there, rotate back toward 55, hold, and make another attempt.
The bearish thesis becomes materially stronger if we see:
rejection near 60 → loss of 55 → failed reclaim
At that point, the 52–53 Hourly AOA zone becomes the next major decision area.
If that zone fails as well, then the 48–50 Daily AOA zone becomes increasingly relevant.
That distinction matters because a reaction is not the same thing as a thesis change.
Entry timing
Even though this analysis is built from the hourly chart, I would not use the hourly candle itself to blindly time an entry.
If I were actually trading one of these scenarios, I would move down to the 15-minute, and potentially even the 5-minute, to look for the actual entry structure.
The higher timeframe tells me where I care.
The lower timeframe tells me whether the trade is actually there.
Risk management for a swing
This is also where swing trading requires a different mindset.
A traditional stop-loss can be fairly useless if price gaps through it after hours or overnight.
So if I were holding this as a swing, my primary risk control would begin with position sizing.
I would size the trade so that an adverse overnight or after-hours move does not create a loss larger than I am willing to accept.
That does not mean stops have no value. It means I would not pretend a stop order eliminates gap risk.
For me, the order of operations would be:
Higher timeframe structure → lower timeframe entry → appropriate position size → predefined thesis invalidation.
If I had to rank the scenarios right now:
1. Green / bullish continuation: ~55–60%
Main reason: the larger hourly structure is still constructive, and price is consolidating relatively close to the highs rather than immediately unwinding the entire move.
2. Red / bearish rotation: ~30–35%
Very believable if $60 continues rejecting and $55 eventually fails.
3. Extended sideways chop: ~10–15%
Possible, but like the daily chart, this doesn’t look to me like a particularly natural place for price to spend a long time doing nothing. There are strong decision areas close enough that I’d expect one side eventually to force resolution.
Those aren’t statistical probabilities — just my current weighting of the structures we've mapped.
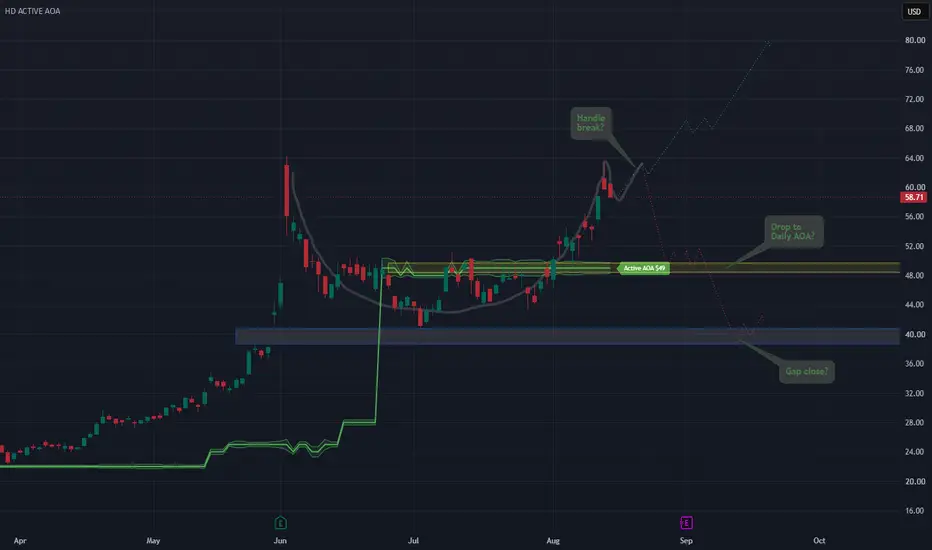
HPE — Daily Structure: First PassNYSE:HPE is sitting in an interesting spot on the daily chart.
Right now, I don’t see sideways chop as the most compelling scenario. Price is sitting near a decision area where I think one of two broader paths could start developing.
Bullish possibility:
The current structure develops into a valid cup-and-handle continuation and price breaks higher.
But I would not call the pattern complete yet. For me, that requires a clear break and acceptance above the handle area, not just a brief move through it.
Bearish possibility:
The handle fails and price rotates back toward the ~48–50 Daily AOA zone.
If that area eventually fails as well, the lower ~39–41 gap zone becomes much more relevant.
What makes this chart interesting is that both directions potentially have room to travel before reaching the next major decision area.
That does not mean I’m choosing a direction yet.
This daily chart is only the first step.
The daily timeframe helps me identify the larger structure, AOAs, gaps, and possible paths. Next, I’ll move down into the smaller timeframes and look at how price is actually behaving inside these areas.
That is where we start asking whether either scenario is becoming tradable for the coming week.
The process is:
Higher timeframe → identify the battlefield.
Lower timeframe → look for evidence of which side is actually winning.
If neither side gives us enough evidence, then there may simply be no trade.
The dotted paths are possibilities, not forecasts.
Preparation > Prediction.
HPE: Symmetrical Triangle Breakout Signals $70Hewlett Packard Enterprise (HPE) shares popped 6% ahead of Monday's opening bell after Morgan Stanley upgraded the storage and server maker's stock, pointing to the company's accelerating Juniper acquisition payoff, strong cash flow fundamentals, and an underappreciated valuation relative to its growth potential.
Taking a close look at HPE's chart, the price recently broke out from a symmetrical triangle, indicating a continuation of the stock's recent strong uptrend.
To project a potential bullish target, we can apply TradingView's bars pattern tool. When applying the analysis, we take the bars following an earlier breakout from a similar continuation pattern (marked in green) and overlay them from the current symmetrical triangle breakout. This forecasts a target of around $70, implying about 32% above Friday's closing price.
HPE: Bullish Triangle Breakout Confirmed, Targets Active!Hello There,
welcome to my new analysis about HPE from a 4-hour timeframe perspective. In recent times, I have spotted interesting setups in the stock market that are likely to turn into profitable trading opportunities in the upcoming times. As I have spotted it, HPE has already completed the underlying formation and now activated further price action to emerge next.
When looking at my chart, we can see how HPE is forming this major bullish triangle formation. Within this formation, HPE already completed the wave count and bounced within the 100-EMA marked in orange, which also matches the support of the lower boundary of the triangle formation. Since then, HPE formed the bullish breakout. This is a strong bullish setup for further upside potential.
Since HPE completed the bullish breakout, this now determines the completion of the triangle formation and the activation of the bullish triangle target zone seen in my chart. The previous earnings already supported this bullish setup and increased the likelihood of a bullish continuation enormously. It will be interesting to see how HPE moves into the target zones because, when it holds the momentum steady, a continuation could be likely.
In this manner, thank you a lot for watching!
The support is highly appreciated.
VP
HPE: 4-6 Week Base & 50-Day SMA BounceThe Setup:
Hewlett Packard Enterprise ( NYSE:HPE ) has formed a highly constructive 4-6 week base , offering a prime swing trade setup. As a leader in enterprise servers, storage, and networking, the stock is currently putting in a clean bounce off the 50-Day SMA . This signals that institutional buyers are defending the short-term trend. We are watching this tight consolidation closely for a high-volume breakout to trigger an entry.
Reasoning:
4-6 Week Base (Short-term accumulation structure)
50-Day SMA Bounce (Institutional defense of the near-term trend)
Sector Tailwinds (Enterprise AI networking and storage demand)
Execution Trigger (Targeting a volume breakout to signal the swing entry)
HPE or hype?Hewlett Packard has been in a tight range since June 8, cooling off after a nearly 200% move from April to the highs on June 2. Some may remember them as a printer/ink company, but their work in cloud computing is why they're here today.
My relative strength dashboard has had cloud ETFs steady leading for several weeks. We've seen such strength in other cloud names like AMZN, MSFT, GOOG, ANET among others.
HPE is reacting today from the cluster of moving averages: 10 day, 21ema, and 50 day. While this is good on its own, the above mentioned names have put in their respective big moves while breaking out from this MA stack. HPE has been on a good run but had not pulled back to the 50-day since the move began in late March, so this looks like a continuation of trend with today's reaction there.
On the daily chart: 1) price is reacting right off of cloud support, which helps bolster the view. 2) The MACD line is crossing over and above the signal line, which is a bullish crossover. Histogram is turning positive as well from negative. Stochastics show plenty of room to run.
On the weekly: Price is trading well above the cloud, a sign of trend. The MACD is very clearly bullish, having moved lower as price cooled off from the large move the week of June 1. Stochastics also indicate room to run.
The box on the chart shows the consolidation, and we're still in it. If price breaks out, this one could run as its peers did. This gives two potential entries: 1) Enter now based on the read, 2) Wait for a breakout. I am already in at 50.05 with about 7% of my account. My goal is always get in early, use a tight stop, and just take the small loss if it happens. I am happy to take these repeatedly because when I'm right, and in early, it makes up for the losses.
Stop could be just below today's low. However I will manage dynamically. If it takes out today's low and recovers I will put my stop below there. If it starts to struggle and stay below today's low, or below the 50-day, I may just cut it.
Not Hewww anymore..after going a bit parabolic take a restAccelerating AI infrastructure business, growing demand for high-performance servers. Networking, and expanding recurring revenue from hybrid cloud services.
Combined with margin improvement and a relatively attractive valuation.
Successful AI execution, could drive earnings growth and a (hopefully) re-pricing...
Hewlett Packard Enterprise: AI Infrastructure Opportunity or CycExecutive Summary:
Margin-of-safety verdict: Trading approximately 24.5% below probability weighted fair value, but only a modest discount for a capital intensive infrastructure business where long term returns on capital remain uncertain.
Hewlett Packard Enterprise sits in an unusual spot in the current market narrative. Many investors now see the company as a direct beneficiary of the AI infrastructure boom. Spending on high performance computing clusters, networking equipment, and hybrid cloud infrastructure is accelerating, and HPE participates in all three markets.
Underneath that story, however, the underlying economics look more familiar. HPE is still, at its core, an enterprise hardware vendor. Historically that type of business produces moderate returns on capital, uneven cash flows, and constant competitive pressure.
For value investors the question is straightforward. Does the AI infrastructure cycle fundamentally improve HPE’s long term economics, or is this simply another spending upswing in enterprise hardware?
The answer determines whether the current valuation represents a genuine opportunity or simply a fair price wrapped in an AI narrative.
One Stock, Dozens of Voices:
This analysis is not based on a single opinion. CrowdWisdom aggregated 49 independent sources for HPE (8 professional trader videos (YouTube); 37 financial research articles (web); 1 live market intelligence feeds; 2 prior CrowdWisdom analysis snapshots (internal archive); 1 verified financial data checks (Yahoo Finance)) and distilled the shared view: where traders, investors, and researchers broadly agree, where they diverge, and what the market may be overlooking.
Those viewpoints were then stress tested against one another through a structured framework: a bull case, a bear case that challenges the prevailing consensus, and an examination of expectations already embedded in the stock price. Financial metrics were cross checked against live market data.
The goal is to identify where opinions converge, where they split, and whether the stock offers a meaningful margin of safety at current prices.
Business Quality and Moat Durability:
Hewlett Packard Enterprise sells enterprise infrastructure across several categories: servers, high performance computing systems, networking hardware, storage platforms, and hybrid cloud services delivered through its GreenLake platform.
Its competitive advantages largely come from three areas.
First are switching costs inside enterprise IT environments. Large organizations deploy infrastructure in multi year cycles. Once thousands of servers, switches, and storage systems are integrated into data centers, replacing that entire ecosystem becomes expensive and disruptive. Operational risk and compatibility concerns typically encourage customers to remain within an existing vendor environment.
Second is technical credibility in high performance computing. HPE technology powers a large share of the world’s leading supercomputers. That track record carries weight when enterprises or research institutions build large scale AI clusters or scientific computing systems.
Third is the company’s push toward consumption based infrastructure through the GreenLake platform. GreenLake allows enterprises to run cloud-like infrastructure within their own data centers while paying based on usage. Compared with traditional hardware sales, that model creates recurring revenue and tighter customer relationships.
The acquisition of Juniper Networks strengthens another potentially durable segment: networking. Networking equipment has historically delivered higher margins and stronger switching costs than server hardware. If HPE successfully integrates Juniper’s technology with its existing installed base, the company could gradually shift its profit mix toward more attractive economics.
Even so, the moat is narrower than what leading software platforms enjoy.
Enterprise infrastructure remains highly competitive. Dell Technologies, Cisco Systems, Arista Networks, Lenovo, and multiple Asian hardware vendors compete aggressively. At the same time hyperscale cloud providers such as Amazon, Microsoft, and Google increasingly design portions of their own hardware internally.
Moat trajectory: STABLE with modest potential improvement if networking and recurring infrastructure services become a larger portion of revenue.
Return on Invested Capital (ROIC):
Direct ROIC metrics are absent in the available forensic dataset, which is itself informative.
Enterprise infrastructure businesses generally generate moderate returns on capital because they require continuous investment in manufacturing capacity, research and development, and inventory. Hardware platforms also face rapid technological obsolescence.
HPE’s current operating margin sits near 7.9%. That level is typical for capital intensive hardware providers rather than high margin technology platforms.
Management’s strategy to improve returns rests on three main levers.
The first is networking. Leading networking vendors have historically produced operating margins above 20%. If Juniper integration succeeds and networking becomes a larger share of revenue, overall returns could improve.
The second lever is the GreenLake consumption model. Delivering infrastructure as a service potentially increases lifetime revenue per customer while improving revenue visibility.
The third lever is large scale AI infrastructure deployments. AI clusters combine servers, networking, storage, and software into integrated systems where vendors may command premium pricing.
These opportunities come with higher capital intensity.
The Juniper acquisition increases invested capital through goodwill and integration costs. AI infrastructure also requires ongoing reinvestment in new server architectures, networking fabrics, and advanced cooling technologies.
If those investments generate returns above the company’s cost of capital, the strategy works. If not, HPE risks running a capital treadmill where heavy spending simply maintains its competitive position.
For now, the trajectory of incremental ROIC remains uncertain.
Quality of Earnings:
The most recently reported earnings quarter produced approximately 9.30 billion dollars in revenue and roughly 4.50 billion dollars in free cash flow.
That quarterly free cash flow figure is unusually high compared with the company’s trailing twelve month free cash flow of approximately 3.22 billion dollars.
The gap largely reflects the cyclical nature of enterprise infrastructure cash generation. Working capital movements, customer financing arrangements, and supply chain timing can create large swings in quarterly free cash flow.
What matters more is the longer term trend. Over the trailing twelve months the business has generated roughly three billion dollars in free cash flow.
Investors should still expect volatility.
As HPE ramps up investment in AI infrastructure and networking capacity, capital expenditures will likely rise. Unless operating margins expand meaningfully, higher capital intensity could compress free cash flow margins.
Capital Allocation Scorecard:
Dividend policy: HPE pays an annual dividend of approximately $0.57 per share, producing a yield near 1%. The payout appears conservative relative to the company’s free cash flow generation.
Share repurchases: Large scale buybacks are not currently a central element of capital allocation.
Mergers and acquisitions: The Juniper Networks acquisition is the most significant strategic move in recent years. If integration goes well, the deal expands HPE’s presence in networking and strengthens its competitive positioning against Cisco.
Acquisitions also introduce execution risk. Integration challenges or cultural mismatches could reduce expected synergies.
Capital expenditures: Investment levels are rising as the company builds capacity to support growing AI infrastructure demand.
Overall capital allocation grade: Neutral to moderately positive. The strategy is logical, but the long term outcome depends heavily on successful Juniper integration.
Customer and Revenue Concentration:
Precise customer concentration data is not available in the forensic dataset.
However, the structure of the enterprise infrastructure market suggests some degree of concentration among large buyers.
Major customers include global telecommunications providers, government entities, financial institutions, and hyperscale cloud operators. These organizations deploy infrastructure at enormous scale.
Hyperscalers represent a particularly important structural risk. While they purchase large volumes of servers and networking equipment, they are also designing proprietary hardware architectures internally.
If hyperscale providers increasingly internalize hardware design, third party vendors such as HPE could see their bargaining power decline.
Management Alignment:
HPE’s ownership structure resembles that of most large technology infrastructure companies. Institutional investors hold the majority of shares, while insider ownership remains relatively limited.
Executive compensation is tied in part to revenue growth and operating margin expansion. Those incentives align management with the company’s strategy of expanding higher margin segments such as networking and infrastructure services.
At the same time, the relatively small insider stake means management’s personal financial exposure is lower than in founder led technology companies.
10-Year Durability Test:
Evaluating HPE over a decade requires looking at several structural forces shaping enterprise computing.
The first is the continued growth of data generation and AI workloads. Artificial intelligence, machine learning, and edge computing require massive computational resources. That trend should drive significant long term demand for computing infrastructure.
The second force is the rise of hybrid cloud architectures. Public cloud platforms dominate many workloads, but regulatory constraints, data sovereignty concerns, and latency requirements ensure that many enterprises continue operating private infrastructure alongside public cloud environments.
That hybrid model benefits vendors capable of delivering integrated infrastructure within customer data centers.
The third force is commoditization. Servers and storage systems have historically faced intense price competition as technological improvements spread across vendors.
Networking equipment tends to offer somewhat stronger economics because switching costs are higher, though competition in that market is also intense.
A fourth uncertainty involves hyperscaler vertical integration. Large cloud providers are increasingly designing custom silicon, networking fabrics, and server architectures tailored to their workloads.
If hyperscalers capture a larger share of infrastructure spending through internal development, third party vendors could lose share in the most profitable segments.
Taken together, these forces suggest HPE will likely remain relevant but may struggle to achieve software-like economics.
Looking ten years ahead is inherently difficult. For conservative investors, that uncertainty may place the company close to the boundary of the “too hard” pile.
Multi-Year Thesis (3 to 7 years):
Bull Case Scenario:
Probability: 35%
Estimated intrinsic value: $75
Assumptions:
AI infrastructure spending remains structurally strong for most of the decade.
Juniper integration succeeds and significantly expands networking margins and enterprise share.
GreenLake and related services grow rapidly, pushing recurring revenue above 30% of total sales.
Operating margins expand toward 13% to 15% as networking and services become a larger portion of revenue.
Base Case Scenario:
Probability: 45%
Estimated intrinsic value: $55
Assumptions:
AI demand supports moderate revenue growth but gradually normalizes after the current investment cycle.
Juniper adds networking growth but synergies remain modest.
GreenLake adoption continues but remains a minority share of revenue.
Operating margins improve slightly but remain below approximately 11%.
Bear Case Scenario:
Probability: 20%
Estimated intrinsic value: $30
Assumptions:
AI infrastructure spending slows sharply after the current build cycle.
Hyperscale cloud providers internalize more hardware design reducing OEM demand.
Gross margins compress toward historical hardware levels near 30%.
Free cash flow declines as capital intensity increases.
Margin of Safety Verdict:
COMPUTED VALUATION (provided framework):
weighted_intrinsic_value: $57.0
current_price: $43.04
discount_to_weighted_iv: 24.5%
mos_bucket: modest_discount
Trading ~24.5% below probability-weighted fair value ($57.00), but below the 20-30% margin-of-safety threshold required for strict deep-value entry.
In practical terms, the stock looks somewhat undervalued but not deeply discounted relative to intrinsic value estimates.
Peak Margin Stress Test:
HPE’s current gross margin sits around the mid 30% range.
Historically, enterprise hardware vendors tend to operate closer to 30% to 32% gross margins once competitive pressure intensifies and component costs normalize.
If HPE’s gross margin fell by roughly 300 to 500 basis points toward that historical range, operating margins could compress meaningfully given the company’s already thin profitability.
Under that scenario free cash flow could decline materially from the current trailing level of approximately 3.2 billion dollars.
Applying lower hardware sector multiples in that environment could imply potential downside of roughly 30% to 40% from current valuation levels.
Valuation Framing:
Several valuation approaches provide context for HPE’s current pricing.
Relative valuation places the company at roughly 15.9 times EV to EBITDA and approximately 13.9 times forward earnings. Those multiples suggest the market expects moderate growth along with some improvement in margins.
Discounted cash flow models built on conservative assumptions often generate intrinsic values in the $20 to $30 range, reflecting the historically modest profitability of hardware businesses.
Scenario based valuation produces a probability weighted estimate near $57 per share. That framework assumes reasonable execution in networking and hybrid cloud services but does not rely on extraordinary growth.
Meaningful upside therefore requires sustained AI infrastructure demand, successful Juniper integration, and measurable margin expansion.
Perception vs Reality:
Perception:
HPE is evolving into a major AI infrastructure platform capable of delivering higher margins and strong growth.
Reality:
Most of the company’s revenue still comes from highly competitive hardware markets where pricing power is limited and capital intensity remains significant.
Why This May Be Misunderstood:
The surge of interest in AI data centers has lifted valuations across many infrastructure providers.
Investors sometimes assume that companies supplying AI hardware will achieve software-like margins and prolonged high growth.
Historically, infrastructure vendors capture only a portion of the economic value created by major technology cycles.
Three Measurable Things to Watch Next Quarter:
1. Networking segment revenue growth and operating margin following Juniper integration.
2. Expansion of GreenLake annualized recurring revenue run rate.
3. Free cash flow stability relative to rising capital expenditures.
Historical Conviction Drift:
Earlier analyses frequently treated HPE as a classic value stock - low earnings multiples with modest growth prospects.
Over the past two years that narrative shifted as AI infrastructure demand accelerated and the Juniper acquisition repositioned the company in the networking market.
Investor perception moved from “legacy hardware vendor” to “AI infrastructure beneficiary.”
Whether that perception proves durable is the central issue for long term investors.
Disconfirming Evidence:
The strongest argument against owning HPE comes from industry history.
Enterprise hardware vendors rarely sustain high returns on capital. Competition, rapid technological change, and heavy capital requirements tend to compress margins over time.
If AI infrastructure demand turns out to be cyclical rather than structural, HPE’s earnings power could revert to historically modest levels.
In that scenario the current valuation may already reflect peak profitability.
Risks:
Hyperscaler vertical integration reducing demand for OEM infrastructure vendors.
Integration challenges associated with the Juniper Networks acquisition.
Hardware commoditization compressing gross margins.
Rising capital intensity required to compete in AI infrastructure markets.
Cyclical enterprise IT spending downturns during economic slowdowns.
Summary:
Hewlett Packard Enterprise sits at the intersection of two competing narratives. On one side, the company participates directly in the global expansion of AI infrastructure and hybrid cloud computing.
On the other, it remains an enterprise hardware vendor operating in intensely competitive markets that have historically produced only moderate returns on capital.
The company’s shift toward networking and consumption based infrastructure could gradually improve its economics, but that transition is still in progress.
At current prices the stock trades somewhat below estimated intrinsic value, though not at a deep discount. The margin of safety therefore remains modest.
For disciplined value investors, HPE is an interesting situation but not an overwhelmingly compelling one. The business may improve structurally, yet the long term economics of enterprise infrastructure remain uncertain.
Data Snapshot:
Metric: Current Price
Metric: Value
Current Price (HPE): $56.15
Market Capitalization: $74.35 billion
Shares Outstanding: 1,324,203,521
Trailing P/E: 52.48x
Forward P/E: 13.88x
Enterprise Value (EV): $90.30 billion
EV/EBITDA: 15.94x
Revenue (TTM): $38.79 billion
Gross Margin: 33.89%
Operating Margin: 7.86%
Free Cash Flow (FCF): $3.22 billion
FCF Yield: 4.33%
52-Week Range: $17.49 to $64.25
Sector: Technology
Industry: Communication Equipment
Data Freshness: post-earnings Yahoo lag
Reported Earnings Quarter Revenue (event): $9.30 billion
Yahoo Statements Quarter Revenue (prior, stale) (2026-01-31): $9.30 billion
Reported Earnings Quarter FCF (event): $4.50 billion
FCF TTM (may lag): $3.22 billion
Yahoo Statements Quarter Gross Margin: 35.91%
Latest Reported EPS: 0.79 (surprise 48.03%)
Next Quarter Revenue Guide (Yahoo calendar): $10.09 billion to $11.52 billion (avg $10.88 billion)
Analyst Consensus +1q Revenue (NOT company guide): $10.90 billion
TTM Staleness Flag: TTM revenue/margins/FCF may lag 24-72h after earnings
References:
This analysis reviewed approximately 1319 article sources and 13 video transcripts.
1. Yahoo Finance. Hewlett Packard Enterprise (HPE) Beats Q2 Earnings and Revenue Estimates. finance.yahoo.com
2. Yahoo Finance. Assessing Hewlett Packard Enterprise (HPE) Valuation After Recent Share Price Strength. finance.yahoo.com
3. Yahoo Finance. Assessing Hewlett Packard Enterprise (HPE) Valuation After Recent Share Price Moves And Juniper Synergy Expectations. finance.yahoo.com (truncated intentionally preserved source context)
4. Yahoo Finance. Assessing Hewlett Packard Enterprise (NYSE:HPE) Valuation After Recent Share Price Pullback. finance.yahoo.com
5. GuruFocus. Hewlett Packard Enterprise GF Value Estimate. www.gurufocus.com
6. Simply Wall St. Calculating the Fair Value of Hewlett Packard Enterprise. simplywall.st
7. StockStory. Hewlett Packard Enterprise Company Stock Analysis. stockstory.org
8. MatrixBCG. Competitive Landscape of Hewlett Packard Enterprise. matrixbcg.com
9. Porter’s Five Forces. Competitive Landscape of HPE. portersfiveforce.com
10. MacroTrends. Hewlett Packard Enterprise PE Ratio History. www.macrotrends.net
11. AlphaSpread. HPE Price to Book Valuation Scenarios. www.alphaspread.com
12. HPE Investor Relations. Corporate Strategy and Financial Outlook. investors.hpe.com
13. SmartStockWatch YouTube Channel. HPE 2026 Q2 Earnings Analysis. www.youtube.com
Disclaimer:
This report is for informational and educational purposes only and does not constitute investment advice. Investors should conduct their own research and consult a qualified financial advisor before making investment decisions.
HPE, WHICH WAY IS UP (for our P&L)HPE had a huge opening gap up yesterday after more than positive results, then traded down to part fill a large portion of the gap, it was obviously too tempting for some holders.
Interestingly it went below the .50 FIB briefly before a morning star formed (on a 15 min candle) and it managed to recover the .50 FIB. Pre market today its indicating a tad lower at the time of writing.
I'll be watching a reclaim of the .50 FIB to LONG or not, in which case a potential break below the morning star (and new support area it created) for a SHORT once the price action dictates what is happening.
Either way, there's a potential set up.
There has been a flurry of target price increases today from brokers as an FYI.
As always do your own homework.
Happy hunting
Long term ideaThe price is consolidating within the triangle shown on the chart since July 2025. It is also pushing the 22 resistance level and looks that it is about the break it out. Then probably is going to sit on the 22 level now support and the consolidate before breaking up the triangle. I bought calls for Jan 15 2027 strike 22. SL triggers if the demand zone is broken by a weekly candle.
Downside Patterns in Hewlett Packard Enterprise?Hewlett Packard Enterprise has gone nowhere for months, and some traders may see downside risk in the maker of AI servers.
The first pattern on today’s chart is the drop between February 11 and 24. HPE has remained under a 50 percent retracement of that move, which could confirm bearish direction.
Second, prices have also stayed under the 50- and 200-day simple moving averages (SMAs).
Third, the 50-day SMA just had a “death cross” below the 200-day SMA.
Next, stochastics are turning down from an overbought condition.
Finally, the bounce in the last 3-4 weeks could be viewed as a potential bearish flag.
TradeStation has, for decades, advanced the trading industry, providing access to stocks, options and futures. If you're born to trade, we could be for you. Learn more here about TradingView’s Broker of the Year!
Past performance, whether actual or indicated by historical tests of strategies, is no guarantee of future performance or success. There is a possibility that you may sustain a loss equal to or greater than your entire investment regardless of which asset class you trade (equities, options or futures); therefore, you should not invest or risk money that you cannot afford to lose. Online trading is not suitable for all investors. View the document titled Characteristics and Risks of Standardized Options at www.TradeStation.com . Before trading any asset class, customers must read the relevant risk disclosure statements on www.TradeStation.com . System access and trade placement and execution may be delayed or fail due to market volatility and volume, quote delays, system and software errors, Internet traffic, outages and other factors.
Securities and futures trading is offered to self-directed customers by TradeStation Securities, Inc., a broker-dealer registered with the Securities and Exchange Commission and a futures commission merchant licensed with the Commodity Futures Trading Commission). TradeStation Securities is a member of the Financial Industry Regulatory Authority, the National Futures Association, and a number of exchanges.
TradeStation Securities, Inc. and TradeStation Technologies, Inc. are each wholly owned subsidiaries of TradeStation Group, Inc., both operating, and providing products and services, under the TradeStation brand and trademark. When applying for, or purchasing, accounts, subscriptions, products and services, it is important that you know which company you will be dealing with. Visit www.TradeStation.com for further important information explaining what this means.
HPE Moderate Bear Breakdown With Active Squeeze FiringHPE 28/02/2026
💰 21.43
🟢 Moderate BEAR 26.53% at 1.72x
🟢(36.7%):🔴(63.3%) ⏳Clarity:40%
Retrace:-1.5% Bounce:0.1% 0.1x 🔴 Breakdown
Bears are in control here but this is not a clean short. The multi-timeframe count leans bearish at 17 green versus 28 red across 112 signals. Higher timeframe trend confirms the downside at 6 green to 8 red. EMA structure has flipped bearish at 1 green to 2 red meaning the trend backbone is starting to crack. Ichi TK adds weight at 5 green to 8 red and candles are firmly bearish at 5 green versus 9 red.
The breakdown classification at 0.1x with just 0.1% bounce probability is telling you buyers have essentially given up. Retrace at -1.5% is modest but with no bounce developing this is a slow grind lower not a capitulation flush. Spread sits at 24.4% moderate so there is room for further downside before things get stretched. Price is at the 84.5th percentile in the upper portion of the range between 19.985 and 21.695 which means even after selling off price has not reached cheap levels yet.
The standout feature here is the squeeze. A high intensity squeeze has been building for 11 bars with momentum pointing bearish and bandwidth compressing at 1.34%. When a squeeze fires during a breakdown it typically accelerates the move in the direction of the existing trend. If this resolves to the downside the next leg could be sharp. This is the main reason to keep watching this chart even though clarity is low at 40%.
Volume is weak across the board. Vol Z at -0.75 is quiet with just 100 volume and 2.14K dollar volume. Momentum is deeply negative at -6.77 decelerating which means volume was already falling and the deceleration is intensifying. Bull Bear Z readings are both negative at -0.45 and -0.46 showing no participation from either side. No whale activity detected and no volume squeeze forming.
The one faint positive for bulls is OBV Z at 0.13 with inflow direction. Accumulation is barely positive and starting to turn up which could suggest some bottom fishing happening at these levels. But with a reading that close to zero it is noise until it strengthens significantly.
No futures data available so this is a clean spot read.
The setup is bearish but the low clarity at 40% and quiet volume make this a watch not a chase. The 11 bar squeeze is the catalyst to monitor. If it fires bearish with volume participation the 19.98 to 20.50 zone becomes the target. If the squeeze somehow resolves bullish against the trend that would be a failed breakdown and could trap shorts. Let the squeeze decide before committing capital.
More analysis on my profile.
🎯 Target: 1K Followers
👉 Follow: stingrayea
Hewlett Packard Enterprise Expands AI With NVIDIA-Powered LabHewlett Packard Enterprise (NYSE: HPE) has strengthened its position in the global AI infrastructure race with a major announcement: the launch of an AI Factory Lab in Grenoble, France, built in partnership with NVIDIA. The facility is designed to let enterprises test sovereign AI systems inside the European Union—an increasingly important requirement as governments tighten rules around data security, residency, and compliance.
The lab will run on a full stack of NVIDIA AI Enterprise software, HPE servers, NVIDIA accelerated computing, and Spectrum-X Ethernet networking. With demand for sovereign AI rising across Europe, the new lab gives enterprises a secure environment to validate workloads before deployment. The site is slated to open in Q2 2026, positioning HPE as a leader in regulatory-aligned AI infrastructure.
HPE’s news extended beyond the lab launch. The company upgraded its Private Cloud AI platform, adding support for NVIDIA RTX PRO 6000 Blackwell Server Edition GPUs and integrating STIG-hardened and FIPS-enabled configurations for air-gapped environments. Fractional GPU support through NVIDIA Multi-Instance GPU (MIG) technology brings cost-efficient scaling to private AI clusters.
Another key reveal was the HPE Alletra Storage MP X10000 Data Intelligence Nodes, powered by NVIDIA acceleration to analyze and process data inline. These nodes will be available for order in January 2026. HPE also rolled out the NVIDIA GB200 NVL4 system, offering up to 136 GPUs per rack and now available to order.
New partnerships with CrowdStrike, Fortanix, and Carbon3.ai add security and confidential computing layers, with HPE supporting a new Private AI Lab in London. The company emphasized that sovereign AI solutions are available today with country-specific compliance frameworks.
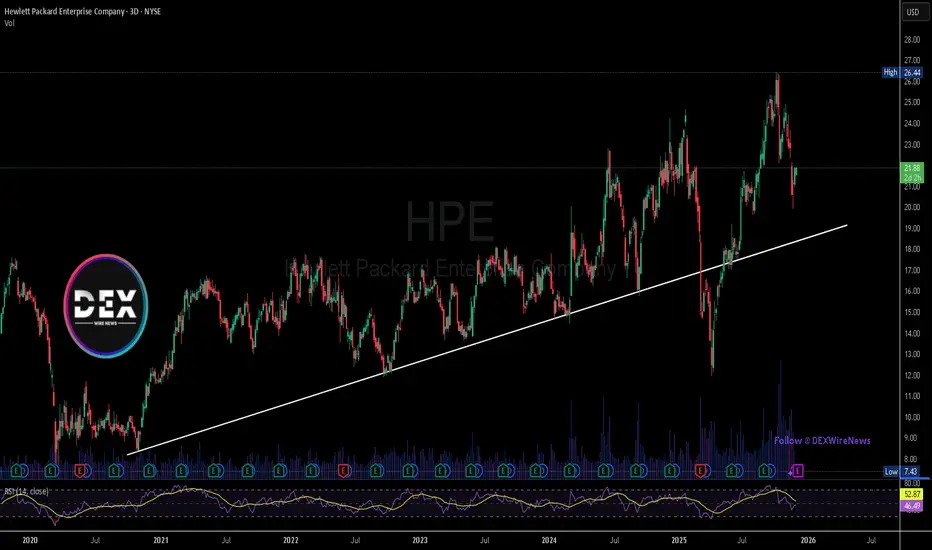
Technical View
HPE remains in a bullish structure despite retracing from its recent $26 high. Price is pulling back toward $18, a likely support area. Holding above this zone keeps the broader uptrend intact.
HPE eyes on $22: Major Resistance zone holding up new ATHHPE has been surging after earnings and good news.
Now testing a proven resistance zone $21.87-22.05
Look for a Dip-to-Fib or Break-n-Retest for long entry.
.
Previous Analysis that caught a PERFECT BREAKOUT
Hit BOOST and FOLLOW for more such PRECISE and TIMELY charts.
========================================================
.
HPE Has Nearly Double Since April. Here's What Its Chart SaysHewlett Packard Enterprise NYSE:HPE will release fiscal Q3 results next week at a time when its stock has nearly doubled since hitting a 52-week low in April. Let's check out the tech giant's technical and fundamental analysis.
HPE's Fundamental Analysis
Hewlett Packard Enterprise plans to unveil its latest results on Wednesday after the closing bell in what could be a key quarter for the firm.
Analysts expect HPE to report that earnings to have contracted year over year for the second straight three-month period. They also believe management will say that sales growth has decelerated sharply from the pace the firm enjoyed during calendar-year 2024.
The analyst community projects that HPE will report $0.41 in adjusted earnings per share on about $8.8 billion of revenue.
That would compare poorly to the $0.50 in adjusted EPS that the company recorded for the same period one year ago, but would reflect relatively healthy 13.7% y/y sales growth from Q3 fiscal 2024's $7.7 billion.
Of the seven sell-side analysts who cover Hewlett Packard Enterprise, three have increased their earnings estimates since the quarter began, while three have revised their forecasts lower. (One estimate remains unchanged.)
That said, two highly rated analysts recently reiterated their positive opinions of the stock.
Tim Long of Barclays confirmed his "Buy" rating and $26 price target (vs. the $23.16 that HPE closed at Thursday). Similarly, Amit Daryanani confirmed his "Buy" rating and $28 target for the stock.
TipRanks rates both Long and Daryanani at five stars (the highest possible grade).
It's also worth noting that Elliott Management, the hedge fund run by billionaire activist Paul Singer, revealed in mid-August via a 13F filing that it bought an 18.6-million-share stake in HPE during the second quarter.
HPE's Technical Analysis
Now let's look at HPE's chart going back some six months and running through Wednesday afternoon:
Readers will see that beginning in April, HPE developed what's called a "rising-wedge" pattern of bearish reversal while gaining ground from a roughly $12 low to about $23 today.
So far, the stock has managed to find support at its 21-day Exponential Moving Average (or "EMA," marked with a green line above) and its 50-day Simple Moving Average (or "SMA," denoted with a blue line. HPE also recaptured its 200-day SMA (marked with a red line) in early July.
Meanwhile, HPE's Relative Strength Index (the gray line at the chart's top) is just starting to scrape up against technically overbought territory.
That said, the stock's daily Moving Average Convergence Divergence indicator (or "MACD," marked with black and gold lines and blue bars at the chart's bottom) is very bullish technically speaking.
Not only is the histogram of the 9-day EMA (the blue bars) in positive territory, but the 12-day EMA (the black line) has overtaken the 26-day EMA (the gold line). These are all bullish indicators despite HPE's generally bearish-looking pattern.
A Hewlett Packard Enterprise bull would look at the rising-wedge pattern's upper trendline as a pivot. The stock is roughly there right now.
However, if HPE hits resistance at that upper trendline (which wouldn't be unusual for this kind of pattern), there are key downside pivots at both the stock's 50- and 200-day trendlines.
(Moomoo Technologies Inc. Markets Commentator Stephen “Sarge” Guilfoyle had no position in HPE at the time of writing this column.)
This article discusses technical analysis, other approaches, including fundamental analysis, may offer very different views. The examples provided are for illustrative purposes only and are not intended to be reflective of the results you can expect to achieve. Specific security charts used are for illustrative purposes only and are not a recommendation, offer to sell, or a solicitation of an offer to buy any security. Past investment performance does not indicate or guarantee future success. Returns will vary, and all investments carry risks, including loss of principal. This content is also not a research report and is not intended to serve as the basis for any investment decision. The information contained in this article does not purport to be a complete description of the securities, markets, or developments referred to in this material. Moomoo and its affiliates make no representation or warranty as to the article's adequacy, completeness, accuracy or timeliness for any particular purpose of the above content. Furthermore, there is no guarantee that any statements, estimates, price targets, opinions or forecasts provided herein will prove to be correct.
The Analyst Ratings feature comes from TipRanks, an independent third party. The accuracy, completeness, or reliability cannot be guaranteed and should not be relied upon as a primary basis for any investment decision. The target prices are intended for informational purposes only, not recommendations, and are also not guarantees of future results.
Moomoo is a financial information and trading app offered by Moomoo Technologies Inc. In the U.S., investment products and services on Moomoo are offered by Moomoo Financial Inc., Member FINRA/SIPC.
TradingView is an independent third party not affiliated with Moomoo Financial Inc., Moomoo Technologies Inc., or its affiliates. Moomoo Financial Inc. and its affiliates do not endorse, represent or warrant the completeness and accuracy of the data and information available on the TradingView platform and are not responsible for any services provided by the third-party platform.