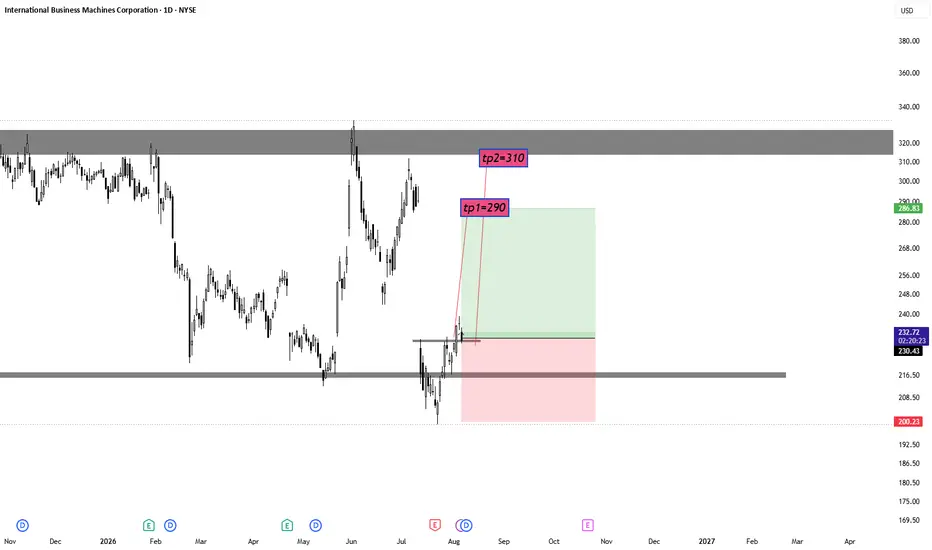
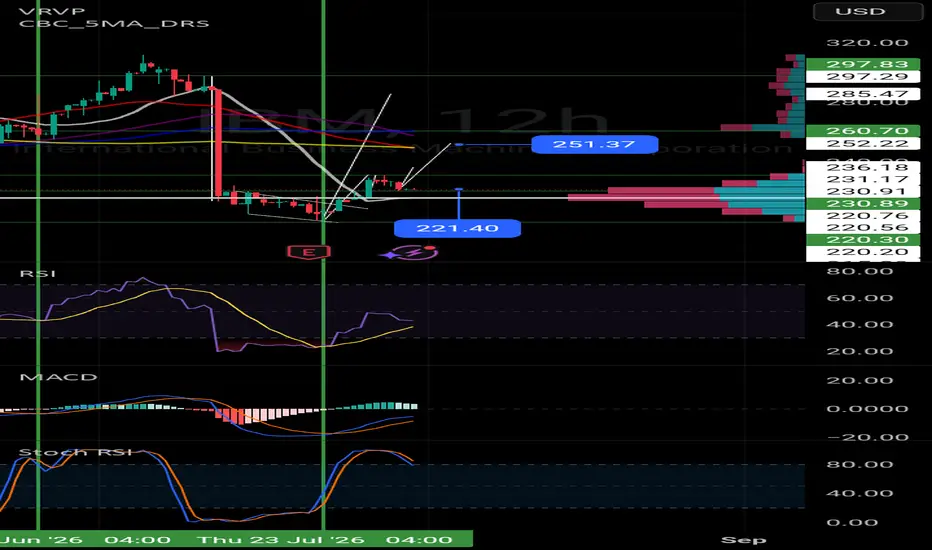
IBM #2: The July 2026 Low Still StandsIn the first idea the level I watched was the 224 area, where the channel lower band ran close to the 0.5 line. Holding that zone kept the July 2026 low as the low of this trend.
Since then IBM rallied to the 0.382 line, around 250, and turned there, with Pearson’s R still at 0.91. On the way back down it fell below the channel lower band. The channel lower band keeps rising while the Fibonacci lines stay flat, so the two tools that met in the 224 area have moved apart, and IBM now sits just ab
In-depth trading ideas
IBM: The Golden Ratio Level Was Tested in JulyI anchored both tools at the late November 2021 low. That anchor is not a technical choice. IBM completed the Kyndryl spin off on 3 November 2021, so the IBM before that date and the IBM after it are not the same company. A channel drawn from earlier than that mixes two different businesses into one line.
From that anchor I drew a regression channel and a Fibonacci retracement to the June 2026 high. The number at the bottom left is Pearson's R, 0.91.
In July 2026 IBM fell to 199.19 after the c
IBM | Continued stock growth- Timeframe: Weekly
- Trade type: Buy stop order
- Price: 240.81
- Take Profit: Open
- Stop Loss: 228.96 (-4.90 %)
Idea: Long on a breakout above last week's high - bullish momentum continuation.
Entry: Buy stop above last week’s high.
Stop-loss: Below the low of the same candle.
If the weekly candle closes below this level, the trade is invalidated.
Could IBM Quietly Dominate the Global AI Economy?Macroeconomics and Evolving Business Models
Global macroeconomics create severe headwinds for traditional growth models. Standard tech companies face extreme market volatility. IBM deliberately sidesteps this chaos. The company relies on a high-margin software and consulting business model. The economics of this strategy reward immense stability. Investors desperately seek dependable dividend yields during turbulent times. IBM delivers consistent returns while shedding legacy operations. This s
IBM | Continued stock growth- Timeframe: Weekly
- Trade type: Buy stop order
- Price: 216.28
- Take Profit: Open
- Stop Loss: 199.19 (-7.90 %)
Idea: Long on a breakout above last week's high - bullish momentum continuation.
Entry: Buy stop above last week’s high.
Stop-loss: Below the low of the same candle.
If the weekly candle closes below this level, the trade is invalidated.
Take Profit: Trailing stop following the lows of new weekly candles.
IBM Limps After Big DropInternational Business Machines fell hard last month, and some traders may see further downside risk.
The first pattern on today’s chart is the bearish price gap on July 14 after management preannounced weak results. IBM is stalling under a 50 percent retracement of that drop, which could suggest its direction is pointing lower.
Second, prices have stayed below the June 18 low of $243.68.
Third, the 50-day simple moving average (SMA) had a “death cross” under the 200-day SMA in March and has
IBM — Bullish Momentum Building | Upside Target 272IBM is maintaining a bullish outlook, with the current market structure suggesting that buyers remain in control and the stock has room for further upside toward the 272 target. Price action continues to support the buying bias as bullish momentum strengthens and sellers struggle to establish sustained downside pressure.
From a fundamental perspective, IBM continues to benefit from its strong position across enterprise technology, hybrid cloud, AI and software solutions. Growing demand for AI-r
Why Is IBM Betting Its Future on 120 Qubits?IBM posted $17.2 billion in second-quarter 2026 revenue, a gain of just 1 percent year over year. The headline number understates the transformation underneath it. Management routes hybrid cloud profits into capital-intensive research. Two acquisitions frame the strategy. IBM paid $6.4 billion for HashiCorp to lead multi-cloud automation. It added Confluent to accelerate real-time enterprise AI. Corporate buyers now reallocate budgets toward proprietary software, custom AI, and cloud automation.
IBM International Business Machines Options Ahead of EarningsIf you haven`t bought IBM before the rally:
Now analyzing the options chain and the chart patterns of IBM International Business Machines prior to the earnings report this week,
I would consider purchasing the 210usd strike price Calls with
an expiration date of 2026-8-21,
for a premium of approximately $9.60.
If these options prove to be profitable prior to the earnings release, I would sell at least half of them.
The Myth of "Gaps Must Fill" Using $IBM $MSFT $AAPLOne of the most persistent dogmas in technical analysis is the belief that every gap eventually gets filled.
While common or exhaustion gaps often close quickly, Breakaway Gaps born from major structural or fundamental shifts regularly remain open forever or for decades, which makes the "gap fill" theory practically useless.
Look at FTMO_OANDA:IBM on the weekly timeframe:
Multiple breakaway gaps from early market cycles (including zones near $38 and $55) remain completely untouched.
For IBM
The Trillion Dollar Tech Meltdown | Why Everyone Is Dumping IBM IBM is dealing with a major shift in enterprise technology spending, highlighted by a roughly 25% one day drop in its stock after the company issued a weaker than expected preliminary second quarter earnings update.
IBM expects Q2 revenue of about $17.2 billion and adjusted earnings per share of $2.93, below Wall Street expectations of $17.86 billion in revenue and $3.02 EPS
The slowdown appears to be tied to a change in how large companies are allocating their technology budgets. Many ente
IBM's revenue miss exposes AI-driven software spending shiftIBM | 1D Technical Analysis — Jul 17, 2026
IBM issued a Q2 pre-announcement warning, with preliminary revenue of $17.2B coming in 1% above last year but missing the $17.9B consensus. CEO Krishna explained that customers redirected quarterly capex toward servers, storage, and memory to secure constrained AI infrastructure, directly crowding out mainframe purchases. Krishna also cited Anthropic's Claude Mythos launch as a factor, noting it briefly paused enterprise contract signings as customers
$IBM — Long-term support retestThe current price action of NYSE:IBM is unfolding as expected, with long-term support providing a lift upwards. The next resistance level is anticipated to be just a few percent higher. A key factor to watch will be how the stock performs once it enters the gap area, potentially acting as a magnet drawing prices upwards. This movement, in conjunction with short-term averages, could result in a strong upward trajectory. The reasoning behind this analysis is based on the premise that long-term s
IBM Short — IBM's short thesis gets fundamental backing as a salIBM’s bearish momentum setup is supported by a meaningful fundamental catalyst: a sales miss and concerns around enterprise spending/AI capex durability. The move is very extended after a record-style drop, so bounce risk is real, but the news confirms the short thesis enough to take it with reduced size.
📍 Entry: 206.08
🛑 Stop: 219.45
🎯 Target: 178.22
⚖️ R:R: 2.08
IBM Short — IBM's bearish structure and momentum breakdown colliBearish 4h alignment with extreme 4.8xATR extension and failed momentum trigger supports aggressive continuation lower; the record single-day collapse on fundamental AI-spending fears adds powerful confirmation to the short side.
📍 Entry: 206.08
🛑 Stop: 219.45
🎯 Target: 178.22
⚖️ R:R: 2.08
IBM: Wall Street Says the Floor Isn't Here YetA quarter of IBM's value gone in a single session. A second day of bleeding on top of it. A securities-law shop already circling with a shareholder investigation notice before the dust has even settled. And now Morgan Stanley telling clients, in writing, not to assume the worst is over. This is what a stock looks like when nobody's caught the falling knife yet.
Two days, -27%, and Wall Street's own analysts aren't calling a bottom
IBM closed Monday at 290.23. Tuesday's preliminary Q2 warning
IBM (D) — the 25% crash lands on major supportNYSE:IBM
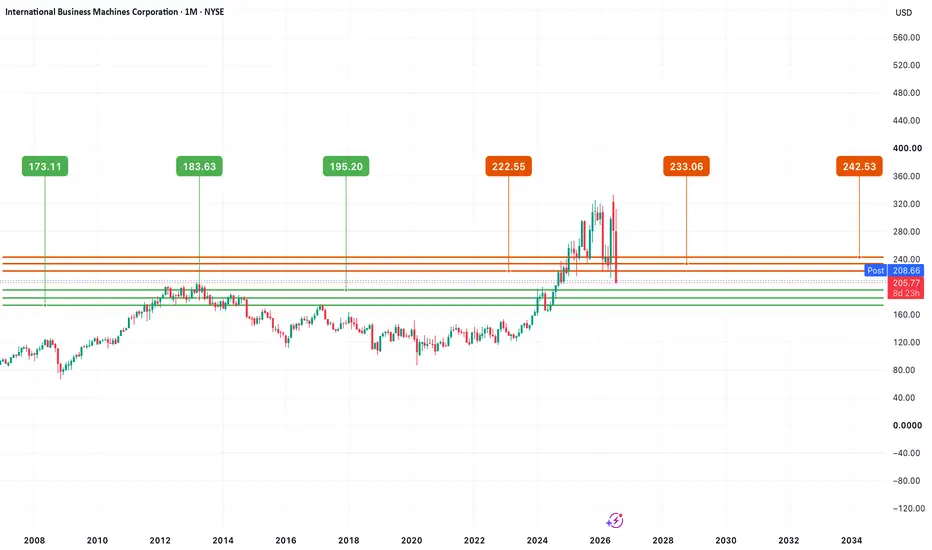
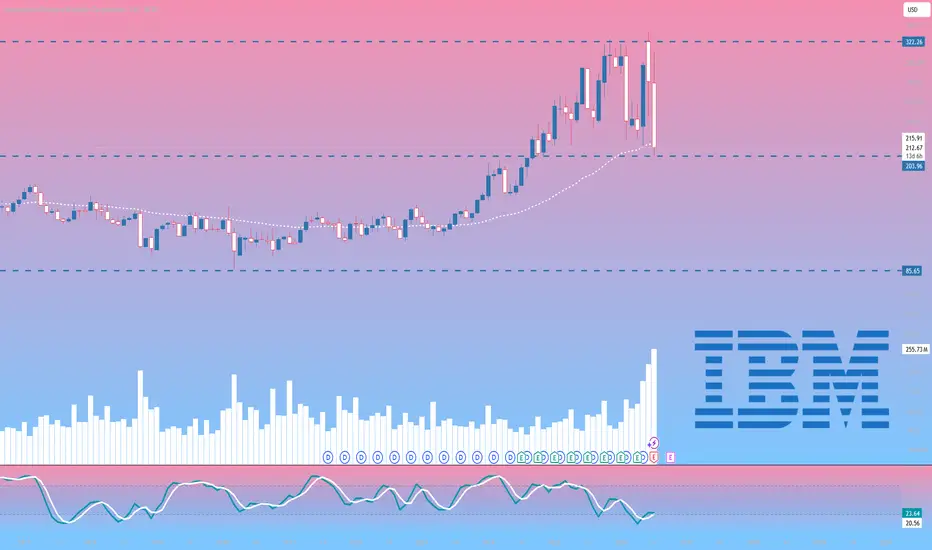
IBM comes into this session after one of the most violent sell-offs in its recent history, a drop of close to 25% that carries it from the 290 area to the current close at 217.07, all on volume that runs five times its daily average. That gap does not fall into thin air, it lands right on a structural support confluence, so this reads as a capitulation rather than a simple broken trend. On the daily timeframe price trades below the entire moving average stack, with the EMA 9 (275
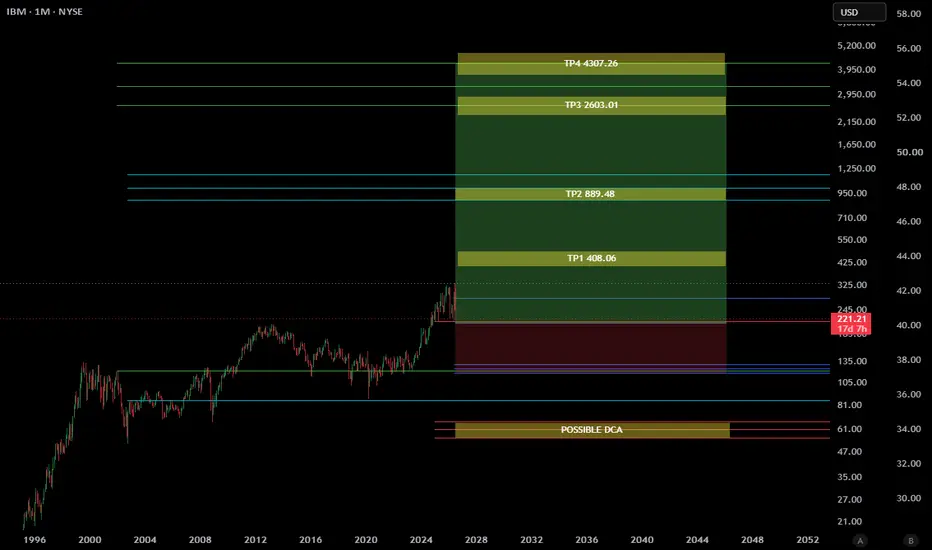
$IBM , SetupNormally not posting a full setup here.
ENTRY : CMP
TP1 : **
TP2 : **
TP3 : **
TP4 : **
SL : If you wish
** FULL SETUP AVAILABLE**
My SL is never a SELL, just an alarm to stop adding money and wait for better dca
Follow, Boost, Join, Thank You !
⚠️ Financial Disclaimer:
This post is not financial advice. I am not your financial advisor, your life coach, or your legally responsible adult.
Always do your own research and never trade based solely on internet comedy