In-depth trading ideas
JPM – Waiting for a Better EntryJPMorgan’s long-term structure remains constructive, but the stock is currently pulling back after failing near the $354–$366 resistance area.
At $340 , the price is testing its 20-week EMA around $339.70. Momentum remains neutral, with the weekly RSI near 53, while the rising 50-week SMA around $319 provides an important structural support.
I am a buyer of JPM at $325. This level would offer a more attractive risk/reward profile and sits within the broader $319– $325 support zone.
- Entry:
Major Breakout Retest at 337.43 Key Horizontal LevelOVERVIEW
JPMorgan Chase & Co. (JPM) is testing a critical horizontal pivot at 337.43 on the daily chart following an aggressive -3.42% pullback to close at 340.00. This level marks the multi-month resistance breakout zone established in early 2026, which is now being tested as support. While the primary directional bias (larger green arrow) favors a bullish defense and continuation toward previous highs near 365.00, confirmation strictly requires a clear reversal signal or daily defense above 3
JPM Short Setup: Change of Character & Key Level EntryJPMorgan ( NYSE:JPM ) is approaching a key level where I’m watching for a potential bearish move. On the 4-hour timeframe, there is a change in pattern, while the daily and weekly timeframes are showing a Change of Character (CHoCH). This combination gives me a reason to look for a pullback toward the lower support levels.
Trade Setup
* Entry: $351.60
* Stop Loss: $360.94
* TP1: $337.66–$337.69
* Final Target: $328.57
My expectation is for JPM to move lower this week from the $351.60 key leve
AI agent market interfere fears drove by 'Muse' hit JPMorganJPM | 4H Technical Analysis — Sep 23, 2026
JPMorgan is sliding after falling into the crosshairs of a broader market rotation around AI disruption risk. Goldman Sachs flagged telecom, insurance, and utilities as sectors most exposed if AI agents make it easier and cheaper for consumers to switch service providers, warning that companies have long profited from what it calls consumer inertia, the tendency for people to keep paying for services or products out of habit even when better alternati
JPM (Y26.P3.E1). Two levels of interestHi Traders,
I believe wave 3 is done based on common fib levels and we are in a corrective phase. Question is it a mild or moderate correction?
If it doesn't pull back deeper from here, I'm not interested to taking a long as the bullish candle on the 3 days suggest.
If it doesn't play out, then we just look at other charts.
All the best,
S.SAri
JP MORGAN Channel since 2009 calls for a $280 correction.JP Morgan Chase (JPM) has been trading within a 17-year Channel Up since the early 2009 bottom of the U.S. Housing Crisis. Last month it hit the Top (Higher Highs trend-line) of that Channel and got rejected back to close the month on a flat candle. This month can technically start a new cyclical Bearish Leg for the pattern.
With the 1W RSI trading under the same Lower Highs trend-line that initiated strong corrections within this Channel of at least -24%, all of which breached below the 1W MA1
Late cycle action banks in final 5th wave of C for $JPM So calling tops is a fools game but based on intermarket analysis with energy stocks outperforming (due to supply shocks) this is late cyscle stuff and IGV outperformance can still just be oversold bounce . Look at wave 1 or A I favour A ..the trend angle is much steeper in first wave favouring and A as for 5 vs 3 of C clear bearish divergence and not shown in the wave 5 the 5 of 5 has bearish divergence versus 3. This does not mean we roll over now these things can drag out .
JPM Finds Support as Uptrend ContinuesJPM is seeing buying interest after a recent retracement, with the stock maintaining a constructive technical setup. Price remains above the 50-day moving average while trading around the 20-day moving average, indicating that the longer-term uptrend remains intact despite the recent consolidation.
JPMorgan Chase & Co. has a market capitalization of approximately $947 billion and provides financial and investment banking services through four major segments: Consumer & Community Banking, Corpo
JPM | Continued stock growth- Timeframe: Weekly
- Trade type: Buy stop order
- Price: 359.30
- Take Profit: Open
- Stop Loss: 343.78 (-4.30 %)
Idea: Long on a breakout above last week's high - bullish momentum continuation.
Entry: Buy stop above last week’s high.
Stop-loss: Below the low of the same candle.
If the weekly candle closes below this level, the trade is invalidated.
Take Profit: Trailing stop following the lows of new weekly candles.
What A Good Swing Setup Actually Looks LikeAsk ten traders what a good setup looks like and you'll get ten answers. Here's mine, and more importantly, why each piece is on the list.
1. The trend is already up.
Moving averages stacked in order — the fast one above the slow one, price above both. You're not calling a bottom. You're joining something that's already working.
2. It's a leader, not a laggard.
The stock is outperforming the market, and ideally it's in a sector that's outperforming too. Strength tends to persist longer tha
JPM | Why JPMorgan Keeps Winning While Other Banks StruggleJPMorgan Chase delivered another record quarter, demonstrating that its competitive advantage increasingly comes not from favorable interest rates alone, but from the breadth of a diversified financial ecosystem that monetizes volatility, wealth creation, payments, and consumer banking simultaneously
JPMorgan reported managed revenue of $58.0 billion, up 27% year over year (15% excluding significant items), while reported revenue reached $57.3 billion, increasing 28% from the prior year. Reven
JPMorgan (JPM) — All-Time High Breakout | Target 411JPMorgan (JPM) is maintaining a strong bullish outlook and is currently trading around its all-time high, reflecting sustained buying interest and strong market confidence. Price action continues to favor the buyers, with the stock holding near elevated levels rather than showing meaningful rejection from the highs.
From a technical perspective, trading near an all-time high can indicate strong underlying momentum when buyers continue to absorb selling pressure. If JPM maintains its bullish str
JPMo Uptrend Continues, Presenting Attractive Entry OpportunityJPMorgan Chase continues to present attractive entry opportunity as it maintains a strong uptrend, characterized by higher highs and higher lows while trading above its well-aligned 20- and 50-day moving averages.
JPMorgan Chase & Co. is a $945 billion market-cap financial holding company and one of the world's leading providers of financial and investment banking services. The firm offers a comprehensive suite of products across global capital markets, including corporate advisory, equity and
JPMorgan Just Proved Why It's Still the King of Wall StreetJPMorgan turned in another standout quarter, beating expectations across the board
Net revenue climbed 28% year over year to $57.3 billion, topping estimates by $6.7 billion
Noninterest income:$31.8 billion, up 47%, helped by a one time $4.6 billion gain from its Visa investment also Net interest income (NII) is $25.5 billion, up 10%
Net income reached $21.2 billion, up 41% from a year ago
Adjusted EPS came in at $6.14, beating estimates by $0.34
📈 Trading delivers a record quarter
JP
JPMorgan Breakout Above $320 Signals Continued Bullish MomentumJPMorgan Chase (JPM) is attracting renewed buying interest after breaking out above the $320 resistance level. The stock remains in a strong uptrend, continuing to make higher highs and higher lows while trading comfortably above its well-aligned 20- and 50-day moving averages, reinforcing the bullish technical outlook.
JPMorgan Chase & Co. is a $943 billion market cap financial holding company and one of the world's leading providers of financial services. The firm offers a comprehensive range
JP MORGAN Hit the top of 17-year Resistance. Correction ahead.JP Morgan Chase (JPM) has been trading within a 17-year Channel Up since the early 2009 bottom of the U.S. Housing Crisis. This week, the market hit the top (Higher Highs trend-line) of that pattern and the strongest long-term Sell Signal just emerged.
The 1W RSI has been trading under the same Lower Highs trend-line that initiated strong corrections within this pattern of at least -24%, all of which breached below the 1W MA100 (green trend-line). The 1W MA100 has been unbroken for more than 3
JPM - Where do we go next? Current Bias: Bullish for now.
Key Pivot / Support: $332.00
Upside Targets: $370.00 – $392.00
Technical Analysis :
Breakout & Target Extension:
- Following a clear breakout above key resistance, JPM maintains a solid bullish
posture.
- A temporary pullback toward the $332 level would present a healthy retest of previous resistance-turned-support.
If buyers defend this zone, we project an upside extension toward the $370–$392 range.
Downside Risk & Invalidated Scenario: A sustained
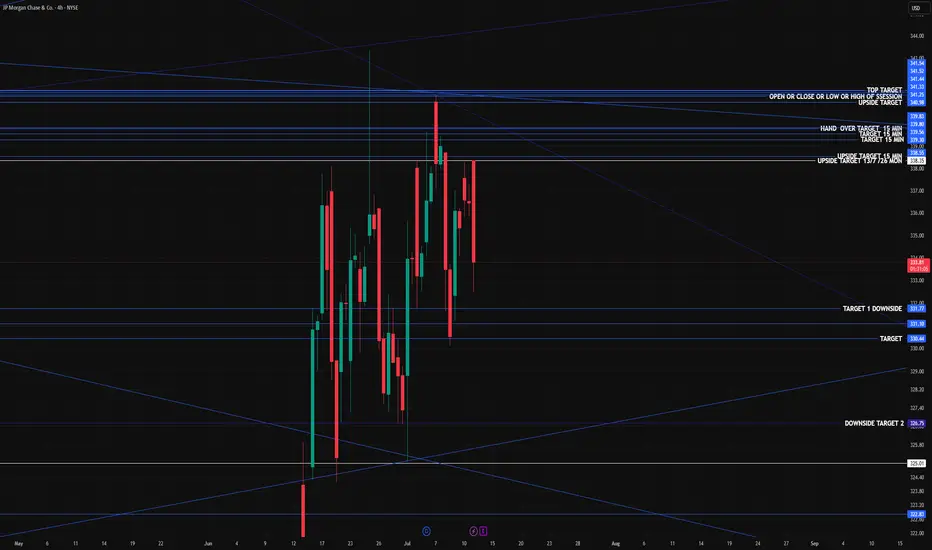
SELF TAUGHT MAPPONG MARKETS I have reverse-engineered the exact timing patterns of the global financial markets. Think of it like a master "connect-the-dots" book. I have figured out exactly how to draw the lines that predict the absolute highest and lowest points of the day. Once my lines are drawn, the market routinely fills them in perfectly.
Wall Street Reports Tomorrow. Tomorrow is the biggest single day of the earnings calendar so far this year. JPMorgan, Bank of America, Citigroup and Wells Fargo all report before the US market opens on Tuesday July 14, followed by Goldman Sachs, Morgan Stanley and BlackRock on Wednesday. Five banks valued at nearly $2 trillion releasing results in one morning.
The numbers are expected to be strong. Total Q2 earnings for the sector are forecast to grow around 10% year over year on similar revenue growth, driven by resilient