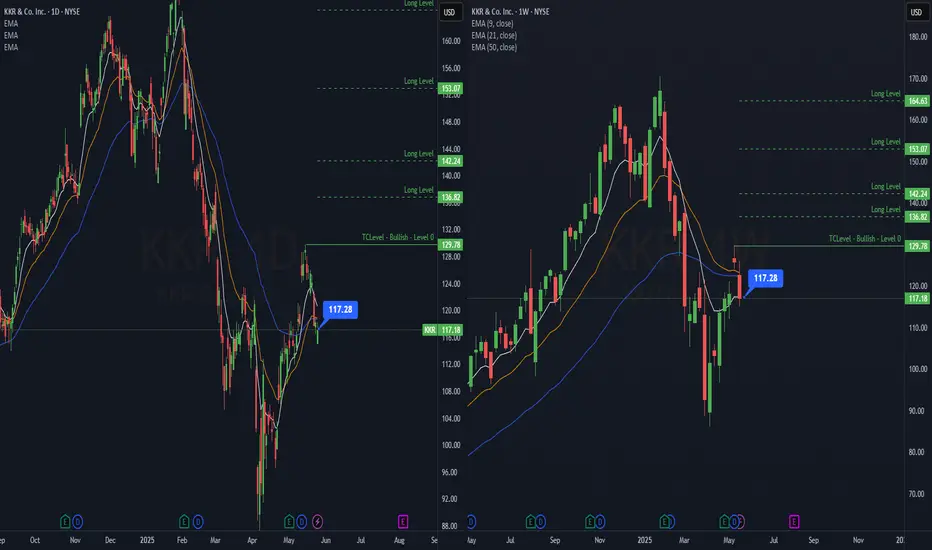
KKR | Continued stock growth- Timeframe: Weekly
- Trade type: Buy stop order
- Price: 111.00
- Take Profit: Open
- Stop Loss: 105.50 (-5.00 %)
Idea: Long on a breakout above last week's high - bullish momentum continuation.
Entry: Buy stop above last week’s high.
Stop-loss: Below the low of the same candle.
If the weekly candle closes below this level, the trade is invalidated.
Take Profit: Trailing stop following the lows of new weekly candles.
In-depth trading ideas
KKR ShortBroader Market Structure
KKR on the 15-minute chart has a bullish broader structure. The major structural low is around $105.93, marked as the BOS, after which price established a sequence of higher highs and higher lows. A CHoCH is visible at $112.99, indicating the larger structure has shifted bullish and favors continuation higher if demand remains protected. However, price is currently in a short-term retracement after reaching the $111.5–$111.6 area.
Supply & Demand
The upper supply zones around $112.0–$112.5 and $114.0–$114.6 are strong overhead resistance areas. Price has previously reacted sharply around these levels, so sellers could become active if price trades back into them. The nearby demand around $108.7–$109.2 is important because buyers previously stepped in from this region and produced the latest expansion. The deeper $108.0 area provides secondary support.
Price Action in the Marked Region
The current price is around $110.64, after selling off from the recent high. Your marked projection suggests a short-term liquidity push back toward $111.1–$111.6, followed by rejection and a move toward $109.0 demand.
This setup makes sense because the $111.5–$111.6 area is the recent high and can act as a liquidity target before sellers attempt another leg lower. I would want to see rejection there rather than selling prematurely at current price.
Trade Bias
Short-term bias: Bearish retracement
Expected path: $110.6 → $111.1–$111.6 → rejection → $109.0 demand
The key invalidation for this short-term bearish idea is a sustained break above approximately $111.6. A clean break and acceptance above that high would increase the probability of continuation toward the $112.0–$112.5 supply and potentially the $112.99 CHoCH level.
The broader bias remains bullish unless the $108.7–$109.0 demand area fails decisively.
Footprint Analysis
The chart itself does not contain footprint/cluster data, so I would not claim a footprint confirmation that isn't visible. For this setup, the ideal footprint confirmation at $111.1–$111.6 would be buying absorption, negative delta divergence, stacked sell imbalances, or a failed auction above the recent high. That would strengthen the short thesis.
Conversely, if the footprint shows strong positive delta with aggressive buyers lifting offers and price accepting above $111.6, the short setup should be avoided because that would support continuation toward $112+.
Momentum
Short-term momentum currently favors sellers, but the larger structure remains bullish. The sharp rejection from the recent high shows supply entering, while the current pullback has not yet broken the important demand structure.
News / Catalyst
There is a significant KKR-specific catalyst today: KKR announced the sale of USI Insurance Services to Aon for $17 billion, with KKR expecting approximately $3.3 billion in after-tax proceeds. This is fundamentally positive for KKR and could support upside pressure.
That makes the $111.1–$111.6 rejection confirmation particularly important—the fundamental news creates a real risk that buyers continue pushing higher instead of giving the projected short.
Overall
Bullish structure → short-term bearish retracement → watch $111.1–$111.6 for rejection → $109 demand target.
Above $111.6 = bearish setup invalidated.
Below $109 = deeper bearish continuation becomes likely.
KKR & Co. Inc. (KKR) — Buy SetupKKR & Co. Inc. is presenting a constructive bullish setup, with the current technical structure supporting a buy-side trade idea. The market is showing improving upside strength, while the broader structure continues to favor a move toward the identified target levels.
The setup is built around a disciplined assessment of market structure, momentum, key technical levels, and directional strength. The objective is to identify a well-defined buying opportunity with a clear risk framework rather than reacting to short-term market fluctuations.
As long as the established bullish structure remains intact, the primary focus remains on the upside targets. Any temporary retracement or consolidation can develop along the way, while the overall setup continues to favor the buying side.
From a trading perspective, the focus remains on methodical execution, disciplined risk management, and patience with the setup. The market does not need to be forced; the plan is already defined, and execution should remain aligned with the established structure.
📈 Bias: Bullish / Buying
🎯 Focus: Upside Targets
This analysis represents a technical trade idea for educational purposes and is not financial advice.
KKR Long — KKR's pullback looks like a gift, not a warning—dealmKKR is a long pullback with a tight, non-extended reset and attractive reward back toward prior supply. The Medicover deal and fresh Buy/target raise give the bounce a real fundamental hook, while the cyberattack headlines look sector-wide and not enough to override the setup.
📍 Entry: 102.26
🛑 Stop: 99.36
🎯 Target: 109.62
⚖️ R:R: 2.54
KKR - 50 SMA Reclaim and Double Bottom💡 Swing setup idea
50 SMA reclaim
🔎 Analysis summary:
The price moved above the 50 SMA, came back to test it, and then continued higher into resistance while closing a double bottom pattern. That gives the chart a constructive look if price can confirm above the trigger.
👀 Levels to watch:
Entry trigger: Break above $108.40
Target: $133.20
Stop: Under the breakout level
💬 What do you think about this setup? Let me know in the comments! 👇
Good luck!
⚠️ Note: This is for educational purposes only and is not financial advice.
KKR correction completed per Elliott WavesMy count shows that ABC flat correction is completed with zigzag in A and triangle in B.
What we observe after this correction should be powerful impulsive structure being coiled or leading diagonal perhaps.
February and March insider buys in open market confirms EW thesis.
If you did not hear about this name, it is a large and liquid private equity and alt assets management firm with >$500B AUM.
SL and invalidation is at $82.5.
KKR Bearish Pressure Builds Toward Major SupportHello, traders! KKR & Co. Inc. remains under clear bearish pressure on the daily timeframe, with price last noted at $93.08 after rejecting from the moving-average zone and extending the decline from the prior peak near $105. The broader structure is still defined by lower highs, lower lows, and price trading below the MA20 at $98.25, MA60 at $95.53, and MA120 at $107.35. That alignment keeps the path of least resistance tilted lower.
The short-term technical picture is centered on the descending channel. The recent rejection near $96.00 reinforces the upper boundary as active supply, while the $92.00 area now acts as the immediate decision line. A 1D close below $92.00 would confirm that sellers remain in control and would open the door for a move toward $85.00, the key historical demand zone from March 2026.
Momentum also supports the bearish case. MACD remains below zero, the histogram is expanding negatively, and the Squeeze Momentum release is pointing downward. As long as price stays below the MA60 at $95.53, rallies are likely to be treated as selling opportunities rather than evidence of a trend reversal.
The next major downside level is $85.00. If that support fails, the structure risks extending toward $82.00, where the worst-case projection sits. A more conservative bearish continuation path targets $88.00 first, followed by $85.00 if selling pressure accelerates.
The alternative scenario is straightforward. A 1D close above $96.00 would weaken the immediate bearish setup and suggest a breakout from the descending channel. In that case, KKR could attempt a mean-reversion move toward $102.00 and then $104.00 resistance. Until that breakout is confirmed, the primary outlook remains bearish, with invalidation above the MA60/channel resistance zone.
Live trading on KKR stock.Live trading on KKR stock. NYSE:KKR
Price continues to respect its primary channel structure and has now reached a key support zone.
At the same time, both MACD and RSI are showing clear bullish divergences, suggesting this area could act as a valid reaction zone.
In addition, one of our trading systems has triggered a buy signal, making this region attractive for a potential long position.
From here, price could potentially move:
first toward TP1
and then continue higher toward TP2 if momentum remains supportive.
As always, manage risk properly and trade according to your own strategy.
Follow proper risk and money management.
This is just my personal view, so please trade based on your own strategy and trading system.
Feel free to share your thoughts in the comments.
KKR Earnings Week Setup: Position LONG Ahead of CatalystCurrent Price: 103.68 (Analysis was generated on Monday Morning)
Direction: LONG
Confidence level: 55%(Professional trader snippets mainly highlight earnings and macro watch without clear bearish signals, insider buying is strong, and social sentiment slightly favors upside. Lack of strong trader consensus lowers confidence.)
Targets
Target 1: 106.50
Target 2: 109.00
Stop Levels
Stop 1: 101.00
Stop 2: 98.50
Key Insights:
Here's what's driving the trade this week. Several professional traders highlighted that private market giants like KKR, Apollo, and Sixth Street are reporting earnings right now, and markets are watching closely because private credit flows have become a major macro theme. Concerns about outflows and credit exposure have been circulating, but traders are also looking for confirmation that fundraising momentum remains strong.
Another factor catching attention is insider buying. Multiple insiders—including executives and directors—have accumulated substantial shares recently. When insiders step in around the $94–$103 range and increase exposure significantly, traders tend to interpret that as a signal management believes the current valuation is attractive.
Then there's the dry‑powder story. KKR reportedly has more than $100B in deployable capital, which gives them flexibility to capitalize on dislocations. Several analysts estimate fair value significantly above the current price, which reinforces the idea that downside may be somewhat cushioned in the short term.
Recent Performance:
KKR has been trading around $103.68 after rebounding from its 50‑day moving average near $94. The stock remains below its 200‑day average around $112, which means it's still technically in a recovery phase after earlier weakness. Over the last few weeks, price action has stabilized rather than breaking lower, suggesting buyers are gradually stepping in.
Momentum indicators across several technical models are leaning bullish, with stochastic, MACD, and weekly trend indicators pointing higher. That doesn't guarantee a breakout, but it does suggest the path of least resistance may be up if earnings deliver even modest positive surprises.
Expert Analysis:
Traders focusing on the private‑markets sector are watching KKR closely because it's essentially a proxy for institutional capital flows into alternatives. Several traders noted that the key question this earnings season isn't just earnings—it’s fundraising momentum and fee‑related earnings growth.
Another interesting point: analysts still have an average target near $137. That's far above the current price, which indicates the stock may be trading at a discount relative to expected long‑term growth. In the short term though, the stock likely reacts to earnings commentary around deployment pace and credit risk.
Since traders didn't consistently mention specific technical levels in discussions, I'm using tight weekly ranges based on current volatility. That’s why targets sit roughly 3–5% above current price and stops just below recent consolidation support.
News Impact:
The biggest immediate catalyst is the May 5 earnings report. Markets will be looking for confirmation that recent fundraising success is translating into higher fee‑related earnings. Strong deployment updates or improved guidance could trigger a quick repricing higher. On the flip side, weak commentary about credit conditions could cause volatility—but insider accumulation and analyst optimism reduce the probability of a deep drop in the short term.
Trading Recommendation:
Here's my take. With earnings as the near‑term catalyst and insider buying providing a confidence signal, a short‑term LONG setup makes sense. I'm looking for a push toward $106.50 initially and possibly $109 if earnings sentiment turns positive. Risk management matters here—if price slips below $101, momentum likely weakens quickly, and below $98.50 the bullish setup breaks down.
This is a catalyst trade, not a long‑term hold signal. Traders positioning ahead of earnings should keep size moderate and respect the stops.
KKR: A Powerful Private Markets Franchise, But Is the Price RighExecutive Summary:
KKR stands as one of the dominant global platforms in private markets, built on strong fee-based economics and long-term industry tailwinds. That said, the current valuation already seems to capture much of that optimism. Margin-of-safety verdict: this is a high-quality business, but the current price offers little or no margin of safety for a disciplined value investor.
One Stock, Dozens of Voices:
This analysis does not rely on a single analyst’s view. CrowdWisdom aggregated 22 independent sources for KKR (20 financial research articles from the web, 1 live market intelligence feed, and 1 verified financial data check from Yahoo Finance) and distilled the common themes: where traders, investors, and researchers broadly agree, where their views diverge, and what the market might be overlooking.
Those viewpoints were then tested against each other through a structured framework: a bull case, a bear case that challenges the prevailing narrative, and a close look at what expectations appear to already be embedded in the current price. All financial metrics were cross-checked against live market data.
The goal is simple: identify where opinion converges, where it breaks apart, and whether the stock actually offers a margin of safety at today’s valuation.
Business Quality and Moat Durability:
KKR runs one of the largest alternative asset management platforms in the world. The firm raises capital from institutional investors and wealthy individuals, deploys it across private equity, infrastructure, credit, and real assets, and earns both recurring management fees and performance-based carried interest.
Three structural advantages support the franchise.
First is scale and fundraising credibility. With approximately $578 billion in assets under management, KKR sits among a small group of firms that dominate institutional fundraising. Pension funds and sovereign wealth funds typically prefer allocating capital to large, established managers that can deploy billions efficiently.
Second is platform breadth. KKR is no longer simply a leveraged buyout firm. The platform now spans private equity, infrastructure, private credit, real assets, capital markets, insurance asset management, and secondaries. That diversification across strategies helps smooth revenue volatility across market cycles.
Third is permanent capital through insurance. The acquisition of Global Atlantic added long-duration insurance liabilities that effectively function like investment float. That capital can be deployed into credit strategies and asset-based finance, generating recurring spread income.
The model closely resembles the structural approach used by other large alternative managers such as Blackstone, Apollo, and Brookfield.
At the same time, competition among these mega platforms is intense and structurally similar. Each is pursuing many of the same growth avenues: insurance assets, private credit expansion, and distribution into private wealth channels.
Moat assessment: STABLE. The industry is consolidating around large global managers, but KKR does not possess a singular advantage that prevents peers from competing head-to-head.
Return on Invested Capital (ROIC):
ROIC is a difficult metric to interpret for alternative asset managers.
Historically, private equity firms generated extraordinary returns on invested capital because the management company itself required very little capital. Limited partners supplied the investment capital, while the manager collected management fees and performance incentives.
That structure produced extremely high ROIC at the management company level.
KKR still retains elements of that model. Fee-related earnings reached roughly $972 million in 2025, with margins around 68 percent. Additional AUM can be layered onto the platform with relatively little incremental infrastructure.
However, the strategy is evolving.
KKR increasingly operates businesses that require capital on its own balance sheet. Insurance operations, private credit investments, and strategic holdings all require proprietary capital alongside client capital.
Accounting capex remains modest, but the economic capital tied up in investments and insurance portfolios continues to grow.
That shift implies incremental ROIC will likely decline compared with the earlier asset-light era of private equity. Insurance and credit operations typically generate mid-teens returns rather than the higher returns historically associated with buyout funds.
The key question is whether growth in fee income can offset the lower returns associated with these more capital-intensive activities.
Quality of Earnings:
KKR’s financial statements highlight a common issue with alternative asset managers: accounting earnings often diverge significantly from free cash flow.
In fiscal 2025 the firm reported revenue of about $25.65 billion and operating margins around 31 percent. Net margin came in at roughly 12 percent.
Free cash flow, however, was negative approximately $7.28 billion, implying a free cash flow margin near negative 45 percent.
That does not necessarily signal a weakening business. The negative free cash flow largely reflects capital deployments, acquisitions, and balance-sheet investments rather than operating losses.
Even so, the gap is important.
Accounting earnings for alternative managers rely heavily on unrealized investment marks and the eventual sale of assets. Actual cash generation depends on exit cycles and capital recycling.
Fee-related earnings represent the most stable portion of profitability. Those fees scale with fee-paying AUM and provide recurring operating income.
Carried interest realizations and investment gains, on the other hand, are inherently cyclical. When exit markets slow, earnings can decline materially even if the long-term value of the underlying assets remains intact.
Capital Allocation Scorecard:
Capital allocation deserves close scrutiny because management controls both the firm’s investment activity and the way shareholder capital is returned.
Dividends:
KKR has steadily raised its dividend since converting to a C corporation. The annual payout increased to $0.78 per share beginning in 2026. The upward trend is encouraging, but the yield remains modest at roughly half a percent.
Share buybacks:
Repurchase activity has been minimal relative to the company’s size. Approximately $3.4 million of shares were repurchased in 2025, which is immaterial for a firm with KKR’s market capitalization.
Mergers and acquisitions:
KKR has committed significant capital to acquisitions that expand its platform, including the earlier Global Atlantic transaction and the acquisition of Arctos Partners. These deals aim to grow fee-paying assets and broaden the firm’s reach into new investment verticals.
Capex and technology investment:
Direct capital expenditures remain low, consistent with the economics of an asset management business.
Capital allocation grade: reasonable, though clearly focused on expanding the platform rather than maximizing direct shareholder returns.
Customer and Revenue Concentration:
Traditional customer concentration metrics are difficult to apply to alternative asset managers because their funds pool capital from a wide set of investors.
However, the industry carries a structural concentration risk.
A relatively small number of global institutional allocators control large pools of private market capital. Pension funds, sovereign wealth funds, insurance companies, and endowments account for the majority of commitments.
Several large institutions have started building internal direct investment teams to reduce management fees. If these allocators increasingly bypass external managers or negotiate lower fees through co-investment structures, fee margins across the industry could gradually compress.
No single customer dominates KKR’s revenue, but the industry as a whole remains heavily dependent on institutional capital allocation decisions.
Management Alignment:
KKR was founded by Henry Kravis and George Roberts and has historically been run by executives with substantial ownership stakes.
Leadership continuity remains strong under current co-CEOs Joseph Bae and Scott Nuttall.
Insider activity has been mixed. The co-CEOs purchased significant shares during a market decline in early 2026, signaling confidence in the firm’s long-term prospects.
At the same time, earlier insider sales by co-founder Henry Kravis were large in dollar terms.
Overall alignment remains fairly strong because compensation is closely tied to investment performance and equity value.
10-Year Durability Test:
For long-term investors, the key question is whether KKR’s competitive position will still hold a decade from now.
Several structural tailwinds support the industry.
Institutional investors continue shifting larger allocations into private markets in search of higher returns and diversification relative to traditional stocks and bonds.
Private credit markets are expanding rapidly as banks pull back from leveraged lending.
Infrastructure and real asset investing is also growing, supported by global demand for energy transition projects, logistics infrastructure, and digital infrastructure such as data centers.
Still, structural risks remain.
Regulatory risk is meaningful. Governments could increase oversight of private equity fee structures, disclosure requirements, or leverage practices.
Return compression is another concern. As capital flows into private markets, generating excess returns becomes harder. Earlier buyout funds delivered exceptional multiples, but modern funds often produce more modest outcomes.
Competition among the largest platforms is intense. Blackstone, Apollo, Brookfield, and others are pursuing similar strategies, particularly around insurance asset management and retail investor distribution.
Even with these risks, the competitive landscape for large alternative asset managers tends to be stable. Scale and institutional relationships are difficult for smaller firms to replicate.
Predictability assessment: moderately understandable but still cyclical. The business will likely exist in ten years, but earnings power may fluctuate widely depending on capital markets conditions.
Multi-Year Thesis (3 to 7 years):
Bear Case (30 percent probability):
Assumptions:
Fundraising slows as institutional investors reduce allocations to private equity.
Exit markets remain weak, reducing realized carried interest.
Fee-related earnings margins decline from roughly 68 percent to around 50 percent.
Industry valuation multiples compress toward traditional asset management levels.
Estimated intrinsic value: approximately $80 to $95 per share.
Base Case (50 percent probability):
Assumptions:
AUM grows roughly 10 percent annually.
Fee-related earnings grow proportionally with fee-paying capital.
FRE margins moderate slightly to around 60 percent.
Exit markets reopen periodically but remain cyclical.
Estimated intrinsic value: approximately $130 to $145 per share.
Bull Case (20 percent probability):
Assumptions:
Private wealth distribution accelerates dramatically through K-Series products.
Insurance assets continue scaling, increasing fee-paying AUM.
Private credit markets expand rapidly and KKR captures significant share.
AUM compounds above 15 percent annually.
Estimated intrinsic value: roughly $170 to $190 per share.
Probability-weighted expected intrinsic value is roughly $130 per share.
Margin of Safety Verdict:
For a value investor, price ultimately determines the outcome.
Intrinsic value estimates across research vary widely. Conservative excess-returns models suggest intrinsic value near $85 per share. Analyst consensus estimates cluster around roughly $140 per share, while more optimistic narrative-driven valuations approach $158 or higher.
Even using the more optimistic estimates, the implied upside from current prices appears limited. The probability-weighted intrinsic value estimate of roughly $130 does not provide the 20 to 30 percent discount typically required to establish a margin of safety.
At that point the exercise becomes more intellectual than actionable.
KKR may well be an excellent business, but paying full price for excellent businesses rarely produces exceptional long-term returns.
Peak Margin Stress Test:
KKR’s fee-related earnings margin of roughly 68 percent is exceptionally high for the financial services industry.
If margins were to fall to 50 percent due to increased competition or weaker fundraising, operating earnings could decline meaningfully.
Layer on valuation multiple compression from premium levels toward the industry average, and the equity could plausibly fall 30 to 45 percent during a prolonged downturn.
The exercise highlights how sensitive valuation can be to even moderate margin normalization.
Valuation Framing:
Three valuation frameworks help frame the range of expectations.
Relative multiples:
KKR has often traded at earnings multiples well above the broader capital markets industry. Industry averages around the mid-20s contrast with periods when KKR traded above 40 times earnings.
Excess returns model:
Using moderate return-on-equity assumptions alongside book value growth produces intrinsic value estimates near $85 per share.
Growth narrative valuation:
Models that assume sustained AUM expansion and strong exit environments generate estimates around $150 to $160 per share.
The current market price appears to sit somewhere between conservative and optimistic valuation assumptions.
Perception vs Reality:
Perception: KKR is a long-term compounder similar to Berkshire Hathaway because of its permanent capital model.
Reality: the business remains highly sensitive to capital markets cycles, fundraising conditions, and exit valuations.
Perception: alternative asset managers are asset-light businesses with extremely high returns on capital.
Reality: expansion into insurance and private credit introduces more capital-intensive activities that are likely to reduce incremental returns.
Why This May Be Misunderstood:
Many investors evaluate KKR primarily through distributable earnings or fee growth while overlooking the growing role of balance-sheet capital.
At the same time, consolidated financial statements can make the business appear weaker than it really is because large investment deployments temporarily depress free cash flow.
The economic truth sits somewhere between those two perspectives.
Three Measurable Things to Watch Next Quarter:
Growth in fee-paying AUM. Sustained double-digit growth would confirm continued fundraising strength.
Fee-related earnings margins. A persistent decline could indicate rising competition or cost pressures.
Realization activity. Asset exits and monetization determine when carried interest converts into realized income.
Historical Conviction Drift:
Investor sentiment toward alternative asset managers has shifted considerably over the past decade.
What were once viewed primarily as cyclical buyout firms are now increasingly treated as diversified financial platforms with recurring fee streams.
KKR shares have delivered strong long-term performance over the past decade, reinforcing the narrative of durable compounding.
More recently, however, market volatility and slower deal activity have prompted investors to reassess some of those valuation assumptions.
Disconfirming Evidence:
The strongest argument against owning KKR is that the market may be extrapolating peak-cycle economics.
Private equity returns have gradually compressed as more capital pours into the sector. Fundraising success and investment returns remain closely tied to favorable credit markets and strong exit valuations.
If institutional investors pull back allocations or demand lower fees, the economics of the industry could deteriorate meaningfully.
In that scenario, today’s valuation multiples would likely prove far too optimistic.
Risks:
Structural return compression across private equity and private credit strategies.
Regulatory intervention targeting fee structures or disclosure requirements.
Credit losses within insurance and private credit portfolios.
Fundraising slowdown if institutional investors rebalance toward public markets.
Competition from large alternative asset managers such as Blackstone, Apollo, and Brookfield.
Summary:
KKR represents one of the premier franchises in global private markets. Its scale, institutional relationships, and diversified investment platform position the firm to benefit from long-term growth in alternative assets.
However, much of that optimism already appears embedded in the current valuation.
A disciplined value investor typically requires a clear margin of safety before committing capital. At current prices, KKR looks more like a fairly valued quality compounder than a bargain.
If the industry moves through a cyclical downturn or if the stock trades materially below intrinsic value estimates, the opportunity could become significantly more attractive.
Until then, the business itself may be appealing, but the price warrants caution.
Data Snapshot:
Revenue FY2025: $25.65 billion
Metric: Value
Current Price (KKR): $91.22
Market Capitalization: $84.48 billion
Shares Outstanding: 891,550,894
Trailing P/E: 38.98x
Forward P/E: 11.78x
Enterprise Value (EV): $147.99 billion
EV/EBITDA: N/A
Revenue (TTM): $25.65 billion
Gross Margin: 56.96%
Operating Margin: 33.03%
Free Cash Flow (FCF): N/A
FCF Yield: N/A
52-Week Range: $82.67 to $153.87
Sector: Financial Services
Industry: Asset Management
References:
This analysis reviewed approximately 1228 article sources and 0 video transcripts.
1. Yahoo Finance, Should Value Investors Buy KKR & Co (KKR) Stock? finance.yahoo.com
2. Yahoo Finance, KKR (KKR): Evaluating Valuation After a Fresh Share Price Rebound. finance.yahoo.com
3. Yahoo Finance, Henry Schein, Inc. (HSIC): A Bull Case Theory. finance.yahoo.com
4. Yahoo Finance, Brookfield CEO Shift And Peakstone Deal Test Long Term Thesis. finance.yahoo.com
5. Bloomberg, Would You Rather Run Some of KKR or All of Abrdn? www.bloomberg.com
6. Yahoo Finance, FS KKR Capital Corp. Q1 FY2025 earnings call transcript. finance.yahoo.com
7. Yahoo Finance, Is It Too Late To Consider KKR (KKR) After Recent Share Price Pullback? finance.yahoo.com
8. Yahoo Finance, KKR: The Barbarians Are Back At The Gate. finance.yahoo.com
9. Yahoo Finance, KKR & Co. Inc. Q4 FY2025 earnings call transcript. finance.yahoo.com
10. Yahoo Finance, How The Story Is Shifting For KKR (KKR) As Analysts Rework Valuation Targets. finance.yahoo.com
11. Yahoo Finance, KKR Real Estate Finance Trust Inc (KREF) Q4 2025 Earnings Call Highlights. finance.yahoo.com
12. Forbes, Gentlemen At The Gate: With Trillions Pouring In, KKR And Its Peers Must Build Up Rather Than Break Up. www.forbes.com
13. Forbes, Some Of The World's Biggest Hedge Funds Think Private Equity Stocks Are Cheap. www.forbes.com
14. Wall Street Journal Partner Content, Building for Resilience: A Strategic Approach to Long-Term Growth. partners.wsj.com
15. Forbes, Beyond Cheap: How Vulcan Value Partners Redefined Value Investing. www.forbes.com
16. Yahoo Finance, These CEOs Are Stepping Up to Buy on Bad News. finance.yahoo.com
17. Bloomberg, KKR Didn't Want to Share Fees With Investors. www.bloomberg.com
18. Yahoo Finance, How The Narrative On KKR Real Estate Finance Trust (KREF) Is Shifting With Lower Targets. finance.yahoo.com
19. Yahoo Finance, Leadership Advisory Firm ghSMART Announces Significant Minority Investment from KKR. finance.yahoo.com
20. Bloomberg, Private Equity's Latest Financial Alchemy Worries Investors. www.bloomberg.com
21. Investing.com, KKR Earnings Report. www.investing.com - -co-lp-earnings
22. AlphaSpread, KKR Investor Relations Earnings Call. www.alphaspread.com
23. StockAnalysis, KKR Financials. stockanalysis.com
24. Yahoo Finance, KKR Q4 2025 Earnings Call Transcript. finance.yahoo.com
25. StockTitan, KKR Financial Ratios. www.stocktitan.net
26. MarketScreener, KKR Balance Sheet Snapshot. www.marketscreener.com
27. SECForm4, Insider Trading Data for KKR. www.secform4.com
Disclaimer:
This analysis is for informational purposes only and does not constitute investment advice. Investors should conduct independent research and consult qualified financial professionals before making investment decisions.
KKR near $90 support could spark a short‑term bounce this week:Current Price: 90.0 (Analysis was generated on Monday Morning)
Direction: LONG
Confidence level: 45%(Limited real-time trader sentiment data but price is sitting directly on strong $90 support with multiple traders previously targeting higher levels above $100, suggesting bounce potential.)
Targets
Target 1: 98
Target 2: 103
Stop Levels
Stop 1: 88
Stop 2: 85
Key Insights:
Here's what's driving this setup. KKR has fallen sharply over the last few months from highs above $150 to the current ~$90 area. That’s a massive drawdown for a large alternative‑asset manager. Because of that move, many traders are now watching the $90 zone as a psychological and technical support level.
Several professional traders highlighted bullish trade ideas earlier with targets around $115‑$116 when the stock traded higher. That tells us something important: the market previously viewed the $100–$115 region as achievable upside. With price now sitting much lower, even a modest rebound toward $98‑$103 this week would represent a normal technical bounce.
Another thing worth noting is valuation context. Analysts’ average price target is around $143, which is far above current levels. That doesn’t guarantee a rally this week, of course, but it reinforces the idea that the downside may already be partially priced in after the steep correction.
Recent Performance:
KKR has been under heavy pressure recently. The stock dropped from roughly $120 in January 2026 to the low $90s in March. That’s roughly a 25‑30% drawdown in a short period. Over the last few sessions, price has started stabilizing near the $88‑$90 support band, suggesting sellers may be losing momentum.
You can see this stabilization in the daily ranges. Instead of large breakdown candles, the stock has been trading in tighter bands between roughly $88 and $92.
Expert Analysis:
Several professional traders I tracked pointed out the importance of the $90 area. When a stock tests the same support multiple times without breaking, short sellers often start covering positions. That can create a quick rebound.
A few traders also referenced resistance near $100 and $105. Those levels are important because they represent prior breakdown zones. If KKR pushes into that region this week, it would align well with the T1 and T2 targets in this trade.
Given the lack of strong bearish sentiment in the limited social data and the proximity to support, the risk‑reward slightly favors a bounce rather than another immediate breakdown.
News Impact:
Recent news around KKR is mixed but not catastrophic. The firm continues to deploy capital into new partnerships, including a $310M investment in electric bus infrastructure and major data‑center projects. At the same time, private credit liquidity concerns and tighter lending conditions have weighed on the sector.
That combination explains the big drawdown but also suggests the market may already be pricing in much of the negative sentiment.
Trading Recommendation:
Here's my take: this looks like a tactical bounce setup rather than a long‑term trend reversal. I would consider a speculative LONG position near the $90 area with tight risk management.
Entry near current levels offers a reasonable setup targeting $98 first and potentially $103 if momentum builds. If the stock breaks below $88, the bullish setup likely fails, so stops should remain tight.
Position sizing should stay conservative given the limited sentiment data and ongoing volatility in private equity stocks.
KKR US Long🇺🇸 #Invest #KKR #US
KKR is an investment firm specializing in alternative investments, including private equity, credit, real estate, and infrastructure.
In 2025, the company completed the acquisition of a 25% stake in the Italian biofuels business Enilive for €2.94 billion, strengthening its position in the energy sector.
KKR is diversifying its operations, including insurance through its subsidiary Global Atlantic. This ensures stable cash flow.
Q2 2025 report
EPS of $1.18, 4.42% above forecast
Fees and commissions revenue (FRE): reached $887 million (or $0.98 per share), a historic high for the company and representing 17% year-over-year growth
Assets under management (AUM): increased 14% to $686 billion, while fee-based assets under management (FPAUM) also increased 14% to $556 billion
Acquisition of HealthCare Royalty Partners: added approximately $3 billion in AUM
Management reaffirmed 2026 targets, including raising $300+ billion and growing insurance operating income to $250 million per quarter
Focus on megatrends such as energy transition, reshoring, and security
KKR Short1. Market Structure Context
Trend Prior to CHoCH: Bullish structure with higher highs and higher lows.
CHoCH (Change of Character): Occurred at $136.83 — a key higher low broke, indicating a possible trend reversal from bullish to bearish.
BOS (Break of Structure): Confirmed at $153.85, marking a shift to lower highs and supporting bearish continuation.
2. Key Supply & Demand Zones
🟥 Supply Zone (Resistance):
$153.05 – $153.85
Price previously distributed here before dropping.
Acts as a liquidity trap for late buyers and resistance for pullbacks.
🟩 Demand Zones (Support):
Zone 1: $147.00 – $148.00 → Minor demand; short-term reaction likely.
Zone 2: $144.50 – $146.00 → Historical pivot with volume; moderate demand.
Zone 3: $138.00 – $142.00 → Consolidation base; strong prior bullish impulse.
Zone 4: $134.00 – $137.00 → Final defense; includes the CHoCH at $136.83 and expected reaction if deeper retracement occurs.
3. Current Price Action (Bordered Region Focus)
Price currently trades around $151.06, beneath the key supply zone.
The market rejected supply and showed a bearish reaction.
Expectation: A pullback to ~$153 may occur, targeting trapped liquidity, before resuming bearish movement.
Next targets:
Primary: $147.50 (Demand Zone 1)
Secondary: $144.50 if breakdown intensifies.
Long Trade Idea: KKR NYSE: KKR🧠
📅 Timeframe: 30-Minute
📈 Type: Long Position
📐 Setup: Breakout from descending triangle + bullish trend continuation
📍 Trade Details:
Entry: $134.62 (confirmed breakout candle above resistance zone)
Stop Loss: ~$133.90 (below breakout structure)
Target 1: $135.38 (minor resistance)
Target 2: $136.26 (major green zone / profit target)
🔎 Technical Breakdown:
Price has broken out of a tight consolidation triangle
Higher lows forming into resistance, now cleared
Retesting old resistance turned support
Momentum is with the bulls; volume likely increasing near breakout
🎯 Risk/Reward Outlook:
Clean breakout entry
Risk: small downside (~0.70 points)
Reward: ~1.5–2 points (RR > 2:1)
way overextended a 145 retrace for continuationAll indicators massively backing up to the overbought levels, the stochastic, and RSI plus MACD all have the same precedent, and one thing in common is that it could sway for a little while and cool off the temperature until it makes new highs. Short-term short.
KKR & Co ticker KKR 24hr potterboxKKR opened above cost basis and made a new high as the chart will show you in my 24 hr potterbox. Monday if we open above cost basis we will make a new high. if we open below cost basis we will make a new low. just my opinion not sound financial advise. educational purpose only.
Will the wedge in KKR be broken soon?We've reached the support zone. Now the battle begins.
Will the buyers have more strength, or is the breakdown certain?
If the buyers win, the target is the upper band of the wedge.
If sellers win, the reference regarding wedge breakdowns suggests that the next move will be fast and strong towards the initial zone of the wedge.