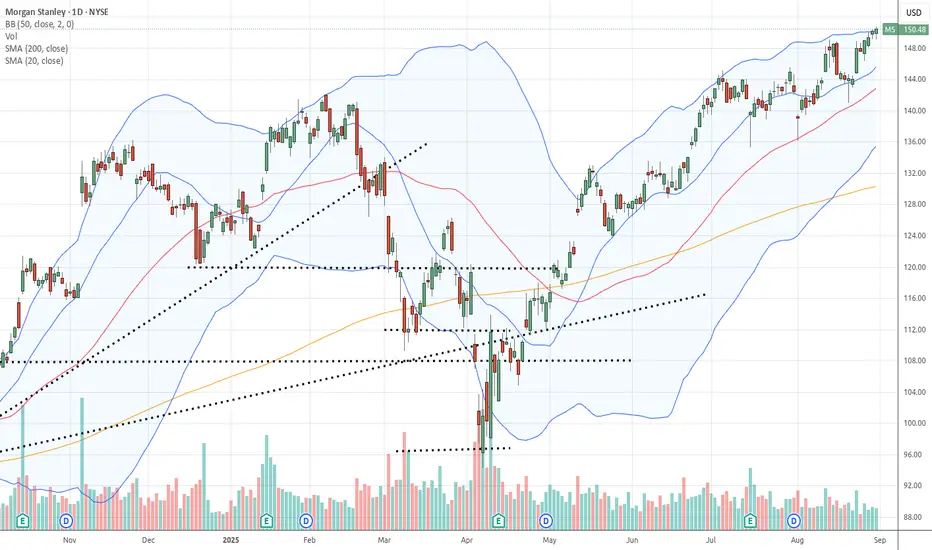
MS | Continued stock growth- Timeframe: Weekly
- Trade type: Buy stop order
- Price: 220.12
- Take Profit: Open
- Stop Loss: 208.01 (-5.50 %)
Idea: Long on a breakout above last week's high - bullish momentum continuation.
Entry: Buy stop above last week’s high.
Stop-loss: Below the low of the same candle.
If the weekly candle closes below this level, the trade is invalidated.
Take Profit: Trailing stop following the lows of new weekly candles.
In-depth trading ideas
Morgan Stanley — Bearish Momentum | Short SetupMorgan Stanley is showing a bearish setup as sellers appear to be gaining control around the current structure.
The analysis focuses on weakness in the prevailing move, rejection from key areas, and the possibility of further downside if selling pressure remains active.
The selling idea is based on a defined technical setup with clear risk management and structured execution.
The key focus remains on confirmation, controlled risk, and allowing the setup to develop according to the planned methodology rather than reacting to short-term market noise.
Bias: Selling / Bearish
Focus: Downside Opportunity
Approach: Structured Technical Analysis & Risk Management
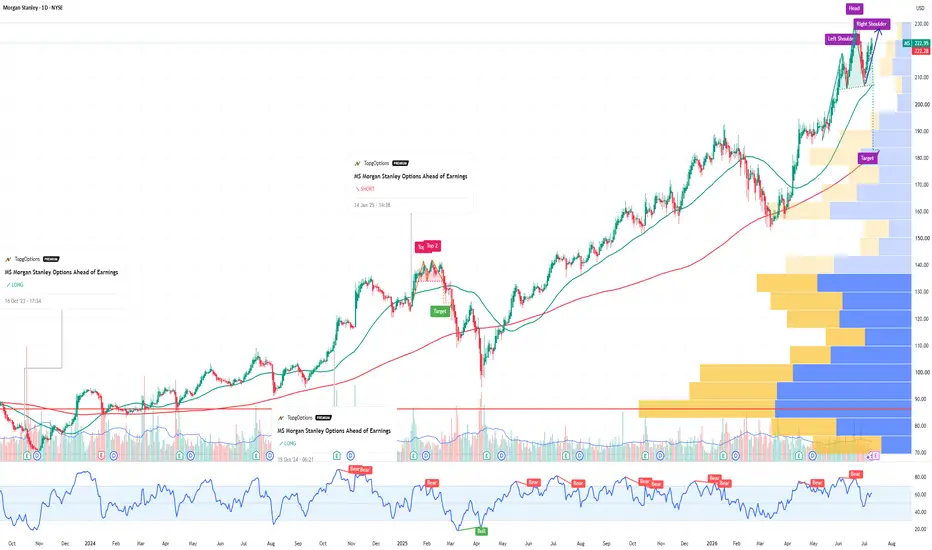
MS Morgan Stanley Options Ahead of EarningsIf you haven`t bought MS before the rally:
Now analyzing the options chain and the chart patterns of MS Morgan Stanley prior to the earnings report this week,
I would consider purchasing the 225usd strike price Calls with
an expiration date of 2026-7-17,
for a premium of approximately $4.25.
If these options prove to be profitable prior to the earnings release, I would sell at least half of them.
Morgan Stanley Pullback Creates a Buying OpportunityMS is attracting buying interest following a healthy retracement. The stock remains in a confirmed uptrend, characterized by higher highs and higher lows, while trading above its well-aligned 20-day and 50-day moving averages.
Morgan Stanley is a $343.96 billion market capitalization global financial services company that provides investment banking, wealth management, and investment management services to corporations, governments, financial institutions, and individuals. The company operates through three segments: Institutional Securities, Wealth Management, and Investment Management. The Institutional Securities segment delivers financial advisory, capital raising, and financing solutions to institutional clients. The Wealth Management segment offers brokerage and investment advisory services across a broad range of asset classes, including equities, fixed income, mutual funds, alternative investments, and managed accounts. The Investment Management segment provides institutional and retail clients with equity, fixed income, alternative investment, real estate, and merchant banking strategies.
MS is a wide economic moat company that has delivered consistent revenue and earnings per share (EPS) growth over the last three quarters. The company maintains strong profitability, with an operating margin of 34% and a net margin of 27%, while generating a return on equity (ROE) of 16% and a return on invested capital (ROIC) of 4%. It also has a current ratio of 1.4x and a debt-to-equity ratio of 4.7x, reflecting the higher leverage that is typical of large, diversified financial institutions.
Morgan Stanley Wave Analysis – 7 July 2026- Morgan Stanley reversed from support zone
- Likely to rise to resistance level 228.65
Morgan Stanley reversed from the support zone between the pivotal support level 206.40 (which stopped earlier correction ii), lower daily Bollinger Band and the 50% Fibonacci correction of the upward impulse from the end of April.
The upward reversal from this support area started the active short-term impulse wave iii which belongs to the impulse waves 3 and (C).
Given the clear daily uptrend, Morgan Stanley can be expected to rise to the next resistance level 228.65 (which stopped earlier impulse wave i in June).
Bullish Setup: Swing Trading Opportunity Following MSMorgan Stanley's bullish stance aligns with the current technical setup. The stock is breaking out of a consolidation range with improving volume and momentum. A close above resistance could trigger a swing move toward the next supply zone.
#MorganStanley #MS #SwingTrading #BullishSetup #Breakout #TechnicalAnalysis #WallStreet
Morgan Stanley: Institutional Crypto Push Could Lift MS This WeeCurrent Price: 190.17 (Analysis was generated on Monday Morning)
Direction: LONG
Confidence level: 42%(Very limited direct trader discussion and low social volume, but the available professional trader commentary about Morgan Stanley offering Bitcoin exposure to clients suggests growing institutional demand, which leans bullish for the stock.)
Targets
Target 1: 195.90
Target 2: 199.70
Stop Levels
Stop 1: 186.40
Stop 2: 182.60
Key Insights:
Here's what's driving this setup. Several professional traders recently pointed out that Morgan Stanley has begun actively selling Bitcoin exposure to its clients. That might sound like a crypto headline, but the bigger story is institutional adoption. When a major investment bank integrates crypto access for clients, it signals new revenue streams and stronger positioning in digital assets.
The second piece is positioning. Large banks moving into crypto services often attract new high‑net‑worth and institutional clients who want regulated access to digital assets. Morgan Stanley already has one of the strongest wealth management platforms globally, so expanding crypto offerings could deepen client engagement and boost fee income.
Finally, the market tends to reward early movers in institutional finance. We're seeing multiple banks exploring digital asset services, but Morgan Stanley has historically been among the first large banks to offer such exposure to clients. That kind of positioning often leads to short‑term sentiment boosts.
Recent Performance:
Morgan Stanley is currently trading around $190.17 after a strong multi‑month run in the financial sector. U.S. equities overall remain strong, with the Nasdaq and S&P 500 recently hitting fresh highs. Banking stocks have been benefiting from stable interest rates, healthy capital markets activity, and renewed appetite for risk assets like crypto and tech.
Short‑term price action shows MS consolidating just below the psychological $200 level. That kind of consolidation often acts as a staging area before a push higher if buyers stay active.
Expert Analysis:
Several professional traders I tracked emphasized the strategic importance of Morgan Stanley's crypto integration. The key takeaway from trader discussions is that the bank isn't just experimenting—it’s actively facilitating Bitcoin exposure for clients.
That matters because financial institutions typically move slowly with new asset classes. When a bank like Morgan Stanley steps in aggressively, traders often interpret it as confirmation that demand from wealthy clients is already strong.
Another point traders highlighted is that institutional flows into crypto frequently spill over into equities tied to the ecosystem—banks, exchanges, and infrastructure providers. Morgan Stanley sits right in that flow.
News Impact:
Recent market news reinforces this theme. Institutional investors continue increasing exposure to digital assets while Bitcoin trades near the $80K region. At the same time, macro conditions remain supportive for risk assets. Stable interest rates and strong equity momentum create an environment where financial stocks tied to innovation tend to outperform.
Morgan Stanley expanding crypto services fits perfectly into that narrative. The market often reacts positively when traditional finance and digital assets start merging.
Trading Recommendation:
Here's my take. The combination of institutional crypto adoption and strong equity market momentum makes Morgan Stanley a reasonable short‑term long trade this week. I'm watching for a push toward the $196 area first, with a possible extension toward $200 if bullish momentum builds.
Risk management matters though. If price slips below $186, the bullish setup weakens quickly, which is why the stop levels sit below that support zone.
For traders looking at financial sector momentum and institutional crypto exposure, Morgan Stanley offers an interesting short‑term opportunity.
Morgan Stanley Wave Analysis – 14 April 2026
- Morgan Stanley broke resistance level 177.40
- Likely to rise to resistance level 191.95
Morgan Stanley recently broke the resistance zone between the resistance level 177.40 (former support from January, which has been reversing the price from February) and the resistance trendline from January.
The breakout of the resistance level 177.40 coincided with the breakout of the 61.8% Fibonacci correction of the downward ABC correction from January.
Given the weekly uptrend, Morgan Stanley can be expected to rise toward the next resistance level 191.95, former multi-month high from January.
morgan stanleyTeam,
We are not buying now.
Price is still trading below major descending resistance (R).
As long as we are below R, the structure remains under pressure.
✅ What We Are Waiting For
We only buy if:
Price breaks above the descending resistance (R)
A candle closes clearly above it
We see strength (no immediate rejection wick)
Ideally: a small pullback that holds above R
No breakout = no trade.
🟢 Entry Plan (After Confirmation)
Once price:
Breaks above R
Retests and holds
Live Trade on Morgan Stanley (MS)Live Trade on Morgan Stanley NYSE:MS
The price has entered the demand zone and has shown an excellent reaction to it. Additionally, with confirmation from one of our proprietary trading systems, a buy signal has been issued targeting the specified levels.
Follow proper risk and money management.
This is just my personal view, so please trade based on your own strategy and trading system.
Follow me on TradingView for more analyses and live stock trades.
Morgan Stanley strength above $170 sets up a continuation move:Current Price: 171.15 (Analysis was generated on Monday Morning)
Direction: LONG
Confidence level: 67%(Professional trader insights and X sentiment both lean bullish with price holding above key support, though short-term data volume is limited.)
Targets
Target 1: 176.00
Target 2: 182.00
Stop Levels
Stop 1: 166.00
Stop 2: 160.50
Key Insights:
Here’s what’s driving this setup. Multiple professional traders are focused on MS holding above the mid‑$160s after a strong push higher. The language across trader analysis points to “acceptance above support” and continuation as long as the stock doesn’t lose that base. That’s a classic trend‑following signal rather than a late‑stage blow‑off move.
On the social side, X sentiment is leaning positive despite low tweet volume. What matters more than volume here is direction: the limited but relevant posts are aligned with the traders, focusing on upside continuation and strength relative to financial peers. There’s no dominant fear narrative showing up in real time, which reduces the odds of an abrupt breakdown this week.
Recent Performance:
Morgan Stanley has pushed into the low $170s after a steady multi‑week climb, staying above rising short‑ and medium‑term averages. Pullbacks have been shallow, and buyers keep stepping in before price can retrace meaningfully. That price behavior tells me dip‑buyers are still active rather than distributing into strength.
Expert Analysis:
Several professional traders I’m tracking highlighted the importance of the $165–$166 zone. As long as price holds above that area, they expect higher highs to remain the path of least resistance this week. A few traders also pointed out that momentum indicators remain constructive, suggesting there’s still room for another leg up before any deeper pause.
What caught my attention is that traders aren’t chasing aggressive upside calls. Instead, they’re talking about steady continuation toward the high $170s and low $180s. That kind of measured optimism often plays out better than hype‑driven targets.
News Impact:
Recent macro and banking‑sector news hasn’t introduced fresh downside pressure for MS. With rates, capital markets activity, and large‑bank balance sheets remaining in focus, the absence of negative surprises is quietly supportive. This “no bad news” backdrop helps trends persist, especially for a name with Morgan Stanley’s liquidity and institutional ownership.
Trading Recommendation:
Putting it all together, I’m staying LONG Morgan Stanley for this week. I’m watching $166 closely as my first risk line, with a wider fail‑safe at $160.50. On the upside, a push toward $176 looks realistic, and if momentum carries, $182 is achievable within the next 5–7 trading days. Position sizing should reflect the moderate confidence level, but the trend still favors buyers while price holds above support.
MS Earnings Play: Buy the Dip Before the Gap-Up!MS Earnings Signal | 2026-01-14
Direction: BUY CALLS
Confidence: 78% (High)
Trend: Short-term bullish
Expiry: Jan 16 (2 days)
Earnings Date: Jan 15, 2026
📌 Key Levels
Strike: $177.50 Call
Entry: ~$4.90
Target 1: $7.35 (+50%)
Target 2: $9.80 (+100%)
Stop Loss: $3.43 (-30%)
Position Size: 5% of portfolio
Katy AI predicts a rise from $179.84 → $185–186 into and after earnings
Momentum is strong after a minor -1.59% dip → optimal “buy the dip”
Support around $178, resistance near $181
Positive fundamentals: 100% historical beat rate, strong capital markets performance
PCR 0.79 → institutional bias favors calls
⚠️ Risks
Medium risk due to IV Crush post-earnings
Rising VIX (15.94) → market volatility
Pre-market monitoring required for gap-up
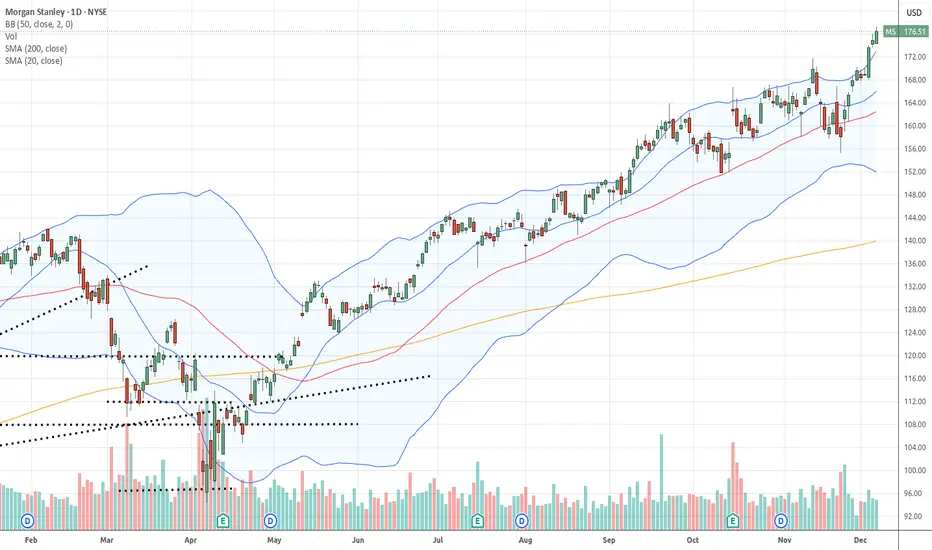
MS Pullback Finds Demand as Bullish Trend Remains IntactMS is currently in a pullback phase, where the formation of a bullish candlestick pattern signals emerging demand. The stock continues to structure higher highs and higher lows, while the 20-, 50-day EMAs are aligned to the upside, with price trading above them. This alignment reinforces the presence of strong bullish momentum despite the near-term consolidation.
Morgan Stanley operates as a globa NYSE:MS l financial services firm, providing investment banking, wealth management, and investment management services to corporations, governments, institutions, and individuals. Its operations are organized across Institutional Securities, Wealth Management, and Investment Management segments.
Fundamentally, MS is a wide economic moat company with a market capitalization of approximately $296.1 billion. The firm has delivered consistent growth in both revenue and EPS over the past four quarters. Profitability has remained stable, with ROE above 13%, ROIC above 3%, and net margins exceeding 5% over the last five quarters. The balance sheet is solid, supported by a current ratio above 1x and a debt-to-equity ratio of about 3.9x, reflecting the capital-intensive nature of large financial institutions while remaining within manageable levels.
Morgan Stanley ETF Platform Hits $10B as Stock Holds BullishMorgan Stanley (NYSE: MS) continues to strengthen its asset management footprint after its Investment Management division (MSIM) announced that its ETF platform has surpassed $10 billion in assets under management. Launched in 2023, the platform has expanded rapidly from six strategies to 18 ETFs, spanning active fixed income, responsible investing, and derivative income solutions.
The milestone highlights growing investor demand for transparent, tax-efficient, and actively managed ETF products, particularly from established global firms.
From a fundamental perspective, the growth of MSIM’s ETF platform is strategically important. ETFs provide scalable, recurring fee-based revenue and deepen client relationships across both institutional and retail channels. With Eaton Vance, Calvert, and Parametric strategies under one umbrella, Morgan Stanley is leveraging its broad investment expertise to compete in a fast-growing segment traditionally dominated by passive players.
As market volatility persists and investors seek diversified income and hedging solutions, MS’s expanding ETF lineup positions the firm for long-term asset growth and earnings stability. This also complements Morgan Stanley’s broader wealth and investment management strategy, which remains a core earnings driver.
Technical Analysis:
The chart shows Morgan Stanley in a clear long-term uptrend, with price trading well above its 50-, 100-, and 200-day moving averages. The stock recently pushed to fresh highs near the $180 area before a modest pullback, suggesting profit-taking rather than trend exhaustion. Former resistance around the $145–$150 zone has flipped into a strong support region, aligning with the rising 50-day moving average.
Momentum remains constructive, and as long as price holds above this support band, the bullish structure stays intact. A consolidation above support could set the stage for another continuation leg higher, while a deeper pullback toward the 100-day average would still be technically healthy within the broader trend.
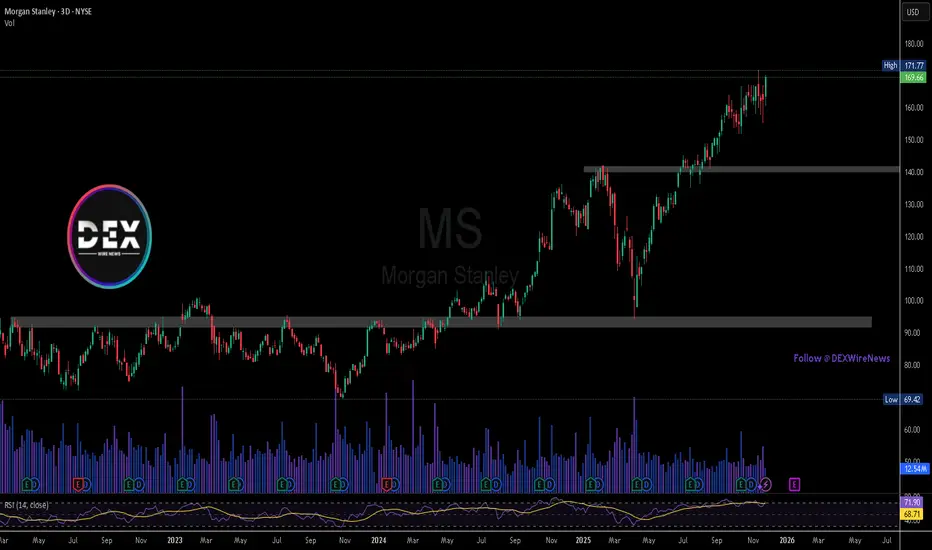
Morgan Stanley (NYSE: $MS) Stock Rises Despite €101M FineMorgan Stanley (NYSE: NYSE:MS ) is gaining momentum in the market despite facing a €101 million fine from the Dutch Public Prosecutor’s Office over historical tax practices. The penalty involves dividend tax evasion tied to structured transactions executed between 2007 and 2012. Authorities stated that the bank filed incorrect returns as part of share acquisition strategies around dividend dates. Morgan Stanley accepted responsibility, repaid withheld taxes and interest by the end of 2024, and agreed to the settlement, closing the long-running case.
Despite regulatory scrutiny, Morgan Stanley continues expanding its presence in digital assets as major financial institutions deepen their crypto offerings. JPMorgan is preparing to accept Bitcoin and Ether as collateral for institutional loans by year-end, marking a significant shift toward wider blockchain integration in traditional finance. The bank already allows collateralization using crypto-linked ETFs, signaling rising comfort with token-backed financial products.
Broad adoption is accelerating as more banks commit to serving the growing digital asset market. Morgan Stanley plans to enable E*Trade clients to access cryptocurrencies next year, strengthening its strategic position as demand increases. Other major institutions—including State Street, BNY Mellon, Fidelity, and BlackRock—remain active through custody services, tokenization initiatives, and ETF support. Increasing regulatory clarity in the U.S. has encouraged firms to expand beyond basic crypto custody and move toward trading, advisory, and collateral services.
While the sector continues facing compliance challenges, investor appetite for blockchain-linked products is rising. Morgan Stanley’s stock has maintained positive momentum as investors look beyond penalties and focus on its growing role in digital finance.
Technical Outlook
The stock maintains an overall bullish structure, having broken above a key horizontal resistance at $141, which now acts as support. If price retraces, $141 remains the critical level to watch.
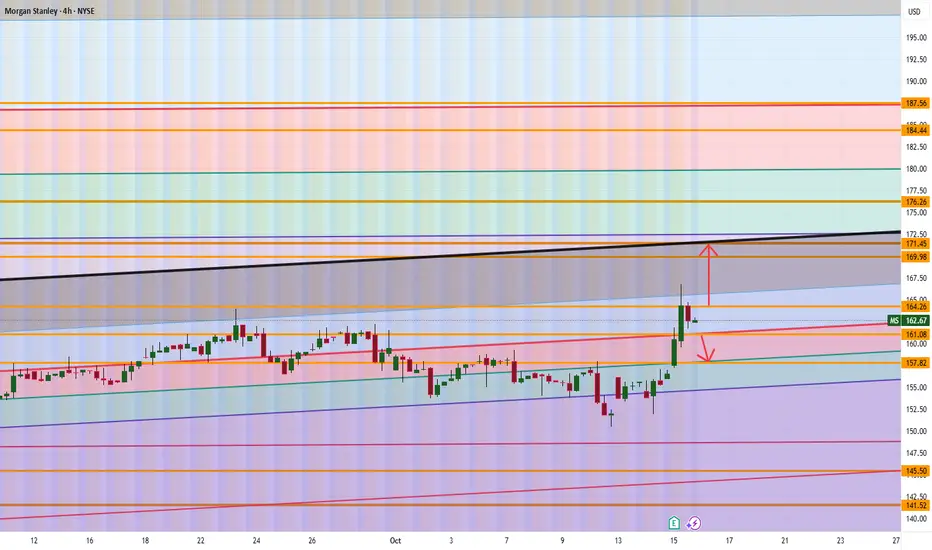
Morgan Stanley (MS) Simple Market Breakdown!MS is sitting at an important level right now; it’s getting ready to make its next big move 📊
Here’s what I’m watching:
📈 If we can close above 164.26, the next push could take us up toward 169–171 before hitting any major resistance.
📉 But if we drop below 161, then a move down toward 157.80 makes sense as the next target zone.
💡 In short: it’s all about which side breaks first; above 164.26 = bullish move 🔼, below 161 = bearish pressure 🔽.
Want to see how I’m planning around these levels and what confirmations I’m looking for before entering a position?
💬 DM me “MS” and I’ll share my full chart setup directly.
Mindbloome Exchange
Trade Smarter Live Better
MS eyes on $166.13: Genesis fib may give DIP to buy the SURGEMS got a massive bump up from earnings report.
It has just smacked into a Genesis fib at $166.13
Look for a Dip-to-Fib ($162.19) or Break-n-Retest.
.
Previous Trade that caught a PERFECT BREAKOUT
Which gave us a 22% gain:
.
Hit BOOST and FOLLOW for more such PRECISE and TIMELY charts.
=========================================================
.
Pullback in Morgan StanleyMorgan Stanley recently hit a new high, and now it’s pulled back.
The first pattern on today’s chart is the advance between September 5 and September 23. MS retraced half that move before bouncing, which may confirm its direction remains to the upside.
Second, prices held the rising 21-day exponential moving average (EMA). The 8-day EMA has also stayed above the 21-day EMA. Those signals may be consistent with an uptrend.
Third, Wilder’s Relative Strength Index (RSI) peaked above 76 before dipping toward 50. That may suggest the financial stock worked off an overbought condition and has returned to areas where dip-buyers may feel more comfortable.
Finally, some traders may view the recent pullback as a completed ABC correction, with the potential for the longer-term uptrend to resume.
TradeStation has, for decades, advanced the trading industry, providing access to stocks, options and futures. If you're born to trade, we could be for you. See our Overview for more.
Past performance, whether actual or indicated by historical tests of strategies, is no guarantee of future performance or success. There is a possibility that you may sustain a loss equal to or greater than your entire investment regardless of which asset class you trade (equities, options or futures); therefore, you should not invest or risk money that you cannot afford to lose. Online trading is not suitable for all investors. View the document titled Characteristics and Risks of Standardized Options at www.TradeStation.com . Before trading any asset class, customers must read the relevant risk disclosure statements on www.TradeStation.com . System access and trade placement and execution may be delayed or fail due to market volatility and volume, quote delays, system and software errors, Internet traffic, outages and other factors.
Securities and futures trading is offered to self-directed customers by TradeStation Securities, Inc., a broker-dealer registered with the Securities and Exchange Commission and a futures commission merchant licensed with the Commodity Futures Trading Commission). TradeStation Securities is a member of the Financial Industry Regulatory Authority, the National Futures Association, and a number of exchanges.
TradeStation Securities, Inc. and TradeStation Technologies, Inc. are each wholly owned subsidiaries of TradeStation Group, Inc., both operating, and providing products and services, under the TradeStation brand and trademark. When applying for, or purchasing, accounts, subscriptions, products and services, it is important that you know which company you will be dealing with. Visit www.TradeStation.com for further important information explaining what this means.
A potential break and retest on MS.OptionsMastery:
🔉Sound on!🔉
📣Make sure to watch fullscreen!📣
Thank you as always for watching my videos. I hope that you learned something very educational! Please feel free to like, share, and comment on this post. Remember only risk what you are willing to lose. Trading is very risky but it can change your life!