Oracle: You're Entering A World Of Pain!Primary Scenario
In our primary scenario, we see ORCL in the final major phase of a long-term correction. The completion of a corrective upward move still appears imminent, after which we expect sell-offs down into our regular blue Long-Term Entry Range (coordinates: $73.98–$39.07).
Alternative Scenario
ADJUSTMENTS: In the alternative scenario, ORCL would already turn higher within our alternative blue Long-Term Entry Range (coordinates: $136.88–$124.08) (probability: 30%).
Long-Term Outlook
The daily chart supports our view that ORCL is in a long-term correction, with primary expectations for a decline into our regular blue Long-Term Entry Range (coordinates: $73.98–$39.07). From there, the stock is expected to see significant advances and break through resistance at $250.25 and $345.72. The chart also highlights the potential impact of our alternative scenario: in this case, price would rise above resistance at $250.25 without setting new lows in the regular blue entry range, forming another higher corrective top (still below the $345.72 level) before further sell-offs could be expected (probability: 30%).
Oracle Corporation Depositary Shares, each representing a 1/2,000th interest in a sh of 6.50% Series D Mandatory Convertible Preferred Stock
No trades
No trades
In-depth trading ideas
Oracle - Preparing another +50% bullrun!🔮Oracle ( NYSE:ORCL ) just retested pretty strong support:
🔎Analysis summary:
For the past two years, Oracle has just been consolidating within its underlying uptrend. And looking at the higher timeframe, Oracle still nicely respected all structure. With the recent retest of major support, Oracle could once again rally +50% towards the upside.
📝Levels to watch:
$130 and $220
Keep your #LONGTERMVISION🙏
— Phil (@TheTraderPhil)
Oracle May Have BottomedOracle has struggled for the last year, but there could be signs of the software company bottoming.
The first pattern on today’s chart is the August 6 low near $139. ORCL bounced at that level in mid-August, early September and again this week. Is support confirmed?
Second, the level could represent a higher low compared with July’s trough. Combined with the earlier low in February, some traders may see a long and rounded basing pattern. (See the yellow arrows.)
Third, stochastics are trying to turn up from an oversold condition.
Next, prices bounced at the 50-day simple moving average and are now back above the 21-day exponential moving average.
Finally, ORCL is an active underlier in the options market. (Its average daily volume of 296,200 contracts ranks 12th in the S&P 500, according to TradeStation data.) That could help traders take positions with calls and puts.
TradeStation has, for decades, advanced the trading industry, providing access to stocks, options and futures. If you're born to trade, we could be for you. Learn more here about TradingView’s Broker of the Year!
Past performance, whether actual or indicated by historical tests of strategies, is no guarantee of future performance or success. There is a possibility that you may sustain a loss equal to or greater than your entire investment regardless of which asset class you trade (equities, options or futures); therefore, you should not invest or risk money that you cannot afford to lose. Online trading is not suitable for all investors. View the document titled Characteristics and Risks of Standardized Options at www.TradeStation.com . Before trading any asset class, customers must read the relevant risk disclosure statements on www.TradeStation.com . System access and trade placement and execution may be delayed or fail due to market volatility and volume, quote delays, system and software errors, Internet traffic, outages and other factors.
Securities and futures trading is offered to self-directed customers by TradeStation Securities, Inc., a broker-dealer registered with the Securities and Exchange Commission and a futures commission merchant licensed with the Commodity Futures Trading Commission). TradeStation Securities is a member of the Financial Industry Regulatory Authority, the National Futures Association, and a number of exchanges.
Options trading is not suitable for all investors. Your TradeStation Securities’ account application to trade options will be considered and approved or disapproved based on all relevant factors, including your trading experience. See www.TradeStation.com . Visit www.TradeStation.com for full details on the costs and fees associated with options.
Margin trading involves risks, and it is important that you fully understand those risks before trading on margin. The Margin Disclosure Statement outlines many of those risks, including that you can lose more funds than you deposit in your margin account; your brokerage firm can force the sale of securities in your account; your brokerage firm can sell your securities without contacting you; and you are not entitled to an extension of time on a margin call. Review the Margin Disclosure Statement at www.TradeStation.com .
TradeStation Securities, Inc. and TradeStation Technologies, Inc. are each wholly owned subsidiaries of TradeStation Group, Inc., both operating, and providing products and services, under the TradeStation brand and trademark. When applying for, or purchasing, accounts, subscriptions, products and services, it is important that you know which company you will be dealing with. Visit www.TradeStation.com for further important information explaining what this means.
Oracle’s $664B Backlog: The AI Re-Rating Toward $250+Oracle has quietly become one of the most leveraged public-market bets on the AI infrastructure boom. Fiscal 2026 revenue reached a record $67.4 billion, with cloud infrastructure (IaaS) growing 77% to $18.1 billion; the first quarter of fiscal 2027 then accelerated further, with total revenue up 30% to $19.3 billion and IaaS more than doubling at +121% to $7.4 billion. Remaining performance obligations now sit at $664 billion—nearly ten times trailing annual revenue—after another $30-plus billion of AI contracts were booked in the latest quarter. Management guided fiscal 2027 revenue to at least $90 billion (roughly 34% growth) and non-GAAP EPS to $8.10, giving unusual visibility for a company of this size.
The core of the upside case is conversion of that backlog into recognized, high-utilization revenue as new megawatts come online. Oracle delivered 850 MW of capacity in Q1 alone and is targeting $90–95 billion of capex this year, yet a growing share of the hardware is prepaid or customer-supplied, which reduces the cash drain relative to earlier fears. GPU utilization is running near 98% with renewals occurring at premium pricing, and the OpenAI/Stargate-related commitment (on the order of $300 billion over roughly five years) is only the largest of several large-scale AI training and inference deals. If even a conservative portion of the contracted capacity ramps as planned, cloud infrastructure can become the majority of the company and support a multi-year revenue CAGR in the high-20s to low-30s, with operating leverage appearing once the current build-out cycle matures.
Risks remain real: heavy debt and equity issuance to fund data centers, customer concentration, and the possibility that AI spending growth slows or that power/grid constraints delay sites. Those concerns have already compressed the multiple and produced a large drawdown from the prior highs. Still, the combination of contracted revenue visibility, accelerating IaaS growth, and improving (if still negative) free-cash-flow optics versus earlier expectations is why longer-term models from some analysts point toward $200 billion-plus in revenue by the early 2030s and meaningful EPS compounding if margins on OCI settle in the 30–40% range once utilization and scale are achieved.
Technically, the 8-hour chart shows price sitting near the five-month point of control around current levels after a multi-month range, with a well-defined prior swing high near $250 and a higher target zone in the mid-to-high $200s if the stock can reclaim the $176 area and resume the prior uptrend. The financial trajectory—backlog conversion plus continued triple-digit IaaS growth—is what would most plausibly fuel that kind of re-rating; the chart simply maps the path price would need to travel if the fundamental story continues to deliver.
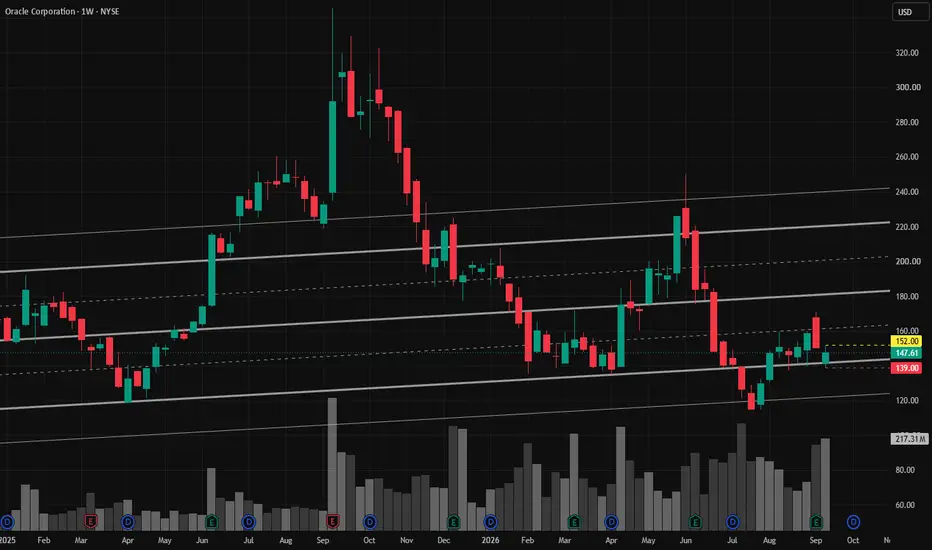
ORCL | Continued stock growth- Timeframe: Weekly
- Trade type: Buy stop order
- Price: 152.00
- Take Profit: Open
- Stop Loss: 139.00 (-8.60 %)
Idea: Long on a breakout above last week's high - bullish momentum continuation.
Entry: Buy stop above last week’s high.
Stop-loss: Below the low of the same candle.
If the weekly candle closes below this level, the trade is invalidated.
ORACLE, has the bottom been reached?Oracle’s share price lost more than 66% between its all-time high in September 2025 and its low point in July 2026.
Can we now say that the stock has finally formed a major bottom and that the underlying bullish trend has resumed?
To answer this question, I will review the fundamental and technical factors that I consider relevant:
· Fundamental technical analysis of financial markets: the long-term signals on the weekly chart
· Stock valuation data and the fundamental outlook for Oracle
From a fundamental perspective, the Oracle story remains particularly interesting. The company is undergoing a major transformation, with a spectacular acceleration in its cloud business. In the fourth quarter of fiscal year 2026, cloud revenue increased by 47% year-on-year and cloud infrastructure revenue by 93%. For the full fiscal year, revenue increased by 17%, while cloud revenue rose by 39%.
Even more impressive, Remaining Performance Obligations (RPO) reached $638 billion, up 363% year-on-year. This figure represents a major fundamental argument in favor of continued future growth.
The main risk, however, lies in how this growth is being financed. Oracle is investing heavily in infrastructure dedicated to artificial intelligence, which resulted in negative free cash flow of $23.7 billion in fiscal 2026 and significant reliance on debt financing.
The table below ranks US companies in the infrastructure software sector according to their forward P/E valuation ratio. After this 60% decline from its all-time high, Oracle’s stock is once again inexpensive according to this fundamental valuation metric.
Finally, the valuation now appears much less demanding than it was at the 2025 peak. According to the market data used here, the forward P/E stands at around 15x, which is particularly low for a company whose cloud growth prospects remain so strong.
To conclude from a technical analysis perspective, several signals are favorable for the formation of a major bottom: bullish price/momentum divergences on the weekly timeframe (see the main chart of this analysis), as well as long-term technical support levels that were reached between $110 and $120, including the 200-week moving average and the monthly Kumo of the Ichimoku system.
The chart below shows the monthly Japanese candlesticks of ORACLE stock together with the monthly Kumo (Ichimoku system), which is acting as long-term support.
DISCLAIMER:
This content is intended for individuals who are familiar with financial markets and instruments and is for information purposes only. The presented idea (including market commentary, market data and observations) is not a work product of any research department of Swissquote or its affiliates. This material is intended to highlight market action and does not constitute investment, legal or tax advice. If you are a retail investor or lack experience in trading complex financial products, it is advisable to seek professional advice from licensed advisor before making any financial decisions.
This content is not intended to manipulate the market or encourage any specific financial behavior.
Swissquote makes no representation or warranty as to the quality, completeness, accuracy, comprehensiveness or non-infringement of such content. The views expressed are those of the consultant and are provided for educational purposes only. Any information provided relating to a product or market should not be construed as recommending an investment strategy or transaction. Past performance is not a guarantee of future results.
Swissquote and its employees and representatives shall in no event be held liable for any damages or losses arising directly or indirectly from decisions made on the basis of this content.
The use of any third-party brands or trademarks is for information only and does not imply endorsement by Swissquote, or that the trademark owner has authorised Swissquote to promote its products or services.
Swissquote is the marketing brand for the activities of Swissquote Bank Ltd (Switzerland) regulated by FINMA, Swissquote Capital Markets Limited regulated by CySEC (Cyprus), Swissquote Bank Europe SA (Luxembourg) regulated by the CSSF, Swissquote Ltd (UK) regulated by the FCA, Swissquote Financial Services (Malta) Ltd regulated by the Malta Financial Services Authority, Swissquote MEA Ltd. (UAE) regulated by the Dubai Financial Services Authority, Swissquote Pte Ltd (Singapore) regulated by the Monetary Authority of Singapore, Swissquote Asia Limited (Hong Kong) licensed by the Hong Kong Securities and Futures Commission (SFC) and Swissquote South Africa (Pty) Ltd supervised by the FSCA.
Products and services of Swissquote are only intended for those permitted to receive them under local law.
All investments carry a degree of risk. The risk of loss in trading or holding financial instruments can be substantial. The value of financial instruments, including but not limited to stocks, bonds, cryptocurrencies, and other assets, can fluctuate both upwards and downwards. There is a significant risk of financial loss when buying, selling, holding, staking, or investing in these instruments. SQBE makes no recommendations regarding any specific investment, transaction, or the use of any particular investment strategy.
CFDs are complex instruments and come with a high risk of losing money rapidly due to leverage. The vast majority of retail client accounts suffer capital losses when trading in CFDs. You should consider whether you understand how CFDs work and whether you can afford to take the high risk of losing your money.
Digital Assets are unregulated in most countries and consumer protection rules may not apply. As highly volatile speculative investments, Digital Assets are not suitable for investors without a high-risk tolerance. Make sure you understand each Digital Asset before you trade.
Cryptocurrencies are not considered legal tender in some jurisdictions and are subject to regulatory uncertainties.
The use of Internet-based systems can involve high risks, including, but not limited to, fraud, cyber-attacks, network and communication failures, as well as identity theft and phishing attacks related to crypto-assets.
Is ORACLE About to Surprise on Earnings? The market has been quite choppy recently, largely due to fluctuations in Treasury yields and shifting expectations around the path of interest rates. Despite the broader uncertainty, the software sector has staged a meaningful recovery over the past few months. Oracle (ORCL), however, has continued to lag behind many of its peers and is currently trading near the lower end of its broader fair value range.
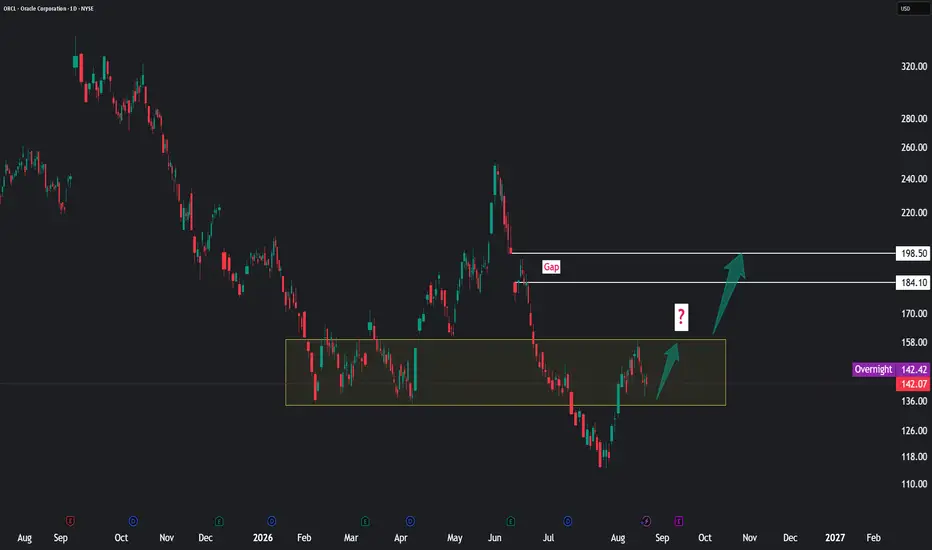
From a technical perspective, there are a few recent developments that make the current setup particularly interesting. ORCL swept the previous range low while simultaneously testing the range Value Area Low (VAL) — an area that has historically represented a discounted valuation zone for the stock over the past two years.
Since then, price has managed to reclaim the most traded zone highlighted in yellow, otherwise known as the Point of Control (POC). This is an important development, as acceptance back above the POC increases the probability of price rotating through the range toward the opposite side of the value range. In this case, that creates a potential path toward the Value Area High, which currently sits around the $195–$200 region.
Fundamentally, Oracle has also performed well over the last three quarters. If the company can maintain that momentum, the upcoming earnings report could serve as a catalyst for the stock to begin closing some of the performance gap between ORCL and the broader software sector.
At current levels, I like the risk-to-reward profile for a potential swing trade, with my primary target sitting around $195–$200. That area represents the first major upside objective and would be an important zone to reassess price action.
If ORCL can break through and establish acceptance above the $200 region, the setup becomes considerably more interesting. From there, I would be watching for a potential continuation toward the next major pivot around $250, followed ultimately by a possible retest of the all-time highs.
For now, the thesis is relatively straightforward: ORCL has swept the lower end of its range, tested an area of historical value, and reclaimed the Point of Control while the broader software sector continues to recover. The next step is seeing whether buyers can maintain that reclaim and begin pushing price toward the upper end of the range.
Let’s see how the setup develops over the next week!
Larry Ellison cancels $7.5 billion sale of Oracle stock!Larry Ellison Cancels Planned $7.5 Billion Sale of Oracle Stock
Oracle co-founder and executive chairman Larry Ellison has canceled a previously announced plan to sell a large block of his Oracle shares, the company confirmed on Saturday. The decision marks a notable reversal for one of the tech industry's most prominent billionaires and comes at a time when Oracle's stock has been under considerable pressure.
The Original Plan
Oracle had previously disclosed in a regulatory filing that Ellison intended to sell 50 million shares of Oracle stock, a transaction valued at approximately $7.5 billion, according to Reuters. A sale of that magnitude would have represented one of the largest insider stock sales of the year and would have significantly reduced Ellison's stake in the company he co-founded.
The Cancellation
The company announced on Saturday that the planned sale has been scrapped entirely. According to Oracle, no Oracle stock was sold under that plan, and Ellison has no other plans to sell any of his Oracle stock. The company did not offer a specific reason for the change in plans, leaving investors and analysts to speculate about the motivations behind the decision.
Oracle's Struggling Stock Performance
The cancellation comes as Oracle stock is currently down 22% since the beginning of the year, reflecting broader investor concerns about the company's aggressive spending and shifting strategic priorities. The decline has weighed on Oracle's market valuation and has raised questions about the company's near-term financial outlook.
Heavy Spending on Data Centers
Oracle has been spending heavily on data centers as part of its effort to compete in the rapidly expanding cloud infrastructure and artificial intelligence markets. These investments are substantial and have put pressure on the company's margins and free cash flow, contributing to the stock's weak performance this year. The company has positioned itself as a major player in AI infrastructure, but the costs associated with that ambition are significant.
TikTok Partnership
In a notable strategic development, Oracle recently became one of the major owners and security partners for TikTok's U.S. operations. This arrangement has given Oracle a high-profile role in one of the most closely watched technology and national security stories in recent years, further cementing its position as a key player in the U.S. tech landscape.
Ellison's Broader Business Interests
Beyond Oracle, Ellison has also used his substantial wealth to back his son David's acquisition of Warner Bros. That deal is currently being contested in court, adding another layer of complexity to the Ellison family's business dealings. The outcome of that legal battle could have implications for the family's broader investment strategy and financial commitments.
What This Means for Investors
The cancellation of the $7.5 billion stock sale could be interpreted in several ways. On one hand, it may signal Ellison's continued confidence in Oracle's long-term prospects despite the recent stock decline. On the other hand, it could reflect a desire to avoid selling into a weakened market or to preserve his position amid ongoing strategic initiatives.
For investors, the key takeaway is that Ellison remains heavily invested in Oracle and has chosen not to reduce his exposure at this time. Whether that decision reflects conviction, timing considerations, or other factors remains unclear, but it does remove a potential source of selling pressure that could have weighed further on the stock.
ORCL | The time to go long has come- Timeframe: Weekly
- Trade type: Buy stop order
- Price: 150.40
- Take Profit: Open
- Stop Loss: 137.43 (-8.60 %)
Idea: Long on a breakout above last week's high - bullish momentum continuation.
Entry: Buy stop above last week’s high.
Stop-loss: Below the low of the same candle.
If the weekly candle closes below this level, the trade is invalidated.
Take Profit: Trailing stop following the lows of new weekly candles.
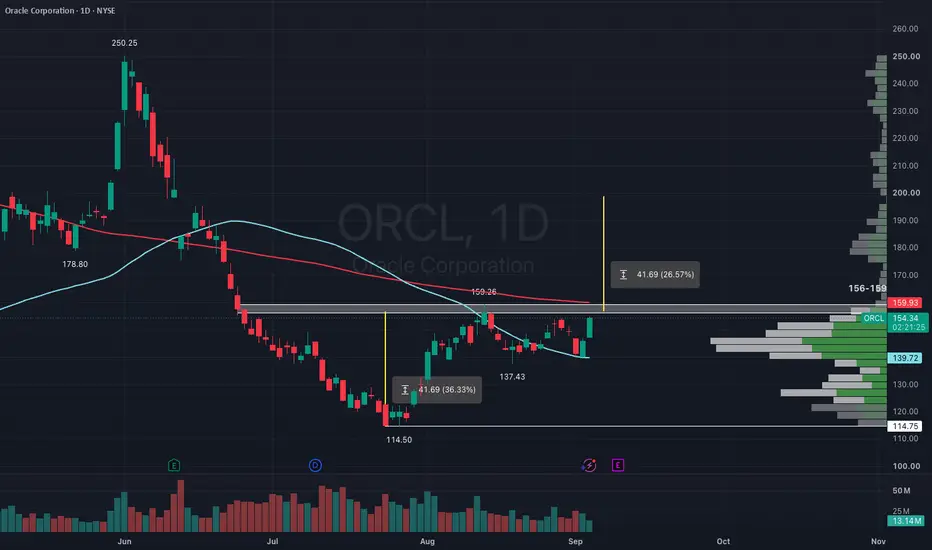
ORCL — Relief Rally Stalls Below Major ResistanceOracle closed at $142.07 on August 20, 2026. The stock has recovered strongly from the $114.50 low, but the rebound was rejected at $159.26 and has now entered a consolidation phase.
The short-term picture is neutral, while the broader daily trend remains bearish. Price is sitting near the 20-day EMA at $142.92, but remains below the 50-day SMA at $146.52, the 100-day SMA at $164.37, and the 200-day SMA at $173.63. TradingView’s broader moving-average rating also remains bearish. TradingView technical summary
RSI is neutral at approximately 48.8, while MACD remains above its signal line. This suggests that some rebound momentum is still present, but buyers have not yet regained control. With a daily ATR near $7.11, volatility remains elevated.
Key resistance levels
- $146.50–$148.70: immediate resistance and 50-day SMA area
- $152.00–$159.26: major supply zone and recent swing high
- $164.40–$173.60: long-term moving-average resistance
Key support levels
- $141.00–$137.40: immediate support zone
- $128.80–$125.00: secondary support
- $120.00–$114.50: major demand zone and structural low
Bullish scenario
A daily close above $148.70 would improve the short-term structure and could trigger a move toward $152.00, followed by $159.26.
A sustained breakout above $159.26 would provide stronger trend-reversal confirmation, opening the way toward $164.40 and potentially $173.60.
Bearish scenario
A daily close below $137.40 would invalidate the immediate recovery attempt and expose $128.80–$125.00.
If that zone fails, the market could revisit $120.00 and the major $114.50 low. A breakdown below $114.50 would confirm the continuation of the broader bearish structure.
Fundamental context
Oracle’s cloud growth remains impressive: FY2026 cloud revenue increased 39%, while remaining performance obligations reached $638 billion. However, the company also reported negative $23.7 billion in free cash flow, reflecting the enormous investment required to expand its AI infrastructure. Oracle FY2026 results
Conclusion
ORCL is attempting to build a base, but the rebound is not yet a confirmed trend reversal. The decisive range is now $137.40–$148.70:
- Above $148.70: bullish recovery gains credibility.
- Above $159.26: broader reversal confirmation.
- Below $137.40: bearish continuation risk returns.
This analysis reflects a personal market view and is not financial advice.
Share your thoughts in the comments section of the title. I'm interested in hearing your opinion on this topic.
Thank you in advance.
Laurent
✅ DL INVEST | Community Leader
Oracle's mounting debt spark investor skepticismORCL | 4H Technical Analysis — Sep 14, 2026
Oracle whipsawed sharply after its fiscal Q1 earnings release, initially spiking as much as 10.3% intraday before reversing to close down 1.74% at 150.28, leaving the stock down 4.39% over the past two years despite the headline growth numbers. The reversal reflects a genuinely split earnings picture. Revenue grew roughly 30% YoY, and the core cloud infrastructure business surged 121%, with remaining performance obligations reaching $664 billion at quarter-end after more than $30 billion in new contracts signed during the quarter alone. On the surface, this confirms Oracle's transformation into a serious cloud infrastructure competitor.
The cost of that growth is what spooked the market on the reversal. Oracle poured $28.5 billion into capital expenditures last quarter, more than triple the prior year's pace, pushing free cash flow to negative $5.4 billion. Total debt has climbed to roughly $156 billion, and gross margin compressed to 61% from 66.3% the previous quarter. The debt chart shows this is not a one-quarter anomaly. Oracle's total debt has roughly doubled since Q4 2024, a direct byproduct of the aggressive infrastructure buildout needed to service its cloud contract backlog.
ORCL spent January through April consolidating in a wide 140 to 170 range before a sharp cloud-driven rally in May and June pushed price to a high near 250. That spike proved unsustainable, and price fell hard through July to a low near 115, effectively unwinding the entire cloud euphoria rally. Since that July low, price has climbed steadily inside a well-defined ascending channel, reclaiming the 140 to 170 range and now trading around 150, back inside the same box that contained price for the first four months of the year.
The EMA cross shows the fast EMA at 153.33 just above the slow EMA at 149.13, a mildly bullish but tightly compressed setup that reflects the current indecision. RSI at 46.56 sits almost exactly at the midpoint, offering no directional edge either way. Price is currently pressing against the lower boundary of the old range near 150, the same level where the two-year chart shows Oracle essentially unchanged despite the intervening volatility.
Key levels to watch:
Resistance: 170 (top of multi-month range) / 200 (psychological level, June retracement zone)
Support: 140 (bottom of multi-month range) / 115 (July swing low)
Bear case: The margin compression from 66.3% to 61%, negative free cash flow, and debt load nearly doubling in under two years suggest Oracle is buying growth at a steep financial cost, and the earnings day reversal from plus 10% to a net loss shows the market is already uneasy about that trade-off. A break below the ascending trendline and the 140 range floor would confirm the growth story is losing credibility with investors and open a retest of the 115 July low.
Bull case: The underlying growth numbers, 121% cloud infrastructure growth and a $664 billion order backlog, are difficult to dismiss, and if Oracle can show the capex spending translates into sustained revenue conversion in coming quarters, the current pullback becomes a buying opportunity within the still-intact ascending channel. A reclaim of 170 would resume the broader uptrend from the July low.
Bias is neutral to cautiously bullish while price holds above the ascending trendline near 140, with the market currently undecided on whether Oracle's cloud growth justifies its deteriorating margins and ballooning debt. The earnings-day reversal is the key signal here. Strong headline numbers weren't enough to hold gains once investors examined the balance sheet details, and that skepticism needs to clear before the stock can push convincingly back toward 170 and beyond.
ORCL: Record $664B Backlog, Negative FCF — Wait for $138–147ORACLE (ORCL) — HOLD 54/100 · Data as of Sep 11, 2026 close ($150.28)
Record quarter, rejected by the market. Q1 FY27: RPO $664B (+$209B YoY), OCI revenue +121%, total revenue $19.3B (+30%). The stock gapped up 7.5% and reversed 10% intraday. Why: FY27 EPS guidance ($8.10) only matched consensus ($8.05), trailing free cash flow is −$23.7B, and ~$20B of stock was sold through an at-the-market program (~4.5% dilution in one quarter).
THE PLAN
• New position: don't buy today. Conditional buy zone $138–147, only with confirmation (hourly MACD turning up).
• Stop: daily close below $129.50.
• Take-profit 1: $170–184 · Take-profit 2: $200–215.
• My fair-value band: $165–200 (midpoint $182). Risk/reward from the zone: 2.65 : 1.
• Scale-in if triggered: 40% / 35% / 25%.
THREE GATES — 2 of 3 passed
✅ Valuation: forward P/E 18.6x, PEG 0.92.
✅ Thesis: backlog is real; cash conversion is not proven yet.
❌ Entry: price is 10.4% below the 200-day SMA ($167.64); hourly MACD negative.
WHAT ACTUALLY MOVED THE PRICE (12 months, $232.80 → $150.27)
Nine major events add up to −$40.6. The other −$41.9 is drift between events — only half of the decline can be tied to a headline.
Story events were all given back: RPO reveal +$59.4, new AI contracts +$36.9, second peak attempt +$41.7.
Cash events stuck: financing concerns −$24.1, Q2 revenue miss −$27.6, negative FCF revealed −$99.3 (largest single hit).
INSIDERS
• Zero open-market buys in the last 12 months — checked against raw SEC Form 4 XML (49 filings), Alpha Vantage, Massive and Dataroma.
• 30 sales, $140.2M. 14 of them ($45.2M) were NOT under 10b5-1 plans, led by the CEO.
• The last two insider buys (Jul 2025 at $233.87, Feb 2025 at $172.35) are both underwater, and neither buyer averaged down.
• Larry Ellison: the 10-Q disclosed a 10b5-1 plan (adopted Jun 22) to sell up to 50M shares (~$7.5B). On Sep 12 Oracle announced it was cancelled with no shares sold.
ANALYSTS vs PRICE
• 45 analysts: 36 Buy / 8 Hold / 1 Sell, average target $243.97.
• But the MarketBeat consensus target fell from $297 to $256 over 12 months while the stock fell 48.6% — most of the "upside" is stale targets, not new conviction.
• EPS estimates are rising: FY27 $8.04 → $8.13, 3 upward / 0 downward revisions in 30 days. The problem is trust, not earnings.
• Lowest target: CLSA $145 (Hold), below today's price.
SENTIMENT SPLIT
Retail (Stocktwits) 91/100 extremely bullish vs. Danelfin's AI model 3/10. TradingView ideas this week: 4 long / 3 short / 3 neutral.
DECISION TREE
Price reaches $147 → Is the thesis broken (another equity raise, RPO decline)?
• Yes → don't buy, wait for the Dec 9 earnings.
• No → trend check: decline continuing → wait; decline stopped and confirmed → scale in.
KEY DATE: Dec 9, 2026 — Q2 FY27 earnings (EPS guide $1.85–1.93). The next durable move up needs improving free cash flow, not another contract headline.
What would change my view: a daily close below $129.50 (bearish) · positive FCF trend or the ATM program ending (bullish).
Not financial advice. Personal analysis for educational purposes.
Oracle’s AI Growth Is Real. But Can It Turn Spending Into Cash?Key Points
1. Oracle’s AI cloud business is growing fast, but its spending is growing even faster.
2. Negative free cash flow and rising debt remain the biggest risks for investors.
3. The stock looks cheaper after the selloff, but Oracle still needs to prove its AI spending can turn into real cash.
Oracle has a real AI growth story. The problem is that the company is spending a huge amount of money to build it, and investors are still waiting to see whether that spending will translate into stronger cash flow.
Oracle’s capital spending jumped about 163% to $55.7 billion in fiscal 2026. The company expects to spend another $90 billion to $95 billion in fiscal 2027. That is a massive increase, and it is one of the main reasons investors have become more cautious about the stock.
The AI demand itself is not the problem. Oracle Cloud Infrastructure is growing quickly as companies need more capacity for AI workloads. OCI revenue jumped 121% year over year in the latest quarter, while Oracle also reported more than $30 billion in new AI contracts.
The concern is what happens to the cash. Oracle generated $23.1 billion in operating cash flow, but free cash flow was still negative $5.4 billion because of its heavy infrastructure spending. The company is also taking on more debt to fund the expansion.
Wall Street is split. Morgan Stanley remains cautious with an Equal-weight rating and a $210 price target. Jefferies is more bullish, maintaining a Buy rating with a $290 target. BMO recently lowered its target to $195 while keeping an Outperform rating, pointing to pressure on gross margins and weaker SaaS growth.
Oracle co-founder and executive chairman Larry Ellison has canceled a plan to sell up to 50 million shares, a move that could signal he remains confident in the company’s long-term prospects.
At around $150, Oracle has already fallen 54% from its 52-week high. That makes the stock interesting from a contrarian view, but I would not ignore the cash-flow problem. The bullish case depends on Oracle turning its huge AI backlog into revenue and eventually into cash. Until that happens, ORCL could remain volatile.
Bullish / Event-driven momentumOracle reported adjusted EPS of $1.92 and record quarterly revenue of $19.35bn, +30% YoY. More importantly, cloud infrastructure revenue more than doubled, while remaining performance obligations/backlog reached roughly $664bn. Management also guided current-quarter revenue growth to 30–34% and expects at least $90bn of full-year revenue.
For me, the key point isn't simply the earnings beat. The results provide evidence that Oracle's enormous AI infrastructure spending is actually translating into revenue and contracted demand. That addresses one of the market's biggest concerns around the AI capex cycle. Reuters specifically notes that the results reassured investors that Oracle's AI investments are generating returns.
The setup isn't risk-free. August CPI came in at +0.4% MoM / +3.4% YoY, pushing the probability of a Fed hike next week to roughly 85%, while the U.S. 10-year Treasury yield briefly approached 5%. High-duration technology stocks therefore remain vulnerable to further yield expansion.
ORCL: Investors Are Starting to Price the Cost of Growth?Oracle will report fiscal Q1 2027 earnings after the market close on September 10. Over the past year, ORCL has shifted from one of the market’s favorite AI infrastructure trades to a much more controversial name. Demand is no longer the main question. With RPO reaching $638 billion, customers are clearly committing to Oracle’s computing capacity. The key issue is how much Oracle must spend to convert those contracts into revenue and whether that growth can eventually generate enough free cash flow.
Fundamentals
Last quarter, Oracle’s revenue rose 21% year over year, while cloud revenue grew 47% and OCI infrastructure revenue surged 93%. Management guided for fiscal Q1 revenue growth of 27%–29%, cloud revenue growth of 58%–64%, and non-GAAP EPS of $1.72–$1.76. Wall Street expects revenue of roughly $19.1 billion and EPS near $1.74. Oracle is also maintaining its fiscal 2027 revenue target of around $90 billion.
The challenge is that growth is becoming increasingly capital-intensive. Oracle generated roughly negative $23.7 billion in free cash flow in fiscal 2026 and raised about $48 billion in financing. It also expects to raise roughly another $40 billion through debt and equity in fiscal 2027.
This creates the core tension in the Oracle story. Higher RPO improves long-term revenue visibility, but it also requires more data centers, power, and infrastructure spending today. Investors therefore need to see OCI remain strong while CapEx, financing needs, and cash-flow pressure begin to stabilize.
Technicals
ORCL is trading near the $160 area, more than 50% below its 2025 peak and down roughly 20% year to date. Much of the valuation premium attached to the earlier AI trade has already been compressed.
The first major upside level is around $170. A sustained move above that zone after earnings could confirm a broader recovery and open the door toward $180.
On the downside, $155 remains an important support area. A decisive break below that level would suggest that the market is still focused on financing and cash-flow risks, with the $145 area potentially becoming the next major support.
Flows
Positioning reflects a mix of long-term optimism and short-term caution. Most analysts remain constructive on Oracle’s long-term cloud and AI opportunity, but price targets vary widely. Some firms still see major upside, while others have become more conservative as concerns around CapEx, debt issuance, and funding costs increase.
That divergence shows how the debate has changed. Investors are no longer asking whether Oracle can grow. They are asking how much that growth should be worth given the capital required to support it.
The options market is pricing in roughly an 11% post-earnings move, suggesting that expectations for volatility are already high. A simple EPS beat may therefore not be enough. Investors will likely focus more on OCI growth, backlog conversion, CapEx discipline, and the path toward improving free cash flow.
Strategy
- Bullish: If OCI and cloud growth beat expectations, management maintains its roughly $90 billion fiscal 2027 revenue target, and provides a clearer path toward stabilizing CapEx and cash flow, a breakout above $170 could confirm an earnings-driven recovery. The next major upside area would be around $180.
- Neutral: If revenue and EPS are broadly in line but financing needs and free cash flow show little improvement, ORCL could remain range-bound between roughly $155 and $170. In that scenario, waiting for a clearer breakout would offer a better risk-reward profile than chasing strength.
- Bearish: If OCI growth disappoints or management raises CapEx and financing requirements again, even stronger RPO could be interpreted negatively if contract growth appears to be outpacing Oracle’s ability to monetize it efficiently. A break below $155 would weaken the structure and bring $145 back into focus.
The central question for Oracle has shifted. Investors are no longer debating whether AI demand is real. They are asking how much that growth will cost. If revenue conversion begins to catch up with infrastructure investment, ORCL could enter a meaningful valuation-recovery phase. If cash-flow pressure continues to worsen, however, even a massive backlog may not be enough to restore confidence.
ORCL: Fresh OI-Filtered Long Signal at $140.35ORCL has generated a fresh LIVE OI-filtered LONG signal after closing at $140.35 on Sep 15, below the current bottom-25% threshold of $148.28.
This is the second consecutive live signal, following another trigger at $144.79 on Sep 14. The latest signal appears after a sharp retracement from the recent $162.52 high reached on Sep 8.
Earlier signals showed strong upside follow-through: the Sep 1 signal at $141.32 reached a peak gain of +15.00%, while the Sep 2 signal at $145.75 reached +11.51%.
Price is now back within the model’s accumulation zone. The $148.28 threshold is the key reclaim level, while $140.35 is the immediate signal-price area. A sustained move back above $148.28 would improve the bullish recovery setup, with $150.28, $154.04, and $162.52 as visible upside levels.
This is a systematic OI-filtered signal based on the model’s bottom-quartile condition, not a guarantee of future performance.
ORCL Sept. 14–18Daily Reversal Tested as 150 Becomes the Battleground
Oracle enters the new week at an important technical decision point. The Daily chart has made a meaningful improvement by breaking the longer-term descending trendline, but the 1H chart has turned bearish after a strong rejection from resistance. At the same time, the 1H GEX map has ORCL trading below the important 150 HVL in negative gamma.
For me, this creates a simple question for Sept. 14–18: can ORCL defend the larger Daily recovery and reclaim 150, or will the short-term weakness continue toward 145 and possibly 140?
Daily Structure
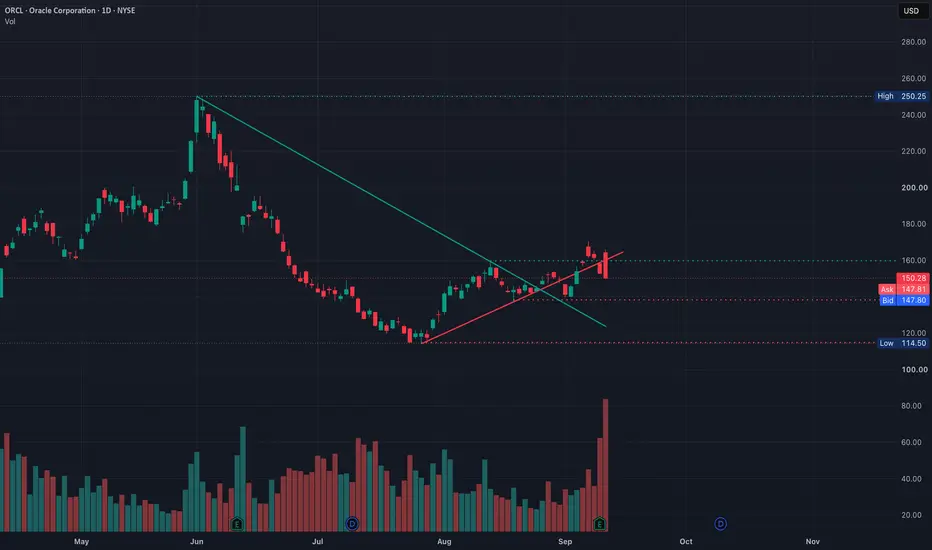
I always start with the Daily because it tells me what the larger structure is doing before I look at the lower timeframe. ORCL peaked around 250.25 in June and then spent several months making lower highs and lower lows. The descending trendline from that high controlled the stock through June, July and into August.
That trendline has now been broken, which is the first meaningful improvement in the larger structure. ORCL established a major low around 114.50 and then recovered through August and early September. However, breaking a bearish trendline does not automatically create a new bullish trend. Buyers still need to establish higher support and successfully break the next major resistance.
The first important Daily resistance is around 160. ORCL recently traded above that area but couldn't hold it and has now pulled back toward 147.80. For me, the broader recovery remains alive while the major support structure around 140 holds. If buyers eventually reclaim 160, I would watch the 166–170 area next, followed by the larger resistance around 184–185.
1H Confirmation
The 1H chart is where I become more cautious. ORCL recently pushed into approximately 166, directly underneath the larger supply area, and sellers rejected the move aggressively. Price subsequently lost 160, 155 and 150 before reaching approximately 147.81.
That gives the 1H a clearly bearish short-term structure. Price is below the short-term trend structure, the chart is showing a support break, and RSI has fallen to approximately 21. This tells me momentum is weak, but it also tells me the stock is already stretched. Because of that, I don't want to chase puts after a large decline.
The first thing I want to see Monday is how ORCL reacts around 150. If a bounce cannot reclaim 150–151, sellers still control the short-term structure. If buyers recover 150 and then push through 153–155, the 1H begins repairing itself. A recovery above 160 would be a much stronger change in character.
GEX Positioning
The 1H GEX map helps confirm why these price levels matter. ORCL is around 147.81 while the HVL sits near 150, meaning price has moved underneath an important gamma pivot. The GEX environment is also negative. I don't interpret negative gamma as automatically bearish; instead, it tells me dealer hedging can amplify movement once an important level breaks.
Below price, 145 is the first important GEX area, followed by approximately 142 and the major put wall/POI around 140. What gets my attention is that the 140 GEX level also lines up with the broader Daily support structure. When the technical chart and options positioning identify approximately the same area, I give that level more importance.
Above price, the GEX map gives us a clear ladder. The first major level is 150, followed by approximately 155 and the stronger C1 around 160. If ORCL can recover through those areas, the next GEX levels sit around 165, 170, 175 and 180.
How I Put It Together
The three charts are not completely aligned, and that's actually what makes this setup interesting. The Daily says the larger downtrend has been challenged and a recovery is developing. The 1H says sellers currently control the short-term move. GEX shows ORCL below the 150 HVL in negative gamma, which could allow the next confirmed break to travel farther.
Because of that, I enter the week with a neutral-to-bearish short-term bias, but I'm not interested in blindly chasing puts. I want price to confirm the next move.
Bullish Scenario
For the bullish case, ORCL first needs to reclaim 150 and prove it can hold that level as support. If that happens, 153–155 becomes the next test. A recovery through 155 would tell me the 1H selloff is beginning to repair itself and put 160 back into play.
A clean reclaim of 160 would be much more important because the lower timeframe would then begin aligning with the improving Daily structure. Above 160, I would watch 165 and 170 as the next major upside areas.
Bearish Scenario
If ORCL attempts to bounce but continues rejecting below 150, sellers maintain the advantage. The next important test becomes 145. A clean break below 145 would make the GEX levels around 142 and 140 increasingly important.
The 140 area is the major downside decision zone for me. If buyers defend it, ORCL could establish a larger Daily higher low and keep the recovery structure alive. If 140 breaks decisively, I would become much more skeptical about the Daily reversal.
Options Outlook
For calls, I prefer confirmation rather than trying to catch the exact bottom. A reclaim and hold above 150 improves the setup, while a move through 155 makes calls more interesting because 160 becomes the next major GEX target.
For puts, I would rather see a failed rebound into 150 or a confirmed break below 145 than chase ORCL after an already extended selloff. Below 145, I would watch 142 and 140. The 1H RSI is already deeply oversold, so risk/reward becomes more important than simply being correct about direction.
Conclusion
ORCL enters Sept. 14–18 with the Daily and short-term charts telling different stories. The Daily is attempting to build a larger reversal, while the 1H has turned bearish and GEX has price below the 150 HVL in negative gamma.
For me, 150 is the main decision level this week. Reclaiming 150 and then 155 would shift my attention back toward 160 and potentially 165–170. Staying below 150 and losing 145 would shift my attention toward 142 and especially 140.
I don't need to predict the entire week before it starts. I want ORCL to show which side controls these levels, and then I can trade with that confirmation instead of guessing.
Educational analysis only. Not financial advice.
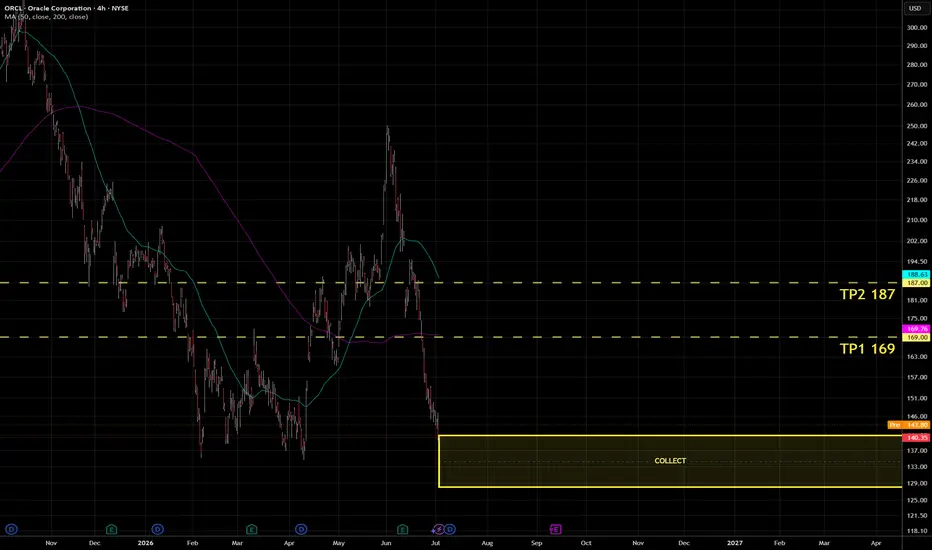
ORACLE !ORCL — the original oracle. The one that knew before knowing was fashionable.
Gathereth from here unto 130. The prudent accumulate in silence.
TP1: 169 — wisdom is vindicated.
TP2: 187 — the witty invention of patience payeth in full.
#ORCL #Oracle #Stocks #Nasdaq #Trading #Crypto #CryptoTwitter #HODL #BullRun #CryptoNews
ORCL: Confirmation of a Huge Head-Shoulder-Formation!Hello Community,
welcome to my new analysis of ORCL on the weekly timeframe perspective. In the recent times, I have spotted crucial trading setups in the stock market, such as with ORCL. Therefore, I have identified all the underlying factors to consider now.
When looking at my chart, we can see how ORCL recently completed this gigantic inverse head-shoulder formation. Below the neckline of the formation, it is now forming this confirmatory setup from which the next bearish wave is setting up.
The final target zones have already been activated, as seen in my chart. From the current point of view, ORCL is a highly bearish stock that will accelerate bearishness in the upcoming times. Once the final target zones are reached, I am going to evaluate the situation anew.
In this manner, thank you a lot for watching!
The support is highly appreciated.
VP
ORACLE Unless Lower Highs break, dropping to $100 is possible.Almost three months ago (June 18, see chart below) we gave a strong Sell Signal on Oracle (ORCL), which hit our $120.00 long-term Target much sooner than we expected:
By doing so it hit the bottom of its 6-year Channel Up and rebounded. So what's next for the tech giant? In order to get a better understanding of the long-term direction, we moved on an even higher time-frame, namely the 1M.
Here we can see that Oracle has been trading within a Fibonacci Channel Up since the April 1999 Low and the current correction since the September 2025 All Time High (ATH) has been the 2nd strongest ever after the 2000 - 2002 Dotcom crash.
The Dotcom crash confirmed the lengthy recovery and the new Bull Cycle that followed, after it broke above its Lower Highs trend-line. If that happens next, then the market sets eyes to a new ATH on a new confirmed Bull Cycle.
Until the Lower Highs trend-line breaks though, a break marginally below the 1M MA100 (green trend-line) within the 0.618 - 0.786 Fibonacci range, which is where the bottom of the last correction got priced (2022) is possible. In that case, hitting $100.00 is possible.
However, we need to take into consideration the 1M RSI historical Support Zone. With the exception of the 2000/02 Dotcom crush, every time the market hit that Zone, it was the most optimal long-term buy opportunity. This time the 1M RSI is making a Double Bottom there, which we've seen on another 3 occasions, 2 produced a rebound that never looked back (Feb 2009, Jan 2016), while 1 (Aug 2001) produced just a Bear Cycle rally that got rejected on the Lower Highs before one last Bearish Leg to form the 2002 bottom.
---
** Please LIKE 👍, FOLLOW ✅, SHARE 🙌 and COMMENT ✍ if you enjoy this idea! Also share your ideas and charts in the comments section below! This is best way to keep it relevant, support us, keep the content here free and allow the idea to reach as many people as possible. **
---
💸💸💸💸💸💸
👇 👇 👇 👇 👇 👇
ORCL: An Elliott Wave roadmap through the next resistance testsORCL has recovered from its July low, but the next useful question is whether buyers can establish strength above $171–172. That is the first decision point in this daily Elliott Wave roadmap. The more ambitious targets depend on several further confirmations.
This chart covers September 30, 2022 through September 8, 2026. The latest displayed regular-session close is approximately $162.52. Prices are in USD on the TradingView ORCL daily chart; some historical anchors remain visually rounded.
The working count treats the advance from roughly $61 in 2022 to $345.72 in September 2025 as Cycle wave . The blue Primary-degree 1–5 sequence describes that advance. The subsequent decline is provisionally counted as an A–B–C correction within Cycle , with a possible ending low at $114.50 on July 28, 2026. Purple Intermediate-degree subdivisions add detail inside Primary wave 5 and the corrective A, B and C legs. This is a selected, nested subdivision, not a claim that every internal swing has a unique interpretation.
The distinction between a plausible count and a confirmed turning point matters. A completed-looking correction can evolve into a more complex structure. Elliott analysis is most useful here as a framework for asking what price must do next, and what would invalidate the interpretation. Labels organize the evidence; they do not remove uncertainty.
The 2025 acceleration and subsequent deep retracement can be read as a transition from an extended advance into a larger correction. That interpretation supports watching for a new cycle, but it does not establish that the new cycle has begun. A rally can still be part of the correction it appears to be escaping.
For a practical decision framework, I would first look for a daily close above $171–172, followed by a retest that holds and a higher low. A brief intraday break followed by rejection would be weaker evidence. Until that confirmation develops, patience remains a valid position. Even after confirmation, the distance to the next resistance zone needs to justify the risk of the particular setup.
The target ladder is deliberately conditional:
• $200–205: the first recovery reference. A 38.2% retracement of the $345.72-to-$114.50 decline is approximately $202.83.
• $250–260: a more substantial test, combining the June wave B high near $250.25 with the 61.8% recovery level near $257.39. Sustained acceptance above this area would strengthen the case for a larger trend reversal.
• $340–346: the previous cycle-high region. This only becomes a relevant continuation objective after the lower resistance zones have been reclaimed.
• $395–410: a longer-term projection, conditional on the July low surviving and price eventually breaking above $346. The arithmetic reference is $114.50 + 1.0 × ($345.72 − approximately $61), or roughly $399. It is a measured-wave reference, not a promise or a timed forecast.
The alternative deserves equal visibility. A break below $114.50 would invalidate the claim that Cycle ended at the July low. A more complex W–X–Y correction would then remain possible, with roughly $94–100 as the next reference zone; the 88.6% retracement of the 2022–2025 advance lies near $93.46. A break below the 2022 origin around $61 would invalidate this entire Cycle I/II interpretation.
The $114.50 level is a structural invalidation, not automatically a suitable stop for a new trade near current prices. A trade stop should come from the actual entry structure, with position size reflecting that distance and the risk of gaps. No order or position is implied by this analysis.
For now, the most informative development is how ORCL behaves around $171–172. A sustained reclaim would advance the recovery thesis; rejection would keep the correction scenario open. The dashed paths show possible sequences, not dates.
Educational technical analysis. Wave counts and target zones are conditional and should be reassessed as price develops.