Oracle - Once again testing important support!🔮Oracle ( NYSE:ORCL ) just headed back to its support:
🔎Analysis summary:
Over the past eight months, Oracle already retested its major support level twice. And while Oracle created a pretty strong bounce every time, it is just again retesting this clear support level. If Oracle creates confirmation, it will give us another bullish rejection.
📝Levels to watch:
$120
Keep your #LONGTERMVISION🙏
— Phil (@TheTraderPhil)
In-depth trading ideas
ORCL Going to Retest Highs on Francis Hunt Volality Funnel Last rally back in June 2026 followed a very distinct pattern on a 5-point retest of higher-highs, and I think we are revisiting the same setup - still within then Francis Hunt Volatility Funnel thats been playing out for the last 12 months.
I am looking for a 3rd higher-high to target $180-190 before Christmas, and if this breaks out of the Macro pattern - We could look for $220-240 in Q1 2027.
A few upcoming catalysts to drive this higher:
1) October 16, 2026 Oracle Analyst Day - Might s
Oracle last strong support if defended can start going upThis is a strong area of support for oracle if this area is defended by buyers then i believe oracle can start going up again.
Important things to look at:
1- Next Earnings
2- Interest Rates
3- If the Nasdaq 100 falls because of a reason then oracle will go down heavy.
ORCL 1D: the line Oracle keeps coming back toOracle has come back to the same line four times this year. On Monday it closed about nine percent below it.
This is Oracle on the daily, log scale, with Accumulate - our structural layer. It draws a reference, and when price falls below that reference the layer opens a zone: the area where a structural base gets built over time. Not a call on a single bar - a window.
How the line got here . Through 2025 the reference rose slowly under price, then flattened in the high 140s as Oracle ran to
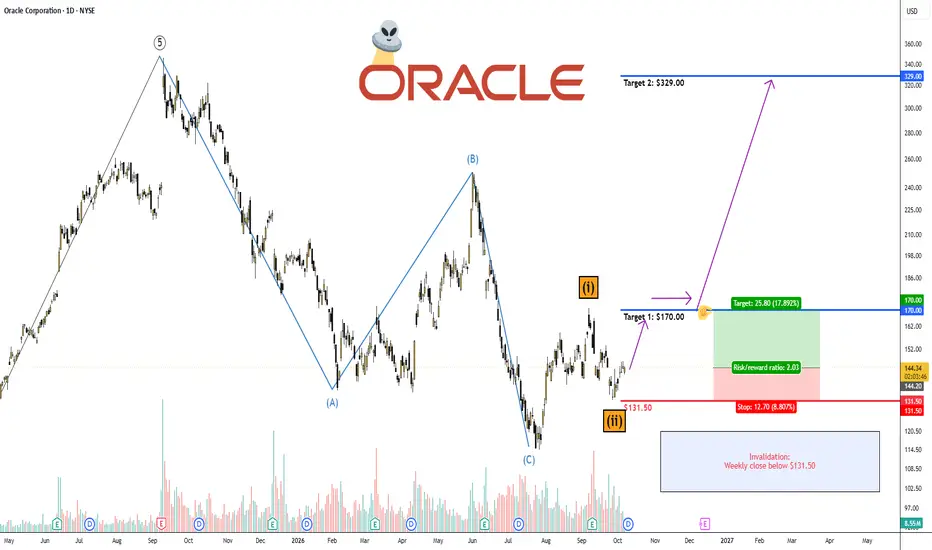
Oracle: Defined-Risk Base Sets Up a 20% Fibonacci Rebound☁️ Oracle: Defined-Risk Base Sets Up a 20% Fibonacci Rebound
ORCL trades near $144, roughly 58% below its late-2025 $345 peak. The opportunity is a defined-risk rebound, not a claim that the entire decline is over. Price must hold $132.50 tactically and reclaim $160.95 for confirmation.
Elliott Wave Count
Weekly: the preferred Prechter count marks the advance from the 2020 $37 low to the late-2025 $345 peak as a completed five-wave impulse. The subsequent decline reads A-B-C: A to $145,
wave pattern of the #ORCL 🇺🇸 stock within a 1-hour timeframe
Breakout 🚀
Details:
- 🔹 Formation of an ideal impulse wave.
- 🔹 Correction through a flat, ascending A-B-C wave.
- 🔹 Breakout of the upper limit of the diagonal pattern from above, confirmed by a trigger pattern.
Forecasts:
1. Wave 1 is nearing completion of all its sub-waves, which may form an impulsive pattern.
2. Wave 2 is expected to experience a sharp correction, targeting a demand zone, which would be a good opportunity for repositioning.
Wave 3: An acceleration in movement is exp
$ORCL: The Truth Behind Project Jupiter Delays and IntrospectionNYSE:ORCL : The Truth Behind Project Jupiter Delays and Introspection Into DC Delays
There's been a lot of media attention on Oracle's buildout delay. The news last week on Oracle's force majeure on Blue Owl payments will likely be max pain FUD injected by shorts looking to cover / buyers. This article also gives color on how regulation FUD is handled by datacenter builders and that the final result is usually a delay, not cancellation.
I'll first explain the two-pronged problem behind Project
ORCL Weekly Setup: $140 Is the Level That MattersOPENING:
NYSE:ORCL is sitting directly on one of the clearest higher-timeframe support zones on the chart.
The $140 area has already attracted buyers before, and price is now testing that same region again.
What makes this setup interesting to me is not just the level itself, but how price is interacting with it on each retest.
THE CURRENT STRUCTURE:
The first move into $140 produced a relatively clean reaction higher towards the 200/day SMA.
This time, price has pushed deeper into the z
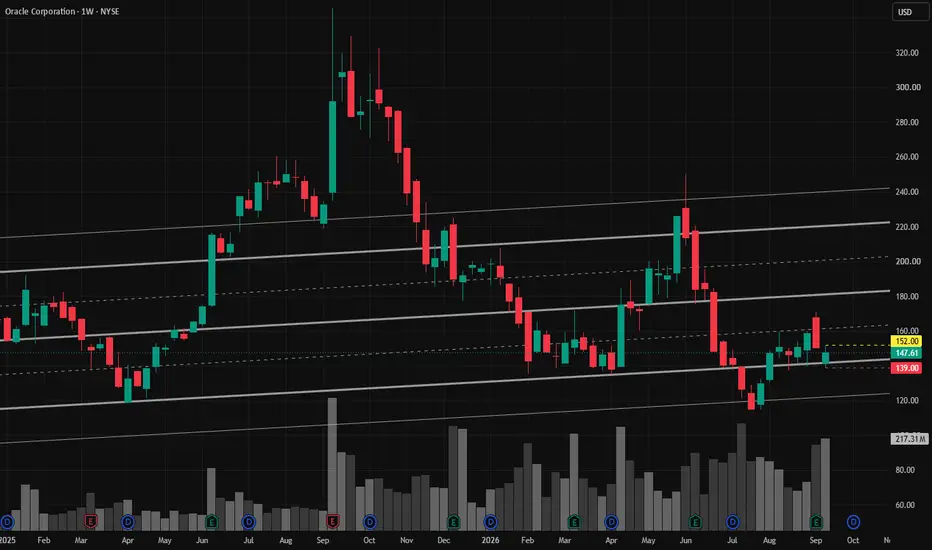
ORCL | Continued stock growth- Timeframe: Weekly
- Trade type: Buy stop order
- Price: 152.00
- Take Profit: Open
- Stop Loss: 139.00 (-8.60 %)
Idea: Long on a breakout above last week's high - bullish momentum continuation.
Entry: Buy stop above last week’s high.
Stop-loss: Below the low of the same candle.
If the weekly candle closes below this level, the trade is invalidated.
Week 39 of 52 | ORCL: Head & Shoulders at the NecklineNYSE:ORCL has built one of the more interesting weekly structures I’m watching right now.
At first glance, the chart looks messy after such a violent move from the 2025 highs. But zooming out makes the structure much easier to see: a large Head & Shoulders pattern has developed over more than a year.
The left shoulder formed around the $190–200 area. ORCL then pushed to a much higher peak near $330, creating the head, before making one more recovery toward roughly $220–230. That last rally f
Oracle falls sharply: reopens the debate over the cost of AIOracle falls sharply and reopens the debate over the cost of AI infrastructure
By Ion Jauregui, Analyst at ActivTrades
Oracle shares (NYSE: ORCL) recorded a sharp decline on Thursday after it emerged that the company had issued a force majeure notice related to Project Jupiter, its major data centre project in New Mexico.
The stock opened down 3.61% and fell by approximately 7.45% during the first hour of trading, reaching an intraday low of $133.45. From that level, it recovered part of the los
Oracle - Preparing another +50% bullrun!🔮Oracle ( NYSE:ORCL ) just retested pretty strong support:
🔎Analysis summary:
For the past two years, Oracle has just been consolidating within its underlying uptrend. And looking at the higher timeframe, Oracle still nicely respected all structure. With the recent retest of major support, Oracle could once again rally +50% towards the upside.
📝Levels to watch:
$130 and $220
Keep your #LONGTERMVISION🙏
— Phil (@TheTraderPhil)
Oracle: You're Entering A World Of Pain!Primary Scenario
In our primary scenario, we see ORCL in the final major phase of a long-term correction. The completion of a corrective upward move still appears imminent, after which we expect sell-offs down into our regular blue Long-Term Entry Range (coordinates: $73.98–$39.07).
Alternative Scenario
ADJUSTMENTS: In the alternative scenario, ORCL would already turn higher within our alternative blue Long-Term Entry Range (coordinates: $136.88–$124.08) (probability: 30%).
Long-Term Out
Oracle May Have BottomedOracle has struggled for the last year, but there could be signs of the software company bottoming.
The first pattern on today’s chart is the August 6 low near $139. ORCL bounced at that level in mid-August, early September and again this week. Is support confirmed?
Second, the level could represent a higher low compared with July’s trough. Combined with the earlier low in February, some traders may see a long and rounded basing pattern. (See the yellow arrows.)
Third, stochastics are trying
ORCL: Fresh OI-Filtered Long Signal at $140.35ORCL has generated a fresh LIVE OI-filtered LONG signal after closing at $140.35 on Sep 15, below the current bottom-25% threshold of $148.28.
This is the second consecutive live signal, following another trigger at $144.79 on Sep 14. The latest signal appears after a sharp retracement from the recent $162.52 high reached on Sep 8.
Earlier signals showed strong upside follow-through: the Sep 1 signal at $141.32 reached a peak gain of +15.00%, while the Sep 2 signal at $145.75 reached +11.51%.
Oracle’s $664B Backlog: The AI Re-Rating Toward $250+Oracle has quietly become one of the most leveraged public-market bets on the AI infrastructure boom. Fiscal 2026 revenue reached a record $67.4 billion, with cloud infrastructure (IaaS) growing 77% to $18.1 billion; the first quarter of fiscal 2027 then accelerated further, with total revenue up 30% to $19.3 billion and IaaS more than doubling at +121% to $7.4 billion. Remaining performance obligations now sit at $664 billion—nearly ten times trailing annual revenue—after another $30-plus billi
ORCL | The time to go long has come- Timeframe: Weekly
- Trade type: Buy stop order
- Price: 150.40
- Take Profit: Open
- Stop Loss: 137.43 (-8.60 %)
Idea: Long on a breakout above last week's high - bullish momentum continuation.
Entry: Buy stop above last week’s high.
Stop-loss: Below the low of the same candle.
If the weekly candle closes below this level, the trade is invalidated.
Take Profit: Trailing stop following the lows of new weekly candles.
ORACLE, has the bottom been reached?Oracle’s share price lost more than 66% between its all-time high in September 2025 and its low point in July 2026.
Can we now say that the stock has finally formed a major bottom and that the underlying bullish trend has resumed?
To answer this question, I will review the fundamental and technical factors that I consider relevant:
· Fundamental technical analysis of financial markets: the long-term signals on the weekly chart
· Stock valuation data and the fundamental outlook for Oracle
Is ORACLE About to Surprise on Earnings? The market has been quite choppy recently, largely due to fluctuations in Treasury yields and shifting expectations around the path of interest rates. Despite the broader uncertainty, the software sector has staged a meaningful recovery over the past few months. Oracle (ORCL), however, has continued to lag behind many of its peers and is currently trading near the lower end of its broader fair value range.
From a technical perspective, there are a few recent developments that make the current s