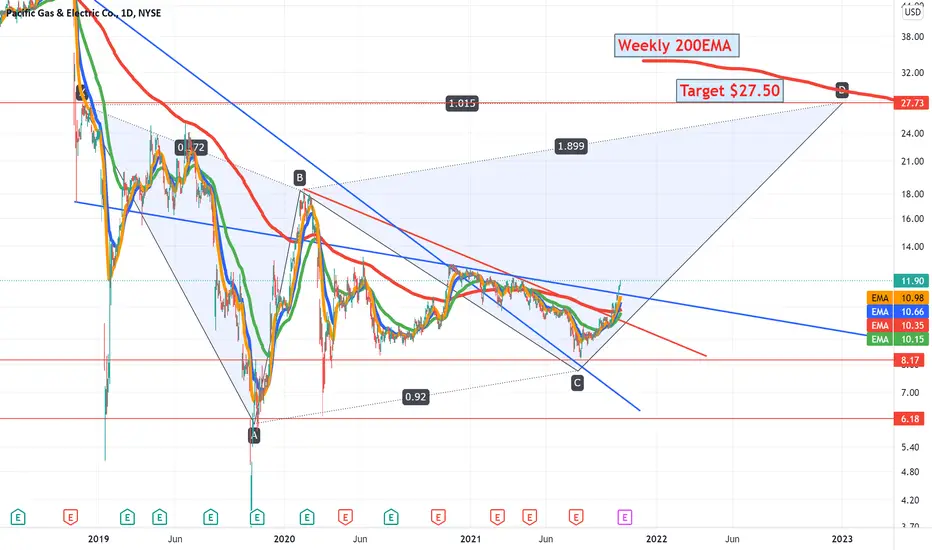
PCG Bullish Reversal Setup with UOA Upside PCG caught my attention after unusual options activity (UOA) in the September 26 $14 Call while the stock was trading near $13.96. Since then, PCG has moved back above $14 and is attempting to establish a bottom after the recent sharp selloff.
The options chain continues to show meaningful call activity and open interest across several expirations, supporting the bullish recovery thesis.
Levels I'm watching:
Key Support: $13.98–$14.04
Bullish Confirmation: Above $14.43
Target 1: $15.24
Target 2: $15.54
Extended Target: $16.29
Invalidation: Sustained move below $13.98
There are still fundamental risks surrounding California wildfire liability and recent analyst downgrades, so I view this as a bullish recovery trade rather than a confirmed longer-term reversal.
As long as buyers continue defending the $14 area, I like the risk/reward for a move back toward $15.24–$15.54.
In-depth trading ideas
PCG: Building Higher Lows — A Long-Term Opportunity?Pacific Gas & Electric (PCG) continues to build a constructive long-term chart, with price trading above the 200 EMA and forming a series of higher lows.
The stock is approaching an important resistance zone. A breakout above this area could open the door for the next leg higher.
📈 Long-Term Targets
🟢 $18.50
🟢 $19.07
🟢 $19.77
📉 Key Support Levels
🔴 $16.83
🔴 $16.01
🔴 $15.06
As long as PCG remains above the 200 EMA and continues making higher lows, I believe the long-term trend remains constructive. I’ll be watching for a breakout above resistance or a healthy pullback into support as potential opportunities.
This is a longer-term investment idea rather than a short-term trade, so patience may be required as the setup develops.
What do you think? Is PCG ready for a breakout, or do you expect more consolidation before the next move?
This is my personal technical analysis for educational purposes only and is not financial advice. Always do your own research and manage your risk.
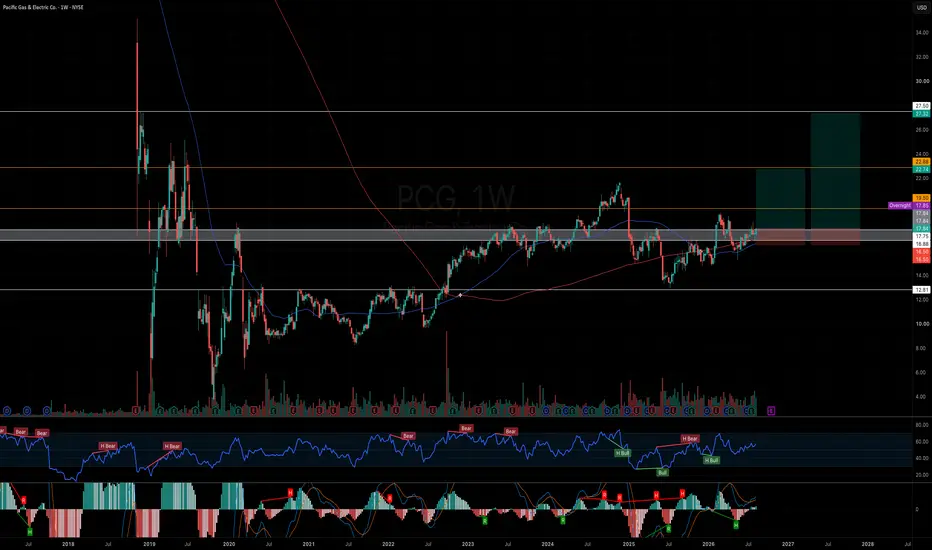
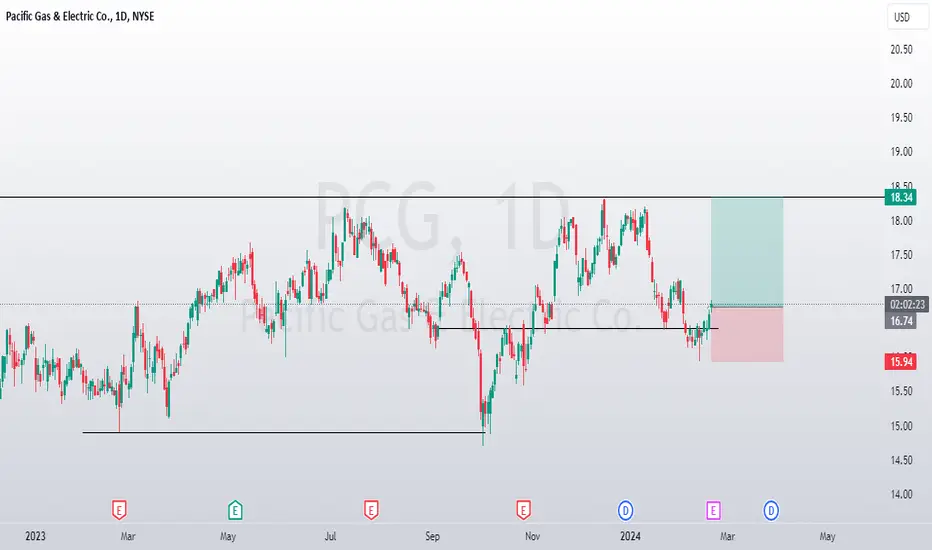
PCG | May, 2026 | Continued stock growth- Timeframe: Weekly
- Trade type: Buy stop order
- Price: 16.55
- Take Profit: Open
- Stop Loss: 15.28 (-7.70 %)
Idea: Long on a breakout above last week's high — bullish momentum continuation.
Entry: Buy stop above last week’s high.
Stop-loss: Below the low of the same candle.
If the weekly candle closes below this level, the trade is invalidated.
Take Profit: Trailing stop following the lows of new weekly candles.
👉 Gate | 50+ U.S. stock tokens | Earn stocks
👉 Kraken Pro | 100+ U.S. stock tokens | xStocks
👉 Bitget | 250+ U.S. stock tokens | 0% trading fees
Feel free to like and share your thoughts in the comments! ❤️
Trade Idea: PCG 3/20 19c, 4/17 19c, 20cOptions Breakdown:
* PCG 3/20 19c .24-.56, 5.7K OI / 629 VOL, .51 Delta/ -.01 Theta
* PCG 4/17 19c .66-.74, 11.8K OI / 152 VOL, .53 Delta/ -.01 Theta
* PCG 4/17 20c .28-.35, 1.2K OI / 6274 VOL, .31 Delta/ -.01 Theta
Technical Analysis:
Daily:
* Entry above: $19.09
* Targets: $19.26, $19.44, $19.77
* Stop loss below $18.88
* Higher highs and higher lows
* Price is in stage 2 of the money flow
* Price is above 5, 10, 20 and 200 MAs
Weekly:
* Entry above: $19.09
* Targets: $19.65, $19.99, $20.44, $20.76, $21.03, $21.31, $21.52
* Stop loss below: $18.75
* Higher highs and higher lows
* Price is in stage 2 of the money flow
* Price is above 5, 10, 20 and 200 MAs
* Price above previous resistance at $17.86
* Risk / Reward ratio: 6.49 max target
Monthly:
* Entry above: $19.09
* Long 2u candle closed on Friday
* Price is in stage 2 of the money flow
Sector: XLE
* Price is in stage 2 of the money flow
Personal experiences only. Not financial advice.
PCG Pacific Gas and Electric Company: Trading Idea
XLE Energy sector has been on fire! Keeping an eye on PCG waiting for entry and possibly pullback before I consider the trade.
- PCG 2/20 18.5c, .11-.13, 1.1K OI / 20.2K VOL, .30 Delta / -.03 Theta
- PCG 3/20 20c, .10-.13, 1.2K OI / 215 VOL, .15 Delta / -.01 Theta
- PCG 4/17 19c, .51-.60, 11K OI / 284 VOL, .39 Delta / -.01 Theta
- Daily:
- Entry above: $18.21
- Targets:
- Stop loss
- RSI 79
- Stage 2 of the money flow
- Weekly:
- Entry above: $18.21
- Targets: $18.42, $18.76, $19.12, $19.44
- Stop loss below: $17.98
- Higher highs and higher lows
- Long bullish 2u candle closed on Friday
- Price is in stage 2 of the money flow
- Monthly:
- 2u candle
- Sector: XLE - Stage 2 of the money flow
“Personal experiences only. Not financial advice
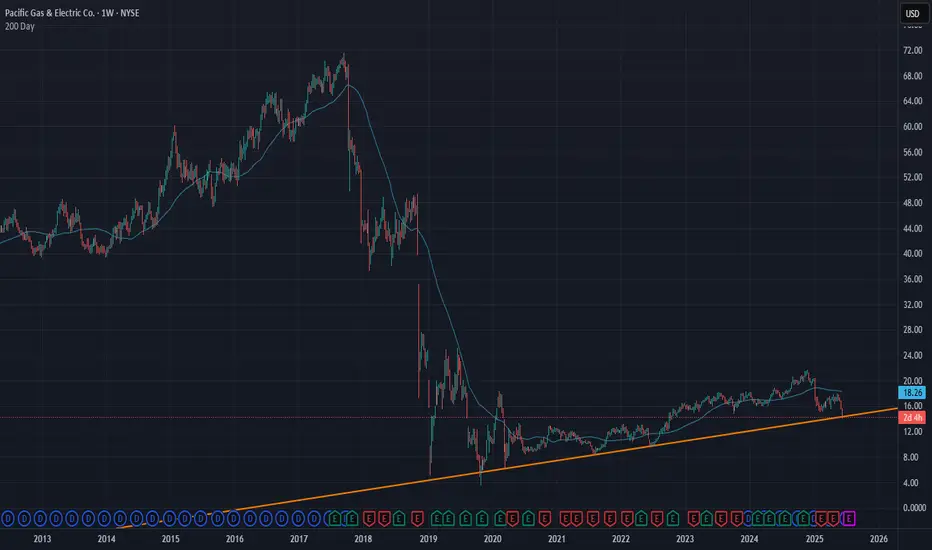
PCG | SWINGGGG TRADE IDEA, BRUVS!Ahoy M8s.
We're sailing the swing trading seas today! PG&E (PCG) just pierced a multi-year support line. Doesn't mean it can't go lower, but that's why we're managing our position size with a small starter position.
Will follow up with an add message if I add to the position. Don't get cooked. LETS GOOOOOOOOOOOO!
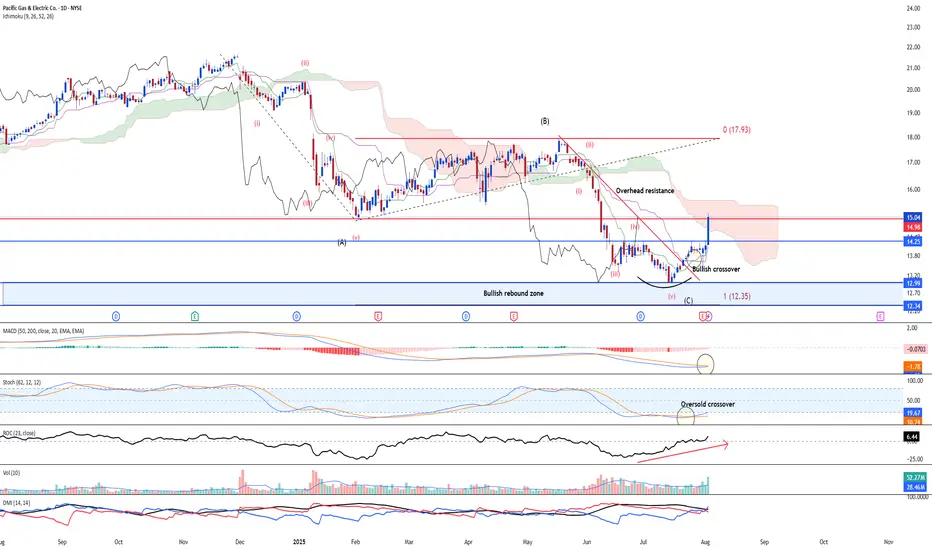
Pacific Gas's Corrective structure likely over Pacific Gas Corporation (PCG:US) corrective structure likely has ended after a strong break above US$14.25 resistance turned support. Furthermore the overhead resistance has been broken. The ABC corrective wave has ended after the last leg of wave C has a terminal divergence with oversold signal by the midi-term stochastic and 23-period ROC.
Momentum indicators:
Long-term MACD is showing a potential bottoming crossover.
Stochastic oscillator has confirmed the oversold signal
23-period ROC shows a bullish divergence.
Earnings was previously bad after being hit by higher operating cost. However. after the bad NFP numbers, the Fed is likely to perform a rate cut, which in turn may benefit utilities based companies as financing cost may lower.
PCG may target 18.00 in the longer term period. 12.35 is the major support.
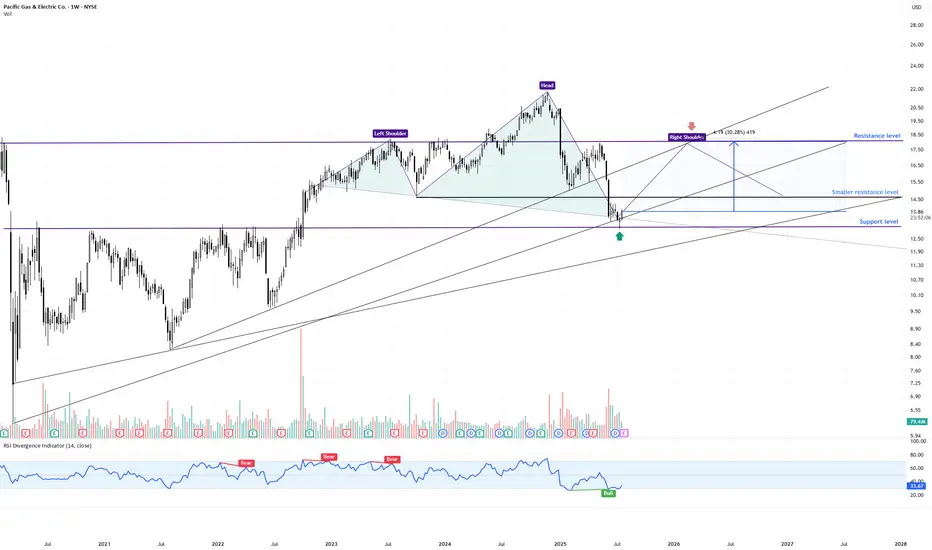
PCG Weekly Swing Trade | High-Probability Reversal Zone📍 Ticker: PCG (Pacific Gas & Electric Co.)
📆 Timeframe: 1W (Weekly)
💡 Pattern: Head & Shoulders Formation – Testing Neckline & Long-Term Support
📉 Price: $13.87 (current weekly level)
📊 Volume: 78M
📉 RSI: 33.7 → oversold zone brewing
🔍 What the Chart is Showing
PCG is in the late stages of a Head & Shoulders pattern, but the right shoulder is still developing. Price is now pressing into a critical confluence area where multiple factors intersect:
✅ Neckline zone from the potential H&S structure
✅ Multi-year ascending trendline support (2020 origin)
✅ Horizontal support cluster from 2022–2023 consolidation
✅ Weekly RSI hovering near oversold, hinting at possible bullish divergence
Importantly, the H&S is not yet confirmed – it would require a decisive weekly close below the neckline to trigger a textbook breakdown.
🧠 Swing Trade Scenarios
➡️ Bullish Reversal Scenario (Failed Breakdown)
🟢 Entry Zone: $13.60–$14.00
🎯 Target 1: $14.62 (initial resistance pivot) - close 30-70% of the position
🎯 Target 2: $17.80–$18.50 (major resistance) - close the another 30-70% of the position.
⛔️ Stop-Loss 1: Close below $13.20 (neckline break confirmation)
➡️ Bearish Breakdown Scenario (Pattern Confirmation)
❌ If PCG closes below $13.20 on the weekly, it confirms the H&S → opens downside toward $11.50 (the lowest trendline support)
⚠️ What Makes This Week Critical
📌 A hammer-like candle is forming – but needs a strong weekly close to indicate buyer absorption
📌 A close above $14.00 would weaken the H&S formation, hinting at a failed pattern
📌 A close below $13.20 would confirm the bearish continuation
This is a decision zone: either the right shoulder fails, triggering a deeper swing lower, or buyers defend and negate the pattern.
💬 Will PCG confirm the weekly H&S breakdown or trap bears with a failed pattern bounce?
✅ This week’s close will define the next major swing move!
LIKE & FOLLOW for more professional swing setups with clean risk/reward.
#PCG #SwingTrade #Utilities #TargetTraders #TechnicalAnalysis #HeadAndShoulders
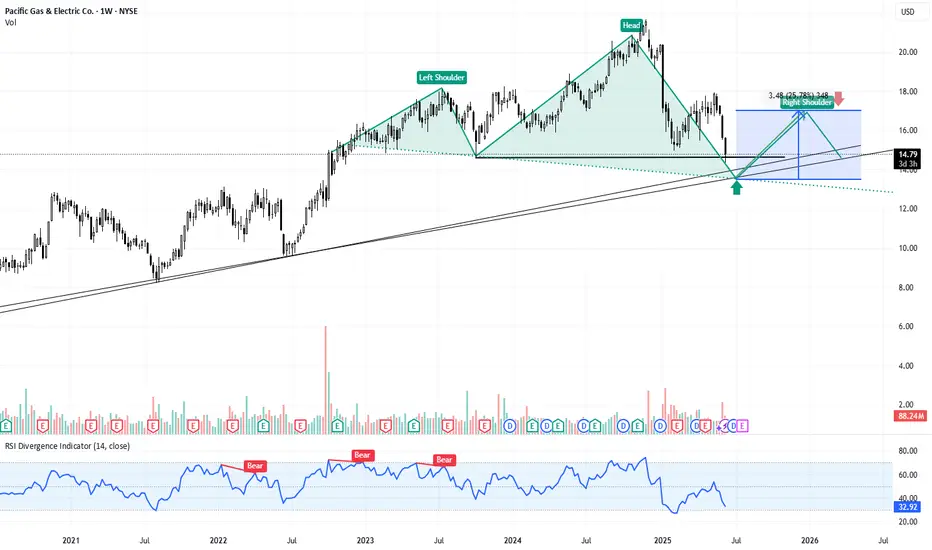
PCG | Potential Reversal Zone at LT Support + Breakdown Retest📍 Ticker: NYSE:PCG (Pacific Gas & Electric Co.)
📆 Timeframe: 1W (Weekly)
💡 Pattern: Head and Shoulders Breakdown → Testing Key Support
📉 Price: $14.79 (as of last candle close)
📊 Volume: 87M
📉 RSI: 32.92 (approaching oversold)
🔍 Technical Setup:
A Head and Shoulders top has completed, with price breaking down below the neckline. However, PCG is now approaching a major confluence zone:
✅ Multi-year ascending trendline support (dating back to 2020)
✅ Previous horizontal support from 2022–2023
✅ RSI nearing oversold (32.9) — potential for bullish divergence
✅ Volume spike on breakdown — possible capitulation
The blue zone marks a potential retest area. If price holds and forms a reversal candle here, a bounce toward $16–$17 is possible (prior support zone).
🧠 Trading Plan:
Bullish Bias: If price shows bullish price action at/above trendline (~$14.40–$14.70)
🟢 Entry Idea 1: $14.75–$14.90
🟢 Entry Idea 2:$13.60–$14.20
🎯 Target 1: $16.20
🎯 Target 2: $17.00
⛔️ Stop1: Close below $14.20 (trendline + neckline invalidation)
⛔️ Stop 2: Close below $12.50 (Bearish Continuation: Close below ascending trendline + neckline = further downside risk toward $12.50)
⚠️ Watchlist Notes:
PCG is defensive (utilities), but often reacts to regulatory/news-driven catalysts.
Recent weakness may offer a risk/reward setup near major support.
RSI bearish structure is weakening — watch for divergence or failed breakdown.
💬 What do you think? Bounce or breakdown from here?
📌 Like & Follow for more setups! #TargetTraders #PCG #HeadAndShoulders #RSI #Utilities #SwingTrade #TechnicalAnalysis
$PCG - Did market just panic dumped the wrong stock?The recent wildfires in California, particularly the Palisades and Eaton Fires in Los Angeles County, have primarily affected Southern California.
This recent wildfire news caused NYSE:PCG to crash alongside NYSE:EIX (which bounced as well).
However, PG&E's service area is predominantly in Northern and Central California. PG&E will not have to pay back the wildfire fund if deemed prudent.
Furthermore, PG&E is a stable utility with monopoly-like dominance in California’s massive market. It benefits from regulated pricing, essential services, wildfire liability caps, and state support for clean energy and infrastructure upgrades. With strong cash flows, improving safety measures, and alignment with decarbonization trends, PG&E offers resilience, growth potential, and a compelling "buy the fake fear" opportunity. Don’t let short-term noise overshadow its solid fundamentals.
So, did market just panic dumped the wrong stock?
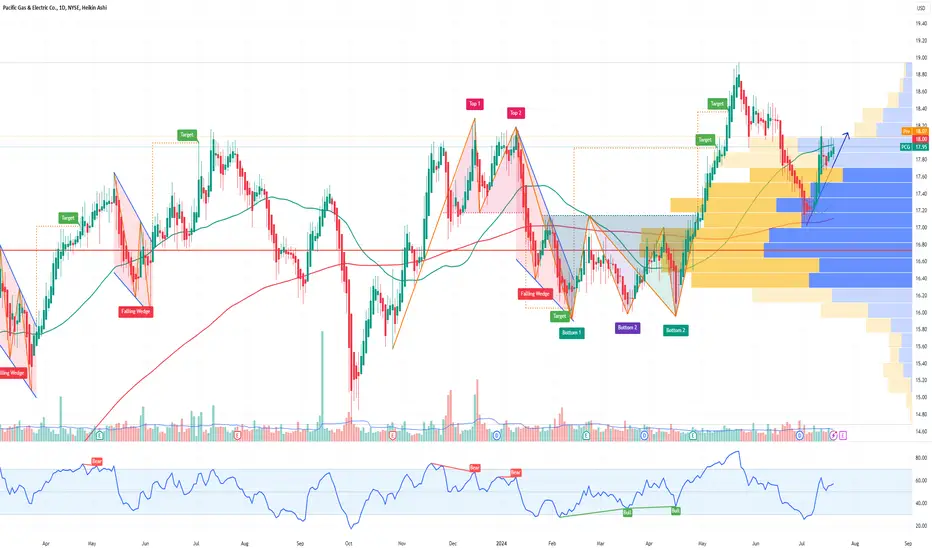
PCG PG&E Corporation Options Ahead of EarningsAnalyzing the options chain and the chart patterns of PCG PG&E Corporation prior to the earnings report this week,
I would consider purchasing the 18usd strike price Calls with
an expiration date of 2024-8-16,
for a premium of approximately $0.40.
If these options prove to be profitable prior to the earnings release, I would sell at least half of them.
PCG is putting in a BasePCG is oversold in RSI at 36 and the MCAD is beginning to show a slow down. A base seems to be building on the daily with volume. The news of the new leadership position has hit the market and the stock has broken below the 200 day MA.
The Time Frame Continuity is not showing the best promise; however, the Hourly is reversing.
The targets are the prices listed on the chart.
PCG caught my attention to continue bullishI want to Buy this Stock base on 2 main approach.
1.Technical Analysis: base on technical, using the ICT I trade with, The market sweeps liquidity and create a valid order blocks and expanded with Fair value gaps, target equal highs, this is good sing of strength to go bullish.
2. FOUNDAMENTAL REPORT: in this case, PCG stocks is own by 93% institutions , and the institutions has the highest number of transaction with 13%. on my on view, they accumulated BUYs to target the price of $18.50 or above
PG&E corp is in for an ELECTRIC RIDE UPWARDSPG&E isn't going anywhere, California is helplessly dependent on it. they are investing in their infrastructure (after its horrendous wildfire fiasco due to infrastructure negligence). This situation lead to a tremendous sell-off because it seemed like a risky company to hold stocks for and overall the company was just hated throughout California after the fires. I think that very soon the stock price is set for a very aggressive bounce back to its past high value levels
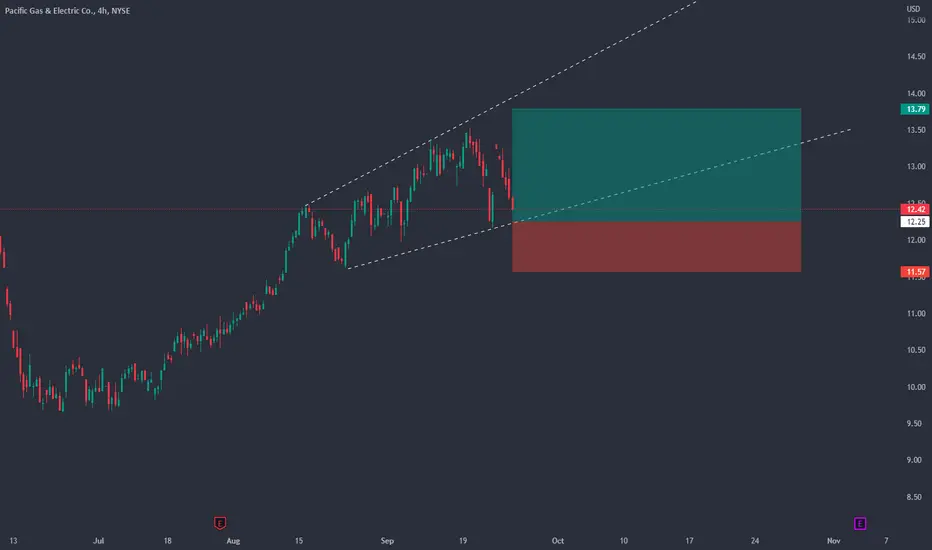
PCG: Can utilities stand the bears?PG&E Corporatio n
Short Term - We look to Buy at 12.25 (stop at 11.57)
Price action has formed an expanding wedge formation. This is positive for sentiment and the uptrend has potential to return. Support is located at 12.00 and should stem dips to this area. Preferred trade is to buy on dips.
Our profit targets will be 13.79 and 14.50
Resistance: 14.00 / 18.00 / 40.00
Support: 12.00 / 10.00 / 8.50
Please be advised that the information presented on TradingView is provided to Vantage (‘Vantage Global Limited’, ‘we’) by a third-party provider (‘Signal Centre’) . Please be reminded that you are solely responsible for the trading decisions on your account. There is a very high degree of risk involved in trading. Any information and/or content is intended entirely for research, educational and informational purposes only and does not constitute investment or consultation advice or investment strategy. The information is not tailored to the investment needs of any specific person and therefore does not involve a consideration of any of the investment objectives, financial situation or needs of any viewer that may receive it. Kindly also note that past performance is not a reliable indicator of future results. Actual results may differ materially from those anticipated in forward-looking or past performance statements. We assume no liability as to the accuracy or completeness of any of the information and/or content provided herein and the Company cannot be held responsible for any omission, mistake nor for any loss or damage including without limitation to any loss of profit which may arise from reliance on any information supplied by Signal Centre.