

In-depth trading ideas

PM Long — PM's pullback long lines up perfectly with the 1h rejePM prints a solid aligned 4h pullback long into the 1h rejection with 1.9R to resistance; the FDA modified-risk order for Zyn supplies fresh positive regulatory momentum that supports the long side.
📍 Entry: 181.90
🛑 Stop: 177.89
🎯 Target: 189.68
⚖️ R:R: 1.94
Long
PM | June, 2026 | Continued stock growth- Timeframe: Weekly
- Trade type: Buy stop order
- Price: 180.36
- Take Profit: Open
- Stop Loss: 170.00 (-5.70 %)
Idea: Long on a breakout above last week's high — bullish momentum continuation.
Entry: Buy stop above last week’s high.
Stop-loss: Below the low of the same candle.
If the weekly candle closes below this level, the trade is invalidated.
Take Profit: Trailing stop following the lows of new weekly candles.
Feel free to like and share your thoughts in the comments! ❤️
Long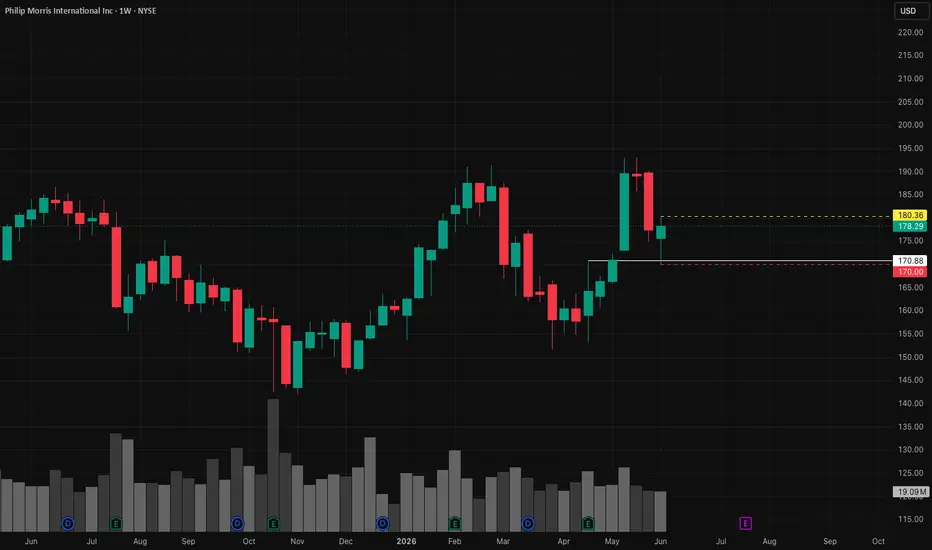
Double Top for $PMNYSE:PM already printed positive price action and is working with the ema21d as support.
Double top at $190 as next resistance
On Watch for a good R:R Setup
Long
PM trendline resistance, overbought and pullback due SELL+++Overbought at trend line resistance due a pullback $177 first target
Short
50 SMA Strategy - $PMSome weekend setups
The stock was rejected but found support at $175.83.
Buying volume is spiking and above average.
Entry trigger: close above $175.83
Target: $192.95
Stop: Below the support
Good luck!
Long
PM has been smokin' lately - playing the odds with an SD channelI am all about playing odds when I trade, so here is one that generates small, but highly reliable returns. In the past year, PM has closed below the PREVIOUS day's lower 2 standard deviation band boundary (5 day lookback) 38 times. In all but 2 cases, the stock closed higher than that initial entry within 2 weeks. Way more often than not, it was less than a week and most frequently, it was one or two days later.
This isn't designed to be a whopper of a trade. I play the capital efficiency game. I want my trades to make more money per day invested than the average daily return of the market. This would have done so handily over the course of those 38 events. Additionally, PM is in a strong uptrend, above its 20, 50 and 200 day SMAs, pays 3%+ dividend and is a defensive name at a time when the market is taking turns worrying about AI and war and it makes it an easy choice for me today.
I will enter at the close, and hold until the first profitable close. I won't add using this system until the price again closes below the previous day's 2SD boundary AND at least 5 trading days have passed (that avoids stacking a bunch of losing lots at the top of a long downtrend). I'll post the entry price as a note after the close. I just have a lot to attend to at the close today and wanted to get this posting out of the way early today.
As always - this is intended as "edutainment" and my perspective on what I am or would be doing, not a recommendation for you to buy or sell. Act accordingly and invest at your own risk. DYOR and only make investments that make good financial sense for you in your current situation.
Long
$PM smoke up johnny. can i offer you a Zyn in this trying economy?
fundamentally undervalued, overhang on regulation, once lifted, we should have a solid and relatively recession resistant giant with the long tailwind of smoking cessation (and the fact that the Yout are all over it)
Long
waitTeam,
We are not buying now.
Price is still trading below major descending resistance (R).
As long as we are below R, the structure remains under pressure.
✅ What We Are Waiting For
We only buy if:
Price breaks above the descending resistance (R)
A candle closes clearly above it
We see strength (no immediate rejection wick)
Ideally: a small pullback that holds above R
No breakout = no trade.
🟢 Entry Plan (After Confirmation)
Once price:
Breaks above R
Retests and holds
Long
Global trend continuation on Philip Morris Int. (Ticker PMI)NYSE:PM
Fundamentals:
- recent yearly and quarterly reports of PMI were pretty nice due to the art of bussiness (comsumer staples) as well as specification of the product - tabak-related items, and we all know that whatever happens people will continue smoking. Their business with electronic cigarettes improves, erobers the market and brings revenue and earnings. And this is de-facto one of the main reasons why investors would hold money in the business and even buy more - because of reccuring dividends and more or less stable earnings. Even the current lower than expected earnings for Q4 of 2025 are completely overblown by positive 2026-2028 earnings expectation report. I personally saw new production factories the company builds near the existing company buildings in the country I am living in, and that only means that they have money and they have demand on their product which makes it reasonable to continue expanding
- as the market sentiment remains unstable and is the reason for worries of most of traders, the consumer industry has historically played a role of a safe harbor for the times of instability and as regular cash flow during bullish times
- these factors do speak more for possible existence of further investors interest in the company, which may lead to further growth
- but dont forget that there are financial reports every 3 months, and situation can always change and smart money might decide to take out money from an asset which is definetly on its local or global highs
Technicals:
- the negative factor is the possible upside W-formatted double-top pattern on the global picture which in case of negative news can push the price down
- there are stop-losses directly above recent high in June 2025, so if price reaches that level a lot of short squeezes can be triggered
- in case of positive scenario and move forward I expect the price to retest the closest zone which has not yet acted as support
- but this will only happen if the further upward movement is weak
- if the price continues the upward movement straight from the place it is now (182.00-183.00) it can mean a strong trend continuation
- nevertheless if the "not-really-good-one support zone" does not hold the price at 173.00, a next target on 163.00 can be taken into account
Conclusion:
- due to market sentiment and technical upside W-formation it is recommended to follow the price action on Friday 6 Feb., but enter the trade on Monday 9 Feb.
- if price shows strengh and moves forward the recent high, I will look for medium-term trend continuation
- but in case there are no significant changes today on 6 Feb and bearish news over weakend, the short-term downside correction scenario to 173.00 or 163.00 will be taken under loop, but decission met on spot
- sometimes it is better to wait than to hurry
# - - - - -
WAIT UNTIL 9 February for decission
⚠️ Short-term Signal - Sell ⬇️
✅ Entry Point - Stop-limit on 182.00
🛑 SL - 187.24
🤑 Partial TP 50% - 171.36
🤑 Final TP 100% - 163.79
⚙️ Risk/Reward - 1 : 2 and 1 : 3.5👌
⌛️ Timeframe - 1 week 🗓
# - - - - -
Only if short trade succeeds
⚠️ Long-term Signal - Buy ⬆️
✅ Entry Point - 173.24
🛑 SL - 158.53
🤑 TP - 223.54
⚙️ Risk/Reward - 1 :3.44 👌
⌛️ Timeframe - 1 month 🗓
# - - - - -
Alternative HIGH RISK
⚠️ Long-term Signal - Buy ⬆️
✅ Entry Point - Stop-limit 184.80
🛑 SL - 17.34
🤑 TP - 223.54
⚙️ Risk/Reward - 1 : 2.9 👌
⌛️ Timeframe - 2 weeks 🗓
Good Luck! ☺️
# - - - - -
DISCLAIMER: Not financial advice. Everyone must make trading decisions at their own risk, guided only by their own criteria and strategy for opening or not opening a trade
Long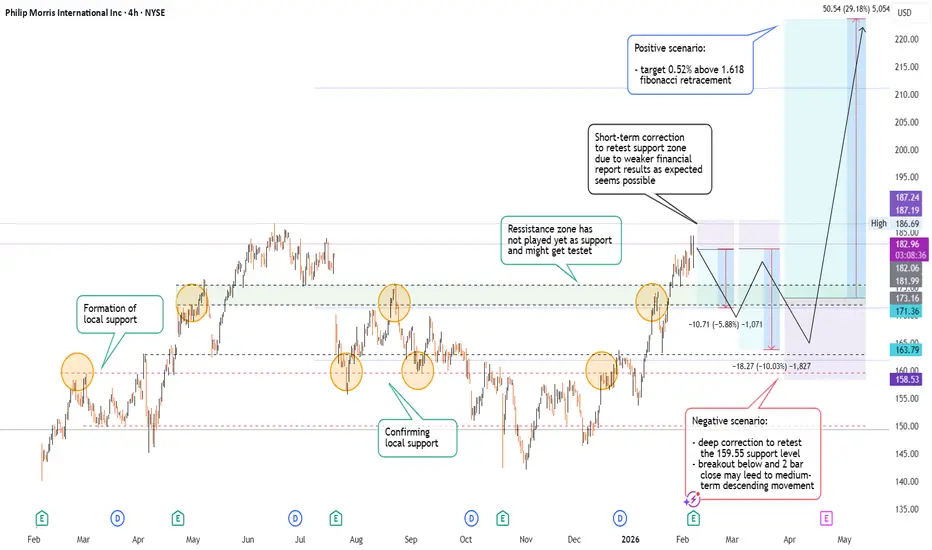
PM | Tobacco On The Rise | LONGPhilip Morris International, Inc. is a holding company, which engages in the business of delivering a smoke-free future and evolving a portfolio for the long term to include products outside of the tobacco and nicotine sector. It operates through the following geographical segments: Europe Region (Europe), South and Southeast Asia, Commonwealth of Independent States, Middle East, and Africa Region (SSEA, CIS, and MEA), East Asia, Australia, and PMI Duty Free Region (EA, AU, and PMI DF), and Americas Region (Americas). The Europe segment includes all the European Union countries, Switzerland, the United Kingdom, Ukraine, Moldova, and Southeast Europe. The SSEA, CIS, and MEA segment focuses on South and Southeast Asia, the African continent, the Middle East, Turkey, Israel, Central Asia, Caucasus, and Russia. The EA, AU, and PMI DF segment is involved in the consolidation of international duty-free business with East Asia and Australia. The Americas segment is comprised of the United States, Canada, and Latin America. The company was founded by Philip Morris in 1847 and is headquartered in Stamford, CT.
Long
Philip Morris (PM – Daily)
Philip Morris (PM) has completed a strong medium-term uptrend and entered a descending corrective channel.
This move appears to be a healthy structural correction, not a trend reversal.
Key observation:
• Price has broken above the descending channel
• Currently retesting the breakout zone
→ Classic break-and-retest behavior
Key Price Levels
• Key Support:
154 – 156
• Major Support:
148 – 150
• Immediate Resistance:
160 – 162
• Next Resistance:
168 → 172
Bullish Scenario (Primary)
If price:
• Holds above the 154–156 zone
• Shows bullish continuation from the retest
➡️ Corrective phase is complete and trend continuation is likely.
Upside Targets:
160 → 168 → 172
Invalidation / Stop:
Daily close below 148
Bearish / Failed Breakout Scenario
If price:
• Fails to hold above 154
• Falls back inside the descending channel
➡️ A deeper corrective move toward the channel lows becomes likely.
Downside Targets:
148 → 142
Bearish Invalidation:
Strong acceptance above 160
Final Takeaway
PM is transitioning from correction to potential continuation.
Holding above 154 keeps the bullish bias intact.
Long
The key is whether it can turn bullish
Hello, fellow traders.
Follow us to get the latest information quickly.
Have a great day.
-------------------------------------
(PM 12M chart)
The 111.25-123.55 range is expected to be a strong support area.
If the price falls below Fibonacci 1 (157.55), it is expected to form a downward wave towards 134.15.
If it finds support near Fibonacci 1 (157.55) and rises, it is expected to rise towards Fibonacci 1.618 (206.50).
-
(1M Chart)
The key question is whether it can find support near 153.32 and rise above 182.13.
The 153.32-182.13 range, which is the HA-High ~ DOM (60) range, is considered a sell zone.
Therefore, if you are in profit, you should focus on finding the right time to sell in installments.
To initiate a new purchase, you should confirm whether support is found in the 153.32-182.13 range.
Therefore, here's what we need to check:
To continue the uptrend by breaking above a key point or range, the StochRSI, TC, and OBV indicators must show upward trends.
If possible,
1. The StochRSI indicator should not have entered an overbought zone.
2. The TC indicator should remain above zero.
3. The OBV indicator should remain above the High Line.
If the above conditions are met and the price breaks above the 153.32-182.13 range, it is highly likely to continue rising.
If not, it will only pretend to rise and then fall again.
-
(1W Chart)
The M-Signal indicator on the 1W and 1M charts is crossing the Fibonacci range of 0.886 (148.52) to 1 (157.55).
Therefore, the key question is whether support can be found around 153.32 and an upward movement can occur.
-
(1D Chart)
The basic trading strategy is to buy in the DOM(-60) to HA-Low range and sell in the HA-High to DOM(60) range.
However, if the price rises in the HA-High to DOM(60) range, a stepwise uptrend is likely. If the price falls in the DOM(-60) to HA-Low range, a stepwise downtrend is likely.
Therefore, a split trading approach is necessary.
The price formed a low in the 144.60-148.53 range, which is the DOM(-60) ~ HA-Low range, and then rose.
Therefore, based on a basic trading strategy, it is highly likely to touch the 182.13-184.10 range.
The key to this is whether the price can break above the 163.59-170.29 range and turn upward.
-
Thank you for reading to the end.
I wish you successful trading.
--------------------------------------------------

PM at a Major Decision Zone: Breakout or Drop to $140?PM is currently retesting the 155–157 resistance zone, which previously acted as a major support area and now aligns with the 50-day SMA.
This makes the zone a critical decision point.
Bullish Scenario (If breakout occurs)
If price breaks and holds above 157–160:
Bullish Targets:
• $165
• $171
• $178
Bearish Scenario (More likely unless breakout confirmed)
If price gets rejected again:
Bearish Targets:
• $150
• $145
• $140 (key structural support)
Stop Loss
• Long: below $154
• Short: above $160.50
Long
PM Stock Technical Analysis – Short Sell Justification PMThe daily chart for Philip Morris International (PM) shows the stock is confronting strong resistance at the 200-day moving average, with prices consistently trending below both the 50-day and 200-day averages. After a recent bounce, the stock failed to break this key resistance, which is a classic technical signal for a short-term pullback .
Short-Sell RationaleThe most recent candlesticks reveal rejection at the $160 level, supporting expectations of downside movement.Technical indicators, including a weak RSI and bearish momentum, suggest limited buying strength and potential for further selling pressure.Target projections and current market sentiment point to a $5-$10 decrease over the next week, which matches observed technical patterns.
This setup justifies a cautious short sell position for traders anticipating a brief decline in PM’s share price.
Short
Philip Morris (PM) — Strong Support or the Calm Before the Drop?
Short-Term Outlook (1–3 months)
Current Situation:
Philip Morris stock is trading around $153.39, sitting right on a key support zone. The price recently bounced after a sharp correction but now faces resistance near the 50-day moving average (around $158.30). This makes the coming days critical for direction confirmation.
Resistance & Support Levels:
Immediate Support: $153.39
Resistance: $158.30
Trend Analysis:
If PM can hold above $153.39 and break through $158.30, a short-term bullish move could develop. However, a breakdown below $153 would likely trigger renewed selling pressure.
Price Targets & Stop Loss:
Target: $158.30
Stop Loss: $140.27
Long-Term Outlook (6–12 months)
Current Situation:
From a longer-term perspective, PM remains below its 50-day moving average (around $177.73), suggesting the broader trend is still under pressure. However, if the stock can sustain above the $153–$158 zone and regain momentum, a recovery toward previous highs is possible.
Resistance & Support Levels:
Long-Term Support: $153.39
Long-Term Resistance: $177.73
Trend Analysis:
A sustained move above $158 would shift momentum bullishly, targeting the $170–$177 range. On the other hand, if the $153 support fails, the price could drop toward $140 or even lower.
Price Targets & Stop Loss:
Target: $170–$177
Stop Loss: $140.27
Summary
Short-Term: Watch for a bounce to $158 if support holds.
Long-Term: A breakout above $158 could open a path to $177; failure below $153 risks a drop to $140.
Short
Philip Morris (PM) Weekly Outlook
NYSE:PM NYSE:PM The price is currently at the long-term ascending channel support. If it falls below 142.33, the $130 area may come into play. Stop loss should be set below 142.33. This is not financial advice.
Long
PM has reached important support Price has followed the broader trend structure outlined in prior updates since August and has now reached a key mid-term support zone, where at least a temporary bounce is likely.
Alternatively, a breakdown below 140 would increase the odds of a move toward 130 support.
On the macro time frame, the uptrend structure from the 2020 bottom continues to suggest long-term potential for higher resistance targets, as long as price holds above 127.
Chart:
Macro view (Monthly):
Previously:
• On key support to watch (Oct 3):
Chart:
www.tradingview.com
• On immediate downside potential (Sep 25):
Chart:
www.tradingview.com
• On downside potential (Sep 5):
Chart:
www.tradingview.com
• On resistance (Aug 11):
Chart:
www.tradingview.com

PM - LongIt looks like PM completed a head-and-shoulders pattern. Let's go long from here. Looking for a 4-5% upside from here.
Long
Philip Morris Turning Point: Surge to $200 or Drop to $140?
Technical Analysis
Overall Trend: The stock is in an upward channel, and the ascending trendline (blue) has been validated multiple times, showing strong price reactions.
Moving Average: The price is fluctuating near the 50-day moving average, which acts as short-term support/resistance.
Key Support: The $163–165 range aligns with the ascending trendline.
Key Resistance: $175–177 and then $185–190.
Short-Term Scenario (1–3 weeks)
Bullish Scenario:
If the price holds above the trendline ($163–165) and breaks $168.5, a rise to $175 is expected. If $175 is broken, the next target is $182–185.
Target 1: $175
Target 2: $182–185
Stop Loss: Below $162
Bearish Scenario:
If the trendline is broken and the price consolidates below $162, a drop to $155 is possible, and in the worst case, it could reach $138–140.
Target 1: $155
Target 2: $138–140
Stop Loss: Recovery and consolidation above $168
Long-Term Scenario (3–6 months)
Bullish Scenario:
If the upward trend continues and the $185–190 resistance is broken, the path toward the all-time high near $195–200 opens.
Mid-term Target: $185–190
Long-term Target: $195–200
Stop Loss: Losing support at $155
Bearish Scenario:
If the key support at $155 is broken and selling pressure continues, a corrective target around $137 is likely. This level is considered strong support on a larger timeframe.
Target 1: $155
Target 2: $137
Stop Loss: Recovery and consolidation above $175
Summary:
In the short term, traders should consider the $163–165 range as critical. Holding above it opens a growth opportunity to $175–185, but losing it could trigger a drop to $155 and $140.
In the long term, as long as support at $155 holds, the bullish trend remains dominant, and the $190–200 target remains active.
Long
Mean Reversion Setup: PM1. RSI in oversold region
2. Price likely to rebound back the the mean
Trade Rules:
Entry Trigger - RSI has cross below oversold region, enter limit buy at close price
Exit Trigger - Close at market when close price cross above exit trigger (Red Line)
Long
Test sell in PM strategy simulator at 160.08Testing a sell in the PM simulator with a trigger at 160.08, first target at 129.73 and second target at 109.44.
Short
Mean Reversion Trade: PM1. RSI in oversold region
2. Price likely to rebound back the the mean
Trade Rules:
Entry Trigger - RSI has cross below oversold region, enter limit buy at close price
Exit Trigger - Close at market when close price cross above exit trigger (Red step line)
Long