System1, Inc. (SST) – 4H Chart Technical ReportAnalysis Overview :
The share price of System1, Inc. (SST) has been in a general downward trend over the past several weeks, if not months. Recent activity, however, suggests a short-term bounce from lower support levels. While the higher timeframe (daily/weekly) structure remains bearish, the 4-hour chart indicates a possible window for a bullish countertrend trade. Below is a detailed look at the current setup.
Market Structure
Trend Bias
On the bigger picture, SST’s price has printed
System1, Inc.
No trades
No trades
In-depth trading ideas
SST - Breakthrough Uptrend / Testing only ??
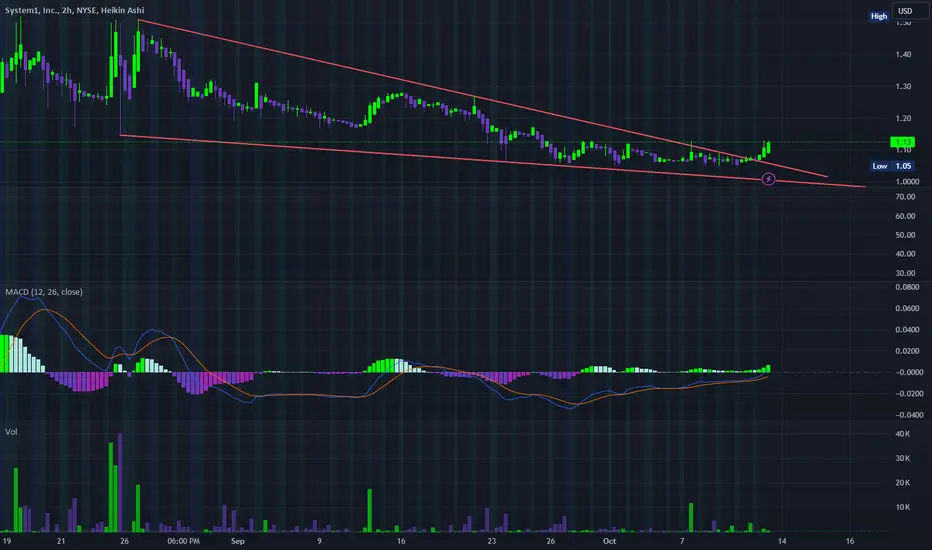
In the last 50 days price NYSE:SST never came across the redline, is it now the time for a uptrend breakthrough?
Notes
Low trading activity volume recently
RSI @ 50%
MACD moving back to Positive area
No recent news or changes
Latest news were more stock accumulation by Cee Holding Trust.
Position is set to
buy at 1.13
S/L @ 1.05
T/P @ 1.40 - 1.45
Let's see how this plays out next week!
NYSE:SST
Stock: SST (System1, Inc.) Buy Alert with Risk/Reward Ratio of 7Stock: SST (System1, Inc.) Buy Alert with Risk/Reward Ratio of 7
Buy Limit Price: $1.16
Stop Loss: $1.10
Take Profit 1: $1.49
Take Profit 2: $1.58
Welcome to a quick dive into System1, Inc., ticker symbol SST, a dynamic omnichannel customer acquisition platform operating across the globe, including key markets like the United States, the United Kingdom, Canada, and the Netherlands. With a skilled team of around 300, System1 not only owns and operates its websites but also engages in profitable
SST - GAMMA SQUEEZE, PT $40SST is about to breakout and price target will be $40. Chart broke all technicals such as 21,50, 100, 200 dates SMA. Medium and short term super trend crossed. Key level is $11.66 and $12.59. If it break this level, next stop would be $17 then parabolic will be triggered to reach $40.
bullishafter a 120% run up in price SST took a load off going back down 20% to 20.07 finding a loading zone where buyers are continuously flowing in. 20.07 seems to be holding well and chart seems to be looking upward. The volatility of the stock will dwindle down as volume decreases, but overall the stock should see an increase in value. SST has good fundamentals and good overall value as a company the chart is just adding to how bullish this company really is.