Visa (V) LONG — 4H ALMA Setup (WR 80%)█ SETUP
NYSE:V · 4H · long only.
(Context: Visa — global card / cross-border payments network.)
ALMA Averaging Strategy: ALMA 3 / σ2, SD band 2, min diff 4/3, 25% per bar, up to 4 adds, hard stop −10% from average entry.
Strategy Tester (V 4H):
Win rate 80% · profit factor 2.2 · max drawdown 44%
Avg winning trade +7.2% · avg losing trade −6.9%
Typical hold ~63×4H bars on winners — payments mega-cap mean-reversion sleeve
═
█ WHY NOW
Wednesday US cash — fresh 4H ALMA long on 09 Jul 17:30 UTC ~ $347.41 .
First lot on the template after a July drift off the ~$360 shelf — bar-close on the 4H sleeve, not a “everyone’s swiping plastic again” headline chase.
Hard stop zone −10% from fill ~ $312.67 . Exits follow Pine ALMA flip + min diff or the hard stop.
═
█ MACRO
Sector: V = payments toll road — cross-border volume, issuer economics, stablecoin / bank-ledger competition on the margin.
Tape (9 Jul): SWIFT’s 17-bank tokenized-deposit pilot and Sony Bank US stablecoin approval keep “who owns the rail” in the feed — sector beta for networks, not a single-name earnings call.
Execution is 4H ALMA on ~$347, not a fintech headline dip-buy.
═
█ OUTLOOK
Positive factors
- 80% WR · PF 2.2 · avg win +7.2% vs avg loss −6.9% on a deep 4H sample
- EMA — overheated below (fuel): 1H Cur S:15 vs Avg S:6.1 · +1.1% dev — stretched below-session on the entry ladder
- SMC — demand at fill: 1D bull FVG enter ~$347.53 · bounce B62% Br38% (n=500)
- SMC — execution TF: 4H bull FVG enter ~$347.52 · B58% Br42% (n=1123) on the bar tag
Negative factors
- EMA — overheated above (chase): 4H Cur L:33 vs Avg L:6.3 · −2.0% dev — long time above EMA on the working TF
- ALMA — OVERHEAT-L: 3D L:7 vs LAvg:3.6 — stretched above the slow band; poor add quality if price extends
- TL AI — bear geometry: Descending Triangle (Expanding) · Br83% B17% (n=12) — pattern history favors break, not bounce
- SMC — weekly ceiling: 1W bear FVG zone ~$362 · Br55% — overhead supply on the July shelf
Takeaway: the 80% 4H template, 1H below-EMA stretch, and daily/4H bull FVG tags support a disciplined bar-close long at ~$347, but 4H time-overheat above EMA, 3D OVERHEAT-L, and expanding-triangle geometry cap upside — payments-rail grind, not a clean discount rip; nominal risk stays on −10% / Pine exit.
Base case: 4H ALMA holds ~$340–355 · bull FVG shelf absorbs dips · slow mean-reversion toward the July range.
Bear case: lose 4H ALMA · Br83% triangle geometry wins · flush toward hard stop ~$312.67 from ~$347 entry.
Chart: NYSE:V 4H — ALMA Averaging Strategy.
Educational idea. Live position — past backtest ≠ future results. NFA.
In-depth trading ideas
LONG RUN INVESTMENT
Visa Inc. remains one of the structurally important companies within the global digital payments ecosystem, supported by strong network effects, global transaction volume, and long-term secular growth in electronic payments.
From a long-term investment perspective, exposure to companies with durable business models and scalable cash-flow generation may provide more stability across changing market cycles. However, beyond technical setups and price action, developing a fundamental understanding of the underlying business remains essential before considering any investment position.
In the case of Visa, investors should closely monitor:
• Revenue growth consistency and transaction volume trends
• Global consumer spending dynamics
• Competitive positioning within digital payments infrastructure
• Regulatory developments affecting cross-border transactions and fees
From a portfolio management standpoint, capital allocation and risk exposure remain equally important as entry timing. Even fundamentally strong companies can experience periods of elevated volatility, valuation compression, or macro-driven drawdowns.
A disciplined approach may include:
• Gradual position building instead of aggressive entries
• Maintaining defined portfolio exposure limits
• Monitoring broader market liquidity and interest-rate conditions
• Aligning investment horizon with long-term business fundamentals rather than short-term market noise
While the company continues to demonstrate strong structural characteristics, all investment decisions should be supported by independent research, risk management discipline, and personal financial objectives.
This analysis reflects a personal market perspective for educational and informational purposes only and should not be interpreted as financial advice or a solicitation to buy or sell securities.
V | May, 2026 | Continued stock growth- Timeframe: Weekly
- Trade type: Buy stop order
- Price: 331.67
- Take Profit: Open
- Stop Loss: 320.90 (-3.30 %)
Idea: Long on a breakout above last week's high — bullish momentum continuation.
Entry: Buy stop above last week’s high.
Stop-loss: Below the low of the same candle.
If the weekly candle closes below this level, the trade is invalidated.
Take Profit: Trailing stop following the lows of new weekly candles.
👉 Pionex | 200+ U.S. stock tokens | xStocks
Feel free to like and share your thoughts in the comments! ❤️
VISA 2026 - VENDA CURTO PRAZO ou MANTERVISA 2026 - VENDA CURTO PRAZO ou MANTER
A technical sock analysis evaluates the product’s material composition, construction parameters, biomechanical performance, thermal regulation, moisture management, durability, and user comfort under defined conditions of use. The analysis typically considers fiber content, yarn structure, knit density, elasticity, compression behavior, abrasion resistance, seam placement, cushioning zones, and dimensional stability after washing.
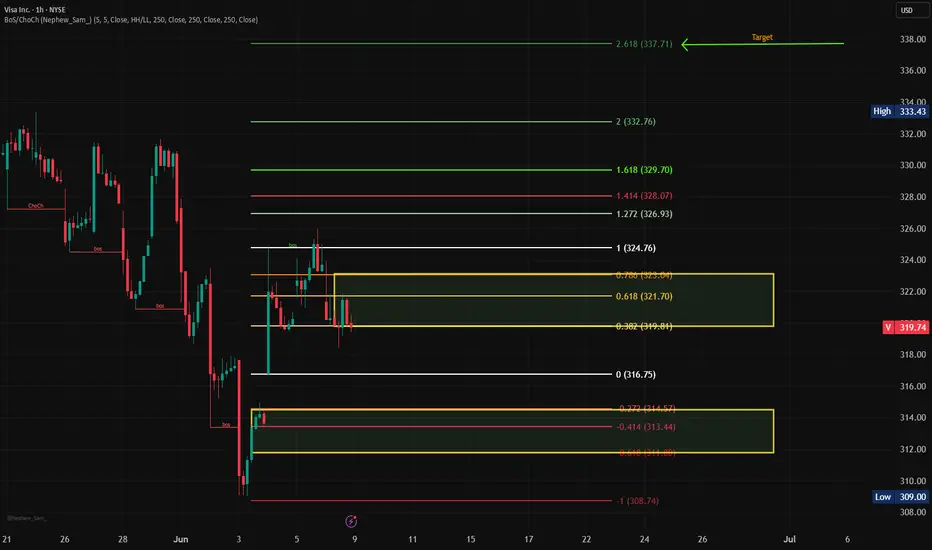
Visa #VI analyzed where all the liquidity that the institutional investors may target is.
Once I determined they were all taken.
I then waited for a change of direction (CHOD).
To then execute!
I calculate the target by measuring the bullish movement before the pullback, and I believe it will go up there IA!
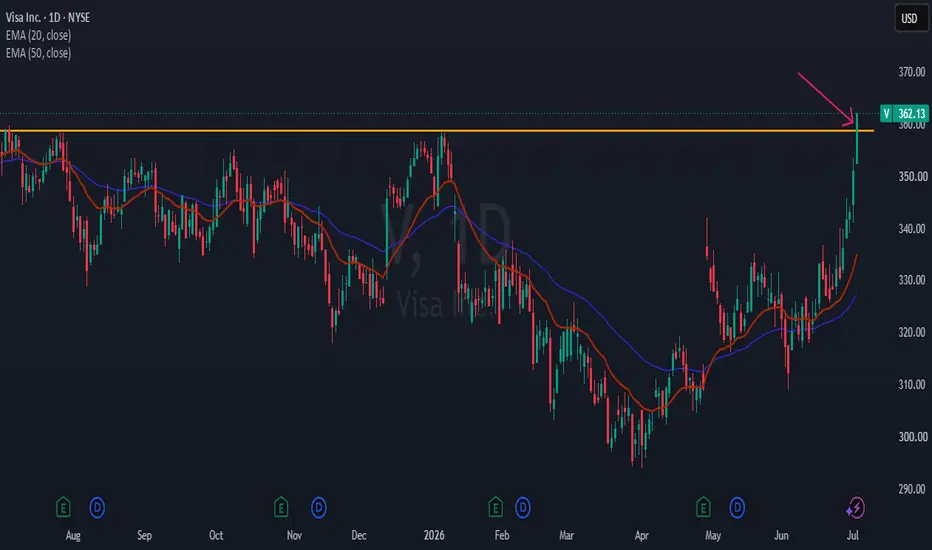
Visa Breaks Out Above Key Resistance as Momentum AcceleratesVisa has decisively broken above a major resistance level, reinforcing its strong bullish trend. The stock continues to make higher highs and higher lows while trading above its well-aligned 20-day and 50-day moving averages, signaling sustained upward momentum.
Visa Inc. is a $682.30 billion market-cap company that provides digital payment services worldwide. The company facilitates global commerce by enabling the transfer of value and information among consumers, merchants, financial institutions, businesses, strategic partners, and government entities. Its products and services include debit cards, credit cards, prepaid solutions, commercial payment products, and a global automated teller machine (ATM) network.
Visa is a wide-moat company that has delivered consistent revenue growth over the last three quarters, while EPS increased in two of the last three quarters. The company boasts exceptional profitability, with operating and net margins of 68% and 53%, respectively. It also generates strong returns, with ROE of 60% and ROA of 39%. Its financial position remains solid, supported by a current ratio of 1.1x and a debt-to-equity ratio of 0.7x.
V: Visa's Bullish Momentum – 200-Day MA Breakout Confirmed📌 TRADING IDEA: V (Visa Inc.)
NYSE: V
Strategy: Swing Trading / Position Trading
Timeframe: 2 – 8 Weeks
⚙️ Trade Configuration
Concept Level
Entry $342.90
Stop Loss (SL) $327.79 (-4.4%)
Take Profit (TP) $375.80 (+9.6%)
Risk/Reward Ratio ~2.2 : 1
Estimated Probability 70% – 75%
🔍 Company Overview
Visa Inc. (V) is the world's largest payment technology company, facilitating digital transactions across more than 200 countries. With a market capitalization of $613 billion, a P/E ratio of 29.78, and a beta of just 0.77, Visa represents a high-quality, low-volatility financial infrastructure play.
📊 Fundamental Analysis
Q2 2026 Results (released April 29, 2026) – Record-Breaking Quarter:
Net Revenue: $11.23 billion, **+17% YoY** – the strongest growth since 2022, beating estimates by $480 million
GAAP Net Income: $6.0 billion, +32% YoY
GAAP EPS: $3.14, +36% YoY
Non-GAAP EPS: $3.31, **+20% YoY**, beating the $3.10 consensus
Key Catalysts:
$20 Billion Share Buyback Authorization – signaling strong confidence in future cash flows
Value-Added Services Growth – CEO Ryan Mclnerney reiterated that VAS offers a larger opportunity than consumer payments, driving margin expansion
Quarterly Dividend: $0.67 per share (~0.80% yield)
Valuation:
Forward P/E: ~24.1x
GF Value™: $402.07 – Modestly Undervalued
GF Score™: 94/100 (very high quality)
Analyst Consensus (39 analysts polled by S&P Global):
Consensus Rating: Strong Buy
Average Price Target: $398.83 (+20.7% upside from current levels)
Target Range: $330 – $450
Notable Targets: Bernstein $450, Wells Fargo $412, UBS $410, Oppenheimer $403
📈 Technical Analysis
Recent Price Action (June 29, 2026):
Visa surged +2.42% to $344.36**, with an intraday high of **$345.80 – pushing near 52-week highs
The stock opened at $338.54 and steadily climbed, breaking above **key moving averages** and the **upper Bollinger Band at $336.71**
From analisis_pro_acciones (22).xlsx (June 29, 2026):
Indicator Level
Daily Recommendation Buy
Daily Trend Bullish
4H Recommendation Buy
4H Trend Bullish
1H Recommendation Buy
1H Trend Bullish
Fundamental Score 2.5 / 5
Technical Score 3.0 / 3 (perfect)
Pro Score 6.5 (Buy)
Key Technical Levels:
Support (SL): $327.79 – below the 200-day moving average ($328.71) and recent breakout level
Immediate Resistance: $345 – $350 (breakout confirmation zone)
Major Resistance (TP): $375.80 – within analyst target range
52-Week High: $359.66
Technical Indicators (as of June 29, 2026):
RSI: 62.94 – Bullish zone, not yet overbought, room for further upside
MACD Histogram: 0.94 – Positive and expanding, confirming accelerating bullish momentum
30-Day MA: 326.03 – Price well above, strong short-term momentum
200-Day MA: 328.71 – Price has broken above the long-term baseline, signaling a potential trend reversal
Bollinger Upper Band: 336.71 – Price trading above, suggesting strong breakout velocity
Interpretation:
The technical setup is decisively bullish across all three timeframes (Daily, 4H, 1H) with perfect alignment – a rare occurrence that suggests strong institutional conviction
The stock has cleared the 200-day MA at $328.71, a critical threshold that often triggers institutional buying
With RSI at 62.94, there is no immediate overbought warning, allowing for continued upside toward the 52-week high of $359.66 and beyond
🛡️ Risk Management
Position sizing: Risk no more than 1.5% – 2% of total capital.
Risk per trade: Entry – SL = $15.11 per share (-4.4%).
Trailing stop: Once price breaks above $355, move SL to breakeven or higher.
Partial profit booking: Consider closing 50% at $360** (above 52-week high) and let the rest ride with a trailing stop toward **$375.80.
⚠️ Key Risks to Monitor
Breakdown risk: A breakdown below $328 would invalidate the bullish thesis
Sector rotation: Any rotation out of financial technology could pressure the stock
Valuation concerns: The stock has a high P/E ratio of ~29.8, making it sensitive to earnings disappointments
Litigation escrow: Visa recently deposited $250 million into its U.S. litigation escrow account, which could signal ongoing legal risks
🧠 Final Thought
Visa combines record-breaking fundamental performance (17% revenue growth, 32% net income growth), a "Strong Buy" analyst consensus with an average price target of $398.83, and a perfect technical setup with bullish signals across all three timeframes.
The trade offers a ~2.2:1 risk/reward ratio with a well-defined stop loss at $327.79** – just below the critical 200-day MA breakout level. The TP of **$375.80 sits well within the analyst target range ($330 – $450), making it realistically achievable.
Ideal for: Swing trading and position trading with a 2 to 8-week horizon.
📝 This analysis is for educational and informational purposes only and does not constitute financial advice. Always perform your own due diligence and assess your risk tolerance before entering any trade.
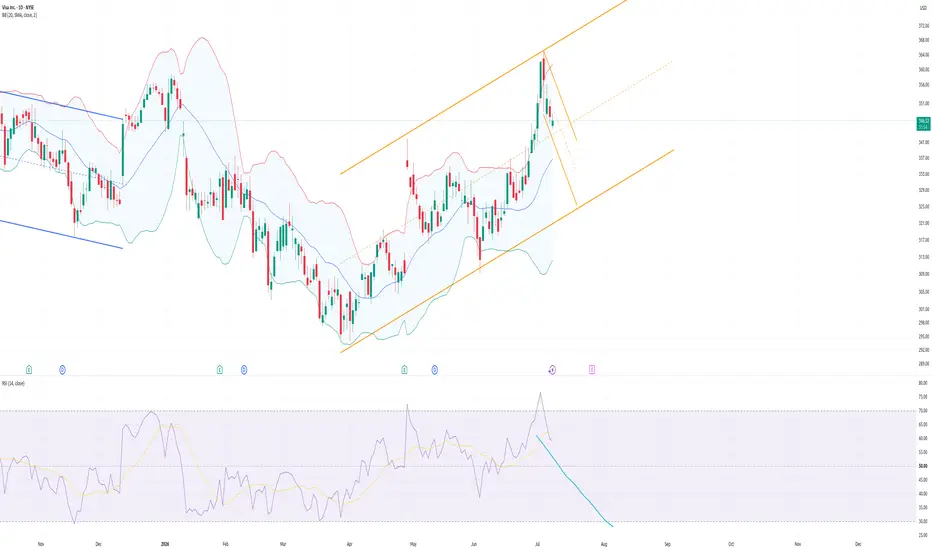
Mid-Range Compression – Early Long Trigger or Another Rejection?Visa (NYSE) | Mid-Range Compression – Early Long Trigger or Another Rejection? 💳📈
Hello TradingView family 👋❤️
Hope you’re all having a great trading week and managing risk wisely. Today we’re taking a look at Visa (V) — one of the strongest and most established companies in the global payments industry.
💳 About Visa
Visa is considered one of the leading payment infrastructure companies worldwide, benefiting from long-term growth in digital transactions, consumer spending, and financial technology adoption. Over the years, U.S. equities have maintained a strong structural uptrend, and Visa has consistently remained among the names attracting long-term investors due to its business quality, scalability, and market position.
📊 Technical Analysis – 4H Timeframe
Looking at the chart structure, price currently appears to be trading inside a larger range environment, and at this stage we are positioned around the mid-range area.
🟡 A noticeable resistance zone has formed above current price action, and this level is becoming the key decision point.
🟢 Bullish Scenario
If price manages to break and hold above the current resistance area, that could create an early long opportunity for momentum traders.
📈 Confirmation factors:
✅ Strong breakout candle
✅ Acceptance above resistance
✅ Higher low formation after breakout
✅ Increasing participation and continuation structure
If buyers maintain control, price could begin rotating toward higher range objectives.
🔴 Bearish Scenario
The downside scenario should not be ignored.
⚠️ Since price is still technically inside a broader range, resistance rejection remains possible.
Things to watch:
🔻 Failure to close above resistance
🔻 Rejection wicks near breakout area
🔻 Return back into the range
🔻 Loss of current support structure
If rejection develops, price may rotate back toward lower liquidity areas and support levels.
🎯 Trading Idea
Current structure suggests waiting for confirmation instead of anticipation.
📌 Early longs become more attractive only after a confirmed breakout
📌 Until then, range conditions may favor patience and selective execution
📌 Risk management remains more important than directional bias
🗳️ Community Poll
What do you expect next for Visa?
🟢 Breakout and continuation higher
🟡 More range consolidation
🔴 Rejection and move lower
Drop your vote and chart ideas below 👇
⚠️ Disclaimer
This analysis reflects personal chart interpretation and is provided for educational purposes only. It is not financial advice. Always perform your own research, manage risk properly, and never trade based solely on one analysis.
Tags:
#VISA #V #NYSE #Stocks #USMarket #TechnicalAnalysis #PriceAction #TradingView #Long #SwingTrading #Investing #RangeTrading #SupportAndResistance #MarketStructure #ForexCity
$V Sector Rotation!What it dew y'all?! I know its been a hot sec but yall know I cant stay away too long; HA!
Here's a trading Idea brought to you by #SmartBlackGirl!
$V. I wish i could site my source but i just be reading sometimes lol. Sector rotation to the FINANCIALS sectors. AI has the market on BLITZ, somebody has to fund it.
CHofCH measure with the fibs.
This is not financial advice, For educational Purposes ONLY.
Happy Trading Alerts Set!
The Ghost in the Green LightA trader seemingly sought relief,
To mask a deep and hidden grief.
"The market's cold, I'm all alone,"
He told a mate with heavy groan.
The desk mate laughed, "The charts are grim,
But you must look and learn from him!
He rides the waves, he feels no fright,
He leads the charge into the night.
He fights the tape, he prints the cash,
He stands completely through the crash.
He shows no weakness, sheds no tears,
A legend to his trading peers.
He shares the hype, he brings the cheer,
He slays the doubt and kills the fear.
The cure for your despair is clear,
The most prized bull in town is here!"
The trader stared into the space,
As warm tears tracked across his face.
He shook his head, his posture broke,
And choked on every word he spoke.
The trader wept, his secret out:
"I am the bull you speak about."
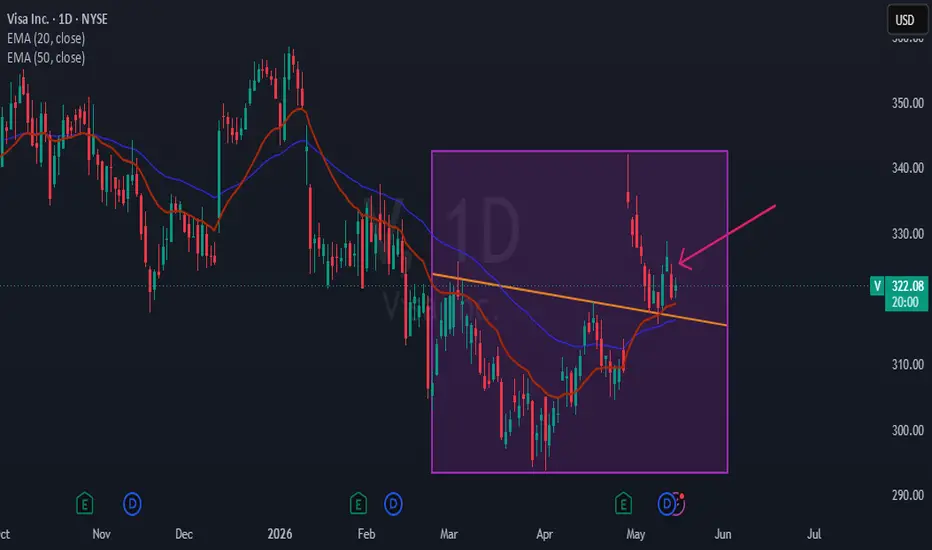
Visa Pullback Offers Fresh Entry OpportunityFollowing a strong upside gap, Visa Inc. has retraced to a key support zone that previously acted as resistance, where buying interest is beginning to emerge again. The stock appears to be establishing the early stages of a renewed uptrend as price action stabilizes around this level.
Visa Inc. is a $605.67bn market cap company engaged in the provision of digital payment services. The company facilitates global commerce through the transfer of value and information among consumers, merchants, financial institutions, businesses, strategic partners, and government entities worldwide. Its offerings include debit and credit cards, prepaid products, commercial payment solutions, and global ATM services.
Visa maintains a wide economic moat supported by its dominant global payment network and consistent financial performance. The company has delivered stable growth in both revenue and earnings per share in the last five years. Profitability remains exceptionally strong, with return on equity (ROE) and return on invested capital (ROIC) standing at 60% and 39%, respectively. Operating margin and net margin are robust at 68% and 53%, while a current ratio of 1.1x and debt-to-equity ratio of 0.7x reflect solid financial stability.
V Long — V earnings gap re-rating confirmed with institutional cSetup: V gapped up ~9% on earnings, printing a massive volume bar (4.7M shares in the first hour) that dwarfs anything seen on the 4h chart since January. The 4h trend had been a controlled downtrend from 350 to the 295 lows, and this earnings gap recaptures multiple months of distribution in a single session. On the 1h, price opened at 336.4, ran to 342, pulled back to 333.79, and is now consolidating just above the gap open at ~338 — a healthy absorption pattern. The 340 level is the immediate supply zone; a hold above 333-334 (gap open shelf) keeps the thesis intact.
Flow: Options flow is overwhelmingly call-dominated — call/put premium ratio of 13:1 and volume ratio over 5:1. Deep ITM calls on the 310 and 315 strikes across May-15 and weekly expirations signal institutional conviction on upside continuation, not just short-term speculative flow. The bullish analyst actions (BMO raise, Cantor reiterate) reinforce that this is a fundamental re-rating, not a one-day pop. The single notable bearish trade (335P BTO, May-08) is a near-term hedge consistent with FOMC vol hedging, not a directional fade. FOMC is the primary risk — vol compression into the decision followed by expansion after is the base case, but the idiosyncratic earnings driver should insulate V from broad tape damage.
Plan: Stop is placed below the intraday pullback low and the gap-open shelf — a close back into the low 333s would indicate the gap is filling and the re-rating thesis is broken. Target is the prior HTF resistance zone near 350 that acted as the breakdown level in early January — the natural magnetic level for a post-earnings recovery and a clean R/R above 2. If FOMC creates a broad selloff that drags V below 333 on heavy tape volume, exit without hesitation.
📍 Entry: 338.06
🛑 Stop: 333.00
🎯 Target: 350.00
⚖️ R:R: 2.36
Visa (V): 30% Upside SetupVisa (V) has been in a strong secular uptrend for over a decade, and the recent weakness over the past year represents a corrective phase largely driven by macro headwinds, namely higher interest rates, valuation compression across large‑cap quality stocks, and a broader market rotation rather than any deterioration in Visa’s underlying business. Technically, price has now completed a clean ABCD (1:1) measured move to the downside, signaling the maturity of the pullback, and is trading into a key confluence zone: prior resistance now acting as support, the rising long‑term trendline, and the 0.382 Fibonacci retracement. This area typically attracts higher‑timeframe buyers, and while a minor sweep lower to retest structure support is possible, the overall setup suggests downside is limited. Historically, Visa’s pullbacks tend to recover to prior highs within a few months, and given the extended nature of this correction, a recovery over roughly six months is reasonable, implying potential upside of ~30%. This technical setup is strongly supported by fundamentals: Visa is a dominant global payments network with ~50% profit margins, powerful network effects, inflation‑hedged revenues, manageable debt, ongoing share buybacks, and durable cash flows, making this pullback a high‑probability mean‑reversion opportunity within a long‑term uptrend.
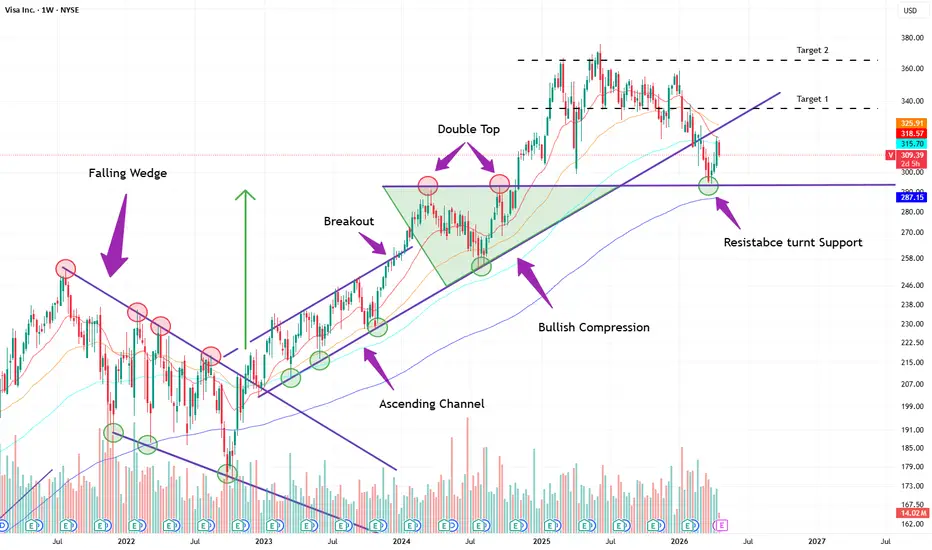
VISA (V): Bull Run IncomingVISA (V) - Resistance Turned Support After Multi-Year Pattern Completion
Timeframe: 1-Week | Bias: Bullish
THE TECHNICAL STORY
What you're looking at on Visa is a textbook multi-year pattern sequence that has been playing out with remarkable precision since the 2022 bear market lows.
Stage 1 - Falling Wedge (2021-2022)
The bear market decline formed a clean falling wedge with lower highs and lower lows converging toward a tight apex. The red circles marking the highs and the green circles marking the lows show the compression perfectly. This is a classically bullish reversal pattern (the tighter the wedge, the more explosive the eventual breakout.).
Stage 2 - Breakout & Ascending Channel (Late 2022-2024)
December 2022 marked the inflection point. Price broke decisively above the falling wedge with a strong momentum candle, confirmed by the volume surge visible at the base. What followed was an ordered ascending channel (a series of higher highs and higher lows) respecting both the upper and lower trendlines cleanly. The green circles along the channel lows show each successful retest of support.
Stage 3 - Bullish Compression (Mid 2024)
Inside the ascending channel, price formed a bullish compression triangle (higher lows converging toward the key $300 horizontal resistance level). This pattern indicates accumulation with buyers becoming increasingly aggressive at each dip. The triangle resolved with a breakout to the upside, launching price toward the double top zone.
Stage 4 - Double Top (Late 2024-Early 2025)
Price reached the $360-370 zone twice, forming a double top. Both peaks were rejected at the same level, marked by the red circles, with declining momentum on the second attempt. The neckline at $300 horizontal support became the critical level to watch.
Stage 5 - Resistance Turned Support (Current)
This is the most important part of the chart right now. After the double top resolved with a pullback, price has returned to the $300 zone, which was previously the major resistance level going back to 2024. Classic technical analysis teaches that broken resistance becomes support, and that is precisely what appears to be happening. The green circle at the current price zone (~$309) shows price bouncing from this level with conviction.
THE BULL CASE
Two layers of support are converging at $295-305:
The $300 horizontal - former resistance, now support
The 200-period moving average (on the 1W chart)
Dual confluence at a key level after a healthy correction from the double top highs is one of the more reliable setups in technical analysis.
Target 1: $341 - the horizontal level visible on the right side of the chart, and the current price marker
Target 2: $360-370 - retest of the double top highs
Target 3: $400+ - measured move from the ascending channel breakout
THE BEAR CASE
A breach of the channel lower trendline would invalidate the bull thesis entirely.
Invalidation: Daily close below $292
CONCLUSION
Visa has built a multi-year technical foundation through a falling wedge, ascending channel, and bullish compression. The double top created a healthy correction that has created a solid price support zone. As long as $295-300 holds, the path of least resistance is higher. The current resistance-turned-support test is the pivotal moment, and so far, the bulls are defending it.
Our preferred confirmation will be price holding above the support and a bullish crossover of MACD over the Signal
Not financial advice. Technical analysis does not guarantee future performance.
If you enjoyed reading our idea please boost and follow to not miss any future publishments 🚀🚀🚀
Visa Testing Key Support As Market Awaits Bullish ConfirmationAfter a strong rebound from the November lows, Visa (V) experienced a sharp corrective move following news-driven pressure related to potential regulatory limits on credit card lending. The stock declined sharply from the 358 area, shifting the short-term structure into a corrective phase rather than an impulsive continuation.
From a technical standpoint, the move lower appears to be developing as a possible flat correction in wave B. Price action has now reached an important structural zone, with the 298 level standing out as key support. This area aligns with the previous wave four of a lesser degree, which often acts as a high-probability reaction zone in ongoing trends.
The decline into the 290–300 region is also forming a clear three-wave structure, suggesting that downside momentum may be approaching exhaustion. If this support area holds, it would strengthen the case that the broader pullback is corrective in nature within a larger bullish structure, rather than the start of a deeper reversal.
Going forward, confirmation for renewed bullish momentum would come with a break and sustained move above the 328 level. This would indicate that buyers are regaining control and that the correction phase may be complete.
Visa: A Global Payments Toll Booth Trading Near Intrinsic ValueExecutive Summary:
Visa remains one of the highest‑quality financial infrastructure businesses ever built. The company generates exceptional returns on capital through a capital‑light model supported by powerful network effects. However, at roughly $304 per share, the stock trades close to reasonable intrinsic value estimates around $300 to $325. Margin of safety verdict: insufficient. The business is extraordinary; the valuation is merely fair.
One Stock, Dozens of Voices:
This analysis is not based on a single analyst’s view. CrowdWisdom aggregated 154 independent sources for V (128 professional trader videos (YouTube); 18 financial research articles (web); 1 live market intelligence feeds; 6 prior CrowdWisdom analysis snapshots (internal archive); 1 verified financial data checks (Yahoo Finance)) and synthesized the shared thesis: where traders, investors, and researchers broadly agree, where their views diverge, and what the market might be overlooking.
The material was then stress‑tested by placing opposing views side by side: a bull case, a bear case challenging the consensus, and an assessment of what expectations already appear embedded in the current price. Financial metrics were cross‑checked against live market data.
What follows highlights where opinion converges, where it splits, and whether the stock offers any real margin of safety at today’s price.
Business Quality and Moat Durability:
Visa is often described as a toll booth on global commerce, and the comparison is largely accurate.
The company operates a two‑sided payments network connecting consumers, merchants, issuing banks, and acquiring banks. Each participant increases the network’s value for everyone else. As more consumers carry Visa cards, merchants have greater incentive to accept them. As merchant acceptance expands, banks issue more cards.
That reinforcing loop is the core of Visa’s network effect.
Several advantages underpin the moat.
The most important is global acceptance infrastructure. Visa’s rails are embedded in payment terminals, online checkout systems, bank issuing platforms, and cross‑border settlement infrastructure in more than 200 countries. Recreating that level of global acceptance would require enormous coordination across banks, merchants, and regulators.
Brand trust is another pillar. Payments demand reliability and security. Consumers tend to rely on familiar payment brands, while merchants prefer methods that rarely fail authorization.
Scale also matters. Visa processes massive transaction volumes every year. The resulting data strengthens fraud detection, improves authorization speed, and refines risk modeling. The more transactions that move across the network, the smarter the system becomes.
There are also ecosystem‑level switching costs. Banks build issuing systems around card networks, merchants configure terminals around acceptance networks, and payment processors integrate deeply into these rails. Replacing that infrastructure would be costly and disruptive.
Moat assessment: STABLE.
The moat does not appear to be widening materially. Governments and banks are experimenting with alternative payment rails, including real‑time bank transfer networks. But replacing Visa entirely would require coordinated changes across financial institutions, merchants, regulators, and consumers. That structural inertia offers meaningful protection.
Return on Invested Capital (ROIC):
Visa’s financial profile often resembles that of a software platform more than a traditional financial institution.
ROIC has consistently exceeded 30 percent in recent years, with a five‑year average near 32 percent. Those figures place Visa among the most capital‑efficient large companies in the world.
The main reason is low capital intensity. Historically, capital expenditures have represented only about 6 percent of revenue. Building and maintaining a payment network requires infrastructure investment, but once the system is in place, additional transactions require very little incremental capital.
The economics are powerful. A high‑margin transaction network that demands limited reinvestment can produce extraordinary incremental returns on capital.
The key question for long‑term investors is whether incremental ROIC can stay this high.
Future capital requirements could rise modestly. Visa continues investing in cybersecurity, tokenization infrastructure, real‑time payments capabilities, and value‑added services. If these investments raise capital intensity meaningfully, incremental ROIC could drift lower.
Even so, a decline from 30 percent to the low 20 percent range would still represent exceptional capital efficiency relative to most global companies.
Quality of Earnings:
Visa’s reported earnings translate cleanly into real cash generation.
Free cash flow currently approaches $18 to $21 billion annually depending on the measurement period, with free cash flow margins around 31 percent. Importantly, free cash flow and net income remain broadly aligned.
That alignment suggests earnings are not being materially inflated by accounting adjustments or aggressive capital assumptions.
The capital‑light structure reinforces this. With capital expenditures typically under 10 percent of revenue and often closer to 6 percent, a large share of operating profit converts directly into cash.
There are no obvious warning signs of deteriorating earnings quality. Working capital needs are modest, and the business does not rely heavily on aggressive accrual accounting.
Quality of earnings verdict: high.
Capital Allocation Scorecard:
Visa’s capital allocation approach has historically followed three priorities.
First, maintain and expand the network infrastructure that underpins its competitive advantage.
Second, return excess capital to shareholders.
Third, invest in adjacent services such as fraud prevention, analytics, and payment security solutions.
The dividend remains relatively modest at roughly $1.08 per share annually, producing a yield near 0.65 percent. That low yield reflects management’s preference to reinvest capital or repurchase shares rather than distribute large dividends.
Share repurchases have been a major component of shareholder returns. Reducing the share count increases earnings per share and allows long‑term investors to capture more of the company’s cash generation.
The key issue is valuation discipline. Buybacks only create value when shares are repurchased below intrinsic value. Repurchasing stock at elevated valuations can simply recycle capital rather than compound it.
Overall capital allocation grade: A minus.
Customer and Revenue Concentration:
Visa does not face traditional customer concentration risk.
Its ecosystem includes millions of merchants and billions of cardholders worldwide. No single merchant or consumer accounts for a meaningful share of revenue.
However, the structure of the payments ecosystem introduces indirect concentration through issuing banks and large merchants.
Major financial institutions issue the majority of Visa‑branded cards. These banks have incentives to negotiate favorable fee structures and may experiment with alternative payment systems that lower card network costs.
Large merchants also hold bargaining power. Major retailers periodically push for lower transaction fees or encourage customers to use alternative payment methods.
So while Visa lacks direct customer concentration, it operates within an ecosystem where large banks and merchants retain meaningful negotiating leverage.
Management Alignment:
Institutional investors hold the majority of Visa’s shares, which is typical for large‑cap companies.
Insider ownership is relatively modest compared with founder‑led firms, though this is common for mature infrastructure businesses. Executive compensation is generally tied to revenue growth, operating margin performance, and earnings expansion.
Those incentives broadly align management with shareholder outcomes, although they may also encourage short‑term earnings optimization or aggressive share repurchases when valuations are elevated.
Large insider purchases have been limited in recent periods. That absence is not necessarily negative, but it does reduce the signal that management views the shares as deeply undervalued.
10-Year Durability Test:
Forecasting the payments industry ten years ahead requires humility. Payment infrastructure tends to evolve slowly, but it is not immune to change.
Several structural forces could reshape the landscape.
Government‑sponsored real‑time payment systems are expanding globally. Systems such as FedNow in the United States and similar networks elsewhere enable direct bank‑to‑bank transfers without relying on card networks.
Open banking initiatives may also reduce dependence on card rails by allowing fintech applications to initiate direct account transfers.
Blockchain‑based settlement networks and stablecoins could eventually offer alternatives for cross‑border payments. Adoption remains limited today, but technological progress may reduce the cost of global settlement over time.
Regulation is another ongoing risk. Governments frequently examine interchange and network fees. If regulators impose stricter caps, Visa’s take rate could decline.
Even with these pressures, payment infrastructure historically evolves through layering rather than replacement. Many new payment experiences still rely on existing card networks beneath the user interface.
Durability assessment: high but not guaranteed. The network effect and deeply embedded infrastructure provide resilience, but regulatory and technological forces could gradually pressure the economics.
Multi-Year Thesis (3 to 7 years):
Base Case (60 percent probability):
Assumptions:
Global consumer spending grows modestly.
Cash continues to shift toward digital payments.
Visa maintains current take rates with minor regional fee pressure.
ROIC declines slightly but remains above 25 percent.
Estimated intrinsic value in five years: roughly $360 to $400 per share assuming steady cash flow growth and stable valuation multiples.
Bull Case (25 percent probability):
Assumptions:
Cross‑border travel and global commerce expand strongly.
Visa scales high‑margin value‑added services such as fraud analytics, tokenization, and advisory services.
Operating leverage expands margins slightly.
Estimated intrinsic value: $450 to $500 per share.
Bear Case (15 percent probability):
Assumptions:
Real‑time bank payment systems capture meaningful share in domestic transactions.
Regulatory action caps network fees in major markets.
Gross margins decline toward 70 percent over time.
Estimated intrinsic value: roughly $220 to $250 per share.
Probability‑weighted intrinsic value across scenarios clusters near $300 to $325 per share.
Margin of Safety Verdict:
At approximately $304 per share, Visa trades very close to estimated intrinsic value.
For disciplined value investors, that matters.
A margin of safety typically requires purchasing shares at least 20 percent below intrinsic value to protect against modeling errors and unforeseen shocks.
Visa currently offers little such buffer. Investors today are paying a fair price for a great business rather than acquiring a bargain.
This does not imply the stock will perform poorly. It simply means the opportunity does not offer particularly asymmetric upside relative to risk.
Peak Margin Stress Test:
Visa’s gross margin exceeds 80 percent, an extraordinary level for any global company.
Margins that high also create vulnerability to normalization.
If competitive pressure, merchant routing alternatives, or regulation pushed gross margins down toward 70 to 72 percent, operating income could fall approximately 15 to 25 percent due to operating leverage.
If that decline occurred alongside valuation multiple compression, the stock could fall roughly 25 to 35 percent even without a fundamental breakdown in the business.
Peak‑margin businesses often face this kind of normalization risk.
Valuation Framing:
Several valuation approaches point to similar conclusions.
A discounted cash flow model assuming mid‑single‑digit long‑term free cash flow growth produces intrinsic value estimates around $300 to $325.
An earnings multiple framework using growth‑adjusted multiples generates comparable valuation ranges.
Relative comparisons with other payment infrastructure companies also suggest Visa deserves a premium multiple because of its durability and capital efficiency.
Across methods, the takeaway is consistent: the stock appears fairly valued rather than deeply undervalued.
Perception vs Reality:
Perception:
Visa will benefit indefinitely from the shift from cash to digital payments.
Reality:
Digital payments will continue expanding, but the rails carrying those payments may diversify. Governments and banks have clear incentives to develop cheaper alternatives to card networks.
Why This May Be Misunderstood:
Many investors assume fintech apps and digital wallets compete directly with Visa.
In practice, most wallets still rely on Visa or Mastercard rails beneath the interface.
The real competitive threat would come from alternative settlement rails that bypass card networks entirely.
Three Measurable Things to Watch Next Quarter:
1. Payment volume growth relative to global consumer spending trends.
2. Network take rate stability. Sustained declines could indicate competitive pressure or regulatory action.
3. Gross margin trajectory. Any consistent decline below historical ranges would signal structural changes in the economics.
Historical Conviction Drift:
Over the past five years, markets have often rewarded “buy the dip” behavior in dominant large‑cap companies like Visa.
Technical commentary frequently highlights strong buying interest when the stock approaches the $300 region, reinforcing the perception of a durable price floor.
Valuation discipline, however, requires separating market psychology from intrinsic value. Past resilience does not guarantee future upside when valuation is already full.
Disconfirming Evidence:
The strongest argument against owning Visa today is straightforward.
The company already operates near peak profitability. Gross margins exceed 80 percent and ROIC exceeds 30 percent. Few businesses can expand margins meaningfully beyond those levels.
Investors are therefore paying a premium multiple for a mature infrastructure platform whose economics may already reflect peak conditions.
If alternative payment rails reduce Visa’s take rate even slightly, earnings growth could slow while valuation multiples compress.
In that scenario, long‑term shareholder returns could disappoint even if the underlying business remains fundamentally strong.
Risks:
Regulatory risk remains the most persistent threat. Governments may cap interchange or network fees.
Technological disruption could emerge if real‑time bank transfers or blockchain‑based systems gain widespread adoption.
Merchant pressure may increase as large retailers encourage cheaper payment alternatives.
Macroeconomic risk also matters. Payment volumes correlate with consumer spending and travel, particularly for high‑margin cross‑border transactions.
Summary:
Visa remains one of the most durable and capital‑efficient businesses in global finance.
Its global network, trusted brand, and capital‑light infrastructure generate exceptional returns on invested capital and strong free cash flow.
Investors still need to distinguish between owning a great business and making a great investment.
At approximately $304 per share, the stock trades close to reasonable intrinsic value estimates around $300 to $325. That leaves little margin of safety.
For long‑term value investors, the stock likely belongs on a watchlist rather than in a portfolio at today’s price. A meaningful market correction or a temporary earnings scare would probably offer a more attractive entry point.
Data Snapshot:
Metric: Current Price
Metric: Value
Current Price (V): $315.91
Market Capitalization: $609.09 billion
Shares Outstanding: 1,681,093,942
Trailing P/E: 29.66x
Forward P/E: 21.72x
Enterprise Value (EV): $607.54 billion
EV/EBITDA: 20.96x
Revenue (TTM): $41.39 billion
Gross Margin: 97.78%
Operating Margin: 68.30%
Free Cash Flow (FCF): $22.03 billion
FCF Yield: 3.62%
52-Week Range: $293.89 to $375.51
Sector: Financial Services
Industry: Credit Services
References:
This analysis reviewed approximately 1083 article sources and 239 video transcripts.
1. LinkedIn Finance Top Content. Long-term Value Investing. www.linkedin.com
2. Spencer Tom. Warren Buffett on Long Term Value Investing. www.spencertom.com
3. The Bull. Tips for Successful Long Term Investing. thebull.com.au
4. GETMONEYRICH. Value Investors: Their Long-Term Investment Strategy. getmoneyrich.com
5. FasterCapital. Value Investing: Leveraging Intrinsic Value for Long Term Returns. fastercapital.com - Leveraging-Intrinsic-Value-for-Long-Term-Returns.html
6. NIWS Institute. Value Investing Strategies for Long-Term Growth in India. niws.in
7. The Value Investor. Developing a Long-Term Mindset: The Key to Value Investing Success. www.thevalueinvestor.org
8. LinkedIn. Unlocking Long-Term Value: My Investment Thesis at Robust Capital. www.linkedin.com
9. Alphanome AI. The Role of Patience in Value Investing: Why Value Investors Must Have a Long-Term Mindset. www.alphanome.ai
10. Simply Ethical. The Value of Long-Term Investing. simplyethical.com
11. YouTube Channel tradingsimplified8158. Visa stock technical commentary. www.youtube.com
12. YouTube Channel Mark Meldrum. Macro market analysis commentary. www.youtube.com
13. YouTube Channel AreteTrading. Market volatility discussion. www.youtube.com
14. YouTube Channel Value-Investing. Visa business overview discussion. www.youtube.com
Disclaimer:
This analysis is for informational purposes only and does not constitute investment advice. Investors should conduct their own research and consult qualified financial professionals before making investment decisions.