New Zealand Dollar vs Canadian Dollar
No trades
No trades
In-depth trading ideas
NZD/CAD | Long-Term Support Under PressureNZD/CAD | Long-Term Support Under Pressure — Is a New Bearish Leg Developing?
Hello everyone, and welcome back to another TradingView market analysis! 👋📊
Today we are looking at NZD/CAD, a currency pair influenced by the monetary policies of the Reserve Bank of New Zealand and the Bank of Canada, as well as the performance of key commodities such as dairy and energy. 🌏💱
🧠 Fundamental Outlook
On the New Zealand side, the RBNZ raised its Official Cash Rate by 25 basis points to 2.75% in Septem
NZDCAD--LONG Monthly Bearish Structure & Double Bottom Corrective Setup
-- The current monthly candle is bearish, with price expected to deliver a corrective pullback up toward the August Low .
--On lower timeframes, a Double Bottom reversal pattern is currently forming directly at a key monthly support level.
--Anticipating a bullish pullback/retest toward overhead resistance as the Double Bottom structure completes..
NZDCAD H4 | Key Levels Traders Must WatchBased on the H4 chart analysis, we can see that the price is rising towards our sell entry level at 0.8092, which is a pullback resistance that aligns with the 38.2% Fibonacci retracement.
Our stop loss is set at 0.8150, which is an overlap resistance that is slightly below the 61.8% Fibonacci retracement.
Our take profit is set at 0.7988, which is a pullback support.
High Risk Investment Warning
65% of retail investor accounts lose money when trading CFDs with this provider. You should cons
NZDCAD SHORT Market structure bearish on HTFs 3
Entry at both Weekly and Daily AOi
Weekly Rejection At AOi
Daily Rejection At AOi
Previous Structure Point
Previous Structure point Daily
Around Psychological Level 0.80500
Touching EMA H4
H4 Candlestick rejection
Rejection from Previous structure
TP: WHO KNOWS!
Entry 120%
REMEMBER : Trading is a Game Of Probability
: Manage Your Risk
: Be Patient
: Every Moment Is Unique
NZDCAD: More to The Upside 🇳🇿🇨🇦
NZDCAD may rise even further after the yesteday's pullback.
I see a confirmed breakout of a resistance line of a horizontal range on a 4H.
Expect a bullish continuation to 0.8038
❤️Please, support my work with like, thank you!❤️
I am part of Trade Nation's Influencer program and receive a monthly fee for using their TradingView charts in my analysis.
NZDCAD--LONG
After a period of selling pressure, price action has reached a critical decision point—testing the demand zone right at the bottom boundary of the ascending channel.
Rather than breaking down, price is showing clear lower-timeframe rejection and early signs of a bullish reversal off channel support. Buyers are beginning to step in, indicating that the higher-timeframe uptrend is ready
Entry, Take Profit (TP) levels are clearly marked on the chart
NZDCAD On The Rise! BUY!
My dear friends,
My technical analysis for NZDCAD is below:
The market is trading on 0.8003 pivot level.
Bias - Bullish
Technical Indicators: Both Super Trend & Pivot HL indicate a highly probable Bullish continuation.
Target - 0.8019
About Used Indicators:
A pivot point is a technical analysis indicator, or calculations, used to determine the overall trend of the market over different time frames.
Disclosure: I am part of Trade Nation's Influencer program and receive a monthly fee for us
NZDCAD BUYYYYYYYYYYYYYYY📈 NZDCAD BUY SETUP 🔥
NZDCAD is showing bullish momentum, with buyers pushing price higher. I’m watching the pair closely for a potential buy opportunity as the bullish structure continues to develop.
🎯 BULLISH BIAS — WATCHING NZDCAD FOR THE NEXT BUY SETUP.
#NZDCAD #Forex #ForexTrading #BuySetup #Bullish #TradingView #ForexAnalysis
NZDCAD Bullish Trade Plan,NZDCAD has just started a new bullish trend in H4 and H1. In H1 timeframe, fibo has been applied and a buy limit order has been placed on 0.382 level. Since this is a start of a bullish trend, the chances for hitting the target is likely. If the market makes pull back and hits the buy limit order, then the trade would be ready for execution. A risk reward ratio of 1:1 has been used.
NZDCAD 4H – Bearish ContinuationHello Trading Fam! 👋
NZDCAD remains bearish, forming lower highs within a descending channel. Price is testing a key structural zone, showing signs of weakness. A confirmed break below this support area could signal further downside continuation towards the lower boundary of the channel.
Don’t forget to like and share your thoughts in the comments! ❤️
NZDCAD My Opinion! SELL!
My dear subscribers,
This is my opinion on the NZDCAD next move:
The instrument tests an important psychological level 0.7990
Bias - Bearish
Technical Indicators: Supper Trend gives a precise Bearish signal, while Pivot Point HL predicts price changes and potential reversals in the market.
Target - 0.7972
My Stop Loss - 0.8000
About Used Indicators:
On the subsequent day, trading above the pivot point is thought to indicate ongoing bullish sentiment, while trading below the pivot point in
NZD-CAD Bearish Breakout! Sell!
Hello,Traders!
NZDCAD is breaking below the horizontal supply area with strong bearish displacement, likely to retest the zone from beneath before continuation toward the marked downside target as sellers retain control.Time Frame 7H.
Sell!
Comment and subscribe to help us grow!
Check out other forecasts below too!
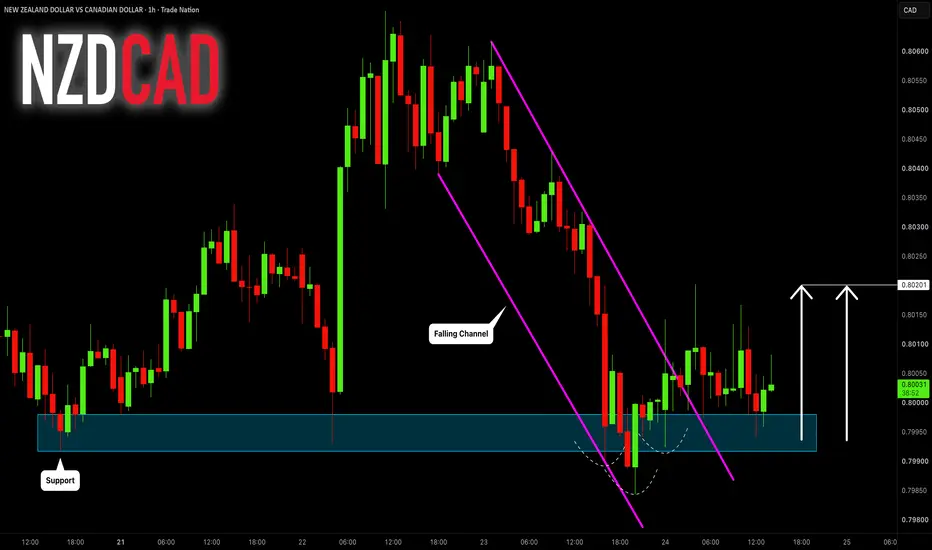
NZDCAD: Pullback From Support 🇳🇿🇨🇦
NZDCAD will likely pull back from a strong intraday support.
As confirmation, I see 2 bullish price action patterns:
an inverted head and shoulders and a falling wedge.
Goal - 0.802
❤️Please, support my work with like, thank you!❤️
I am part of Trade Nation's Influencer program and receive a monthly fee for using their TradingView charts in my analysis.
NZDCAD: Expecting Bearish Continuation! Here is Why:
Our strategy, polished by years of trial and error has helped us identify what seems to be a great trading opportunity and we are here to share it with you as the time is ripe for us to sell NZDCAD.
Disclosure: I am part of Trade Nation's Influencer program and receive a monthly fee for using their TradingView charts in my analysis.
❤️ Please, support our work with like & comment! ❤️
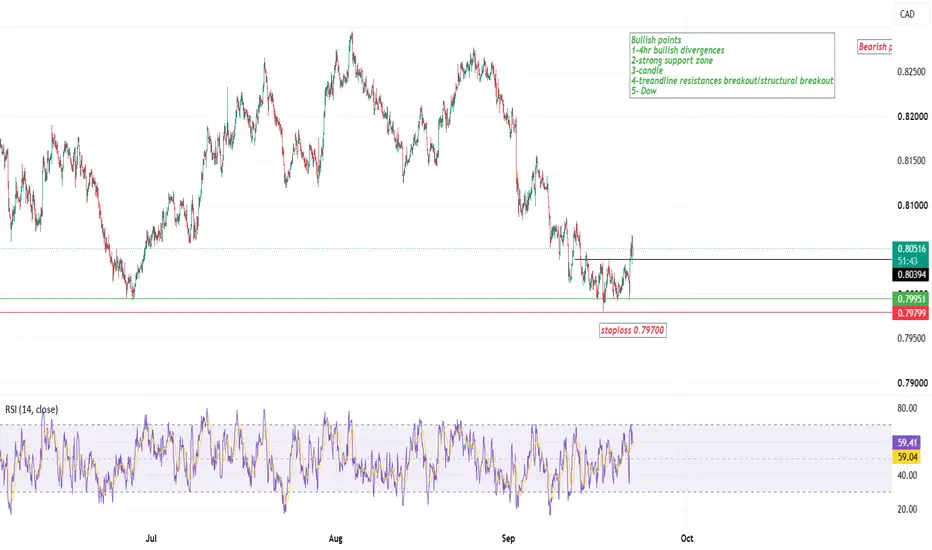
NZD/CAD Long Setup | 4H Analysis 1H ExecutionNZDCAD had been in a downtrend forming a series of lower highs and lower lows. At the two most recent swing lows price made a lower low while the RSI made a higher low creating bullish divergence and signaling that selling momentum was weakening.
I used the 4 hour chart to identify the setup and the 1 hour chart to time my entry. Price then broke above the most recent lower high which I treated as the neckline and confirmation for the long trade.
The trade targets a roughly 1:1 risk to reward
NZDCAD Will Go Lower! Short!
Please, check our technical outlook for NZDCAD.
Time Frame: 4h
Current Trend: Bearish
Sentiment: Overbought (based on 7-period RSI)
Forecast: Bearish
The price is testing a key resistance 0.802.
Taking into consideration the current market trend & overbought RSI, chances will be high to see a bearish movement to the downside at least to 0.798 level.
P.S
The term oversold refers to a condition where an asset has traded lower in price and has the potential for a price bounce.
Overbought ref