30.07.26 Daily ForecastGood day guys!!
Again, a super busy morning today and with a live webinar I also have to attend I had no time to record. Tomorrow I will be back with a video forecast for you guys before the weekend!
Pairs on watch -
FX:NZDJPY : I am currently long on this pair after price failed to sell to the downside multiple times. We have a larger 123 structure with an internal 123 as well, price sold off, failed to provide a bearish continuation and instead broke back to the upside. We then had a simple 123 impulse -> correction -> impulse on the 15M where I am now looking to manage into the highs for a 4-5% target. The higher timeframe looks great for the next impulsive leg to the upside, and clear highs above price could be reaching for.
New Zealand Dollar / Japanese Yen
No trades
No trades
In-depth trading ideas
NZDJPY - Range Support Back in FocusNZDJPY has been trading within a well-defined range, and we have been successfully trading both sides of this range over the past several months. 📊
📌 Price is now approaching the lower bound of the range, where a strong support zone comes into focus. As long as this support continues to hold, we will be looking for buy setups in line with the range structure.
This area has repeatedly attracted buyers in the past, making it a key level to monitor. Rather than buying blindly, we will wait for bullish price action confirmation before considering long positions.
Will buyers defend the range support once again, or is a breakdown finally around the corner? 🤔
⚠️ Disclaimer: This is not financial advice. Always do your own research and manage risk properly.
📚 Stick to your trading plan regarding entries, risk, and management.
Good luck! 🍀
All Strategies Are Good; If Managed Properly!
~Richard Nasr
Bullish rise?NZD/JPY could fall to the pivot, which is a pullback support and could bounce toward the 1st resistance.
Pivot: 92.42
1st Support: 91.46
1st Resistance: 93.54
Disclaimer:
The opinions given above constitute general market commentary and do not constitute the opinion or advice of IC Markets or any form of personal or investment advice.
Any opinions, news, research, analyses, prices, other information, or links to third-party sites contained on this website are provided on an "as-is" basis, are intended to be informative only, and are not advice, a recommendation, research, a record of our trading prices, an offer of, or solicitation for, a transaction in any financial instrument and thus should not be treated as such. The information provided does not involve any specific investment objectives, financial situation, or needs of any specific person who may receive it. Please be aware that past performance is not a reliable indicator of future performance and/or results. Past performance or forward-looking scenarios based upon the reasonable beliefs of the third-party provider are not a guarantee of future performance. Actual results may differ materially from those anticipated in forward-looking or past performance statements. IC Markets makes no representation or warranty and assumes no liability as to the accuracy or completeness of the information provided, nor any loss arising from any investment based on a recommendation, forecast, or any information supplied by any third party.
Bearish drop off?NZD/JPY has rejected off the resistance and could drop from this level to our take profit.
Entry: 94.85
Why we like it:
There is a pullback resistance level.
Stop loss: 95.41
Why we like it:
There is a pullback resistance level.
Take profit: 93.73
Why we like it:
There is a pullback support level that aligns with the 38.2% Fibonacci retracement.
Enjoying your TradingView experience? Review us!
Please be advised that the information presented on TradingView is provided to Vantage (‘Vantage Global Limited’, ‘we’) by a third-party provider (‘Everest Fortune Group’). Please be reminded that you are solely responsible for the trading decisions on your account. There is a very high degree of risk involved in trading. Any information and/or content is intended entirely for research, educational and informational purposes only and does not constitute investment or consultation advice or investment strategy. The information is not tailored to the investment needs of any specific person and therefore does not involve a consideration of any of the investment objectives, financial situation or needs of any viewer that may receive it. Kindly also note that past performance is not a reliable indicator of future results. Actual results may differ materially from those anticipated in forward-looking or past performance statements. We assume no liability as to the accuracy or completeness of any of the information and/or content provided herein and the Company cannot be held responsible for any omission, mistake nor for any loss or damage including without limitation to any loss of profit which may arise from reliance on any information supplied by Everest Fortune Group.
Bearish reversal setup?NZD/JPY is rising to the resistance level, which is a pullback resistance and could reverse from this level to our take profit.
Entry: 93.67
Why we like it:
There is a pullback resistance level.
Stop loss: 95.33
Why we like it:
There is a pullback resistance level.
Take profit: 91.98
Why we like it:
There is a pullback support level.
Enjoying your TradingView experience? Review us!
Please be advised that the information presented on TradingView is provided to Vantage (‘Vantage Global Limited’, ‘we’) by a third-party provider (‘Everest Fortune Group’). Please be reminded that you are solely responsible for the trading decisions on your account. There is a very high degree of risk involved in trading. Any information and/or content is intended entirely for research, educational and informational purposes only and does not constitute investment or consultation advice or investment strategy. The information is not tailored to the investment needs of any specific person and therefore does not involve a consideration of any of the investment objectives, financial situation or needs of any viewer that may receive it. Kindly also note that past performance is not a reliable indicator of future results. Actual results may differ materially from those anticipated in forward-looking or past performance statements. We assume no liability as to the accuracy or completeness of any of the information and/or content provided herein and the Company cannot be held responsible for any omission, mistake nor for any loss or damage including without limitation to any loss of profit which may arise from reliance on any information supplied by Everest Fortune Group.
NZDJPY Daily – Bullish BiasHello Trading Fam! 👋
The overall trend remains bullish. Price is pulling back into a key demand zone and rising trendline support. Wait for bullish confirmation in this area before looking for long opportunities targeting the range highs.
Don’t forget to like and share your thoughts in the comments! ❤️
Falling toward key support?NZD/JPY is falling toward the pivot, which is an overlap support that aligns with the 38.2% Fibonacci retracement and could bounce toward the 1st resistance.
Pivot: 93.77
1st Support: 93.08
1st Resistance: 94.85
Disclaimer:
The opinions given above constitute general market commentary and do not constitute the opinion or advice of IC Markets or any form of personal or investment advice.
Any opinions, news, research, analyses, prices, other information, or links to third-party sites contained on this website are provided on an "as-is" basis, are intended to be informative only, and are not advice, a recommendation, research, a record of our trading prices, an offer of, or solicitation for, a transaction in any financial instrument and thus should not be treated as such. The information provided does not involve any specific investment objectives, financial situation, or needs of any specific person who may receive it. Please be aware that past performance is not a reliable indicator of future performance and/or results. Past performance or forward-looking scenarios based upon the reasonable beliefs of the third-party provider are not a guarantee of future performance. Actual results may differ materially from those anticipated in forward-looking or past performance statements. IC Markets makes no representation or warranty and assumes no liability as to the accuracy or completeness of the information provided, nor any loss arising from any investment based on a recommendation, forecast, or any information supplied by any third party.
NZDJPY - Range Resistance Back in FocusNZDJPY has been trading within a broad range, with price repeatedly reacting to its upper and lower boundaries. 📊
Price is now approaching the upper bound of the range, where a strong resistance zone has rejected buyers on multiple occasions.
📌 As long as this resistance zone continues to hold, we will be looking for short setups, anticipating another move back toward the lower half of the range.
As always, rather than selling blindly into resistance, we will wait for bearish confirmation before considering any short positions.
Will sellers defend the upper boundary once again and trigger another leg lower? 🤔
⚠️ Disclaimer: This is not financial advice. Always do your own research and manage risk properly.
📚 Stick to your trading plan regarding entries, risk, and management.
Good luck! 🍀
All Strategies Are Good; If Managed Properly!
~Richard Nasr
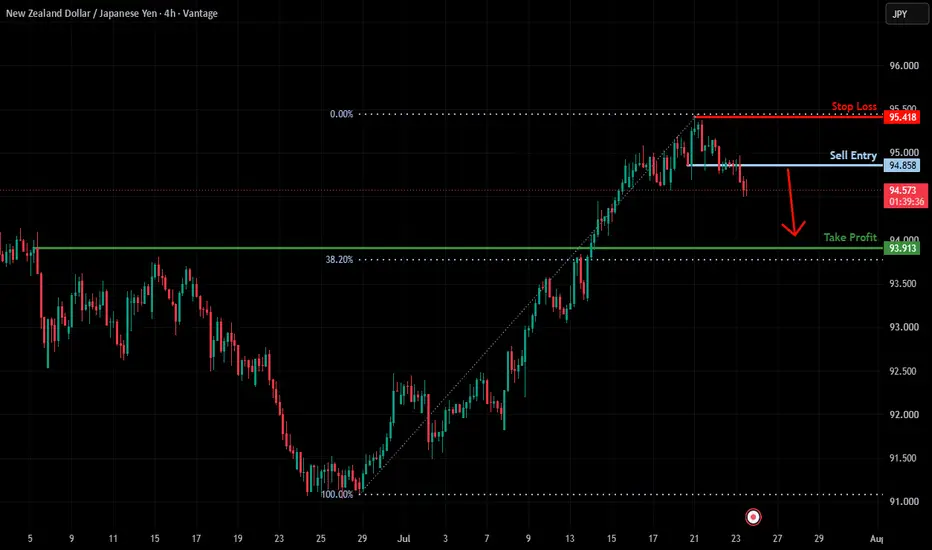
Risky short setup?NZD/JPY has reacted off the resistance level, which is a pullback resistance, and could potentially drop from this level to our take profit.
Entry: 94.85
Why we like it:
There is a pullback resistance level.
Stop loss: 95.41
Why we like it:
There is a pullback resistance level.
Take profit: 93.91
Why we like it:
There is a pullback support level that aligns with the 38.2% Fibonacci retracement.
Enjoying your TradingView experience? Review us!
Please be advised that the information presented on TradingView is provided to Vantage (‘Vantage Global Limited’, ‘we’) by a third-party provider (‘Everest Fortune Group’). Please be reminded that you are solely responsible for the trading decisions on your account. There is a very high degree of risk involved in trading. Any information and/or content is intended entirely for research, educational and informational purposes only and does not constitute investment or consultation advice or investment strategy. The information is not tailored to the investment needs of any specific person and therefore does not involve a consideration of any of the investment objectives, financial situation or needs of any viewer that may receive it. Kindly also note that past performance is not a reliable indicator of future results. Actual results may differ materially from those anticipated in forward-looking or past performance statements. We assume no liability as to the accuracy or completeness of any of the information and/or content provided herein and the Company cannot be held responsible for any omission, mistake nor for any loss or damage including without limitation to any loss of profit which may arise from reliance on any information supplied by Everest Fortune Group.
NZDJPY: Bullish Push to 95.318?FX:NZDJPY is eyeing a bullish continuation on the 4-hour chart , with price rebounding from support after recent consolidation, converging with a potential entry zone that could ignite upside momentum if buyers defend amid volatility. This setup suggests a rally opportunity, targeting higher resistance levels with 1:4.5 risk-reward .🔥
Entry between 94.475–94.558 (entry from current price with proper risk management is recommended). Target at 95.318 . Set a stop loss at a daily close below 94.400 , yielding a risk-reward ratio of 1:4.5 . Monitor for confirmation via a bullish candle close above entry with rising volume, leveraging the pair's momentum near support.🌟
Fundamentally , NZDJPY is trading around 94.58 in late July 2026.
For the New Zealand Dollar, one of the most important releases around July 24 is related to RBNZ communications or inflation expectations, where dovish signals would support NZD weakness.
For the Japanese Yen, key focus is on BoJ-related data or economic indicators, where any sign of continued loose policy would keep JPY under pressure and favor bullish NZDJPY. 💡
📝 Trade Setup
🎯 Entry (Long):
94.475 – 94.558
(Entry from current price is acceptable with proper position sizing and disciplined risk management.)
🎯 Target:
95.318
❌ Stop Loss:
• 4-hour candle close below 94.400
📈 Risk-to-Reward:
1:4.5
💡 Will buyers successfully defend the 94.475–94.558 support zone and push NZDJPY toward 95.318, or will sellers break support and invalidate the bullish setup? 👇
NZDJPY H4 | Bullish Continuation SetupThe price is falling to our buy entry level at 94.27, which is a pullback support that aligns with the 23.6% Fibonacci retracement.
Our stop loss is set at 93.72, which is an overlap support that aligns with the 38.2% Fibonacci retracement.
Our take profit is set at 95.03, which is a pullback resistance.
High Risk Investment Warning
Stratos Markets Limited fxcm.com Stratos Europe Ltd, fxcm.com CFDs are complex instruments and come with a high risk of losing money rapidly due to leverage. 69% of retail investor accounts lose money when trading CFDs with this provider. You should consider whether you understand how CFDs work and whether you can afford to take the high risk of losing your money.
Stratos Global LLC fxcm.com Losses can exceed deposits.
Please be advised that the information presented on TradingView is provided to FXCM (‘Company’, ‘we’) by a third-party provider (‘TFA Global Pte Ltd’). Please be reminded that you are solely responsible for the trading decisions on your account. Any information and/or content is intended entirely for research, educational and informational purposes only and does not constitute investment or consultation advice or investment strategy. The information is not tailored to the investment needs of any specific person and therefore does not involve a consideration of any of the investment objectives, financial situation or needs of any viewer that may receive it. Past performance is not a reliable indicator of future results. Actual results may differ materially from those anticipated in forward-looking or past performance statements. We assume no liability as to the accuracy or completeness of any of the information and/or content provided herein and the Company cannot be held responsible for any omission, mistake nor for any loss or damage including without limitation to any loss of profit which may arise from reliance on any information supplied by TFA Global Pte Ltd.
Stratos Trading Pty. Limited fxcm.com Trading FX/CFDs carries significant risks. FXCM AU (AFSL 309763), please read the Financial Services Guide, Product Disclosure Statement, Target Market Determination and Terms of Business at fxcm.com
24.07.26 Daily ForecastPairs on Watch -
FX:NZDJPY : I am still running live in this short position, some accounts were taken out for a breakeven through Asia session and some accounts stayed in. I will be monitoring and managing this position through today and have a take profit set at 3%, so lets see what happens!
FX:CADJPY : This is actually a hedge against my NZDJPY position above, as I am looking for the longs on this pair into the next high. I cannot be bias in my Yen direction and staying open minded with what price action is telling, right now on the higher timeframe this pair looks bullish. If we get 1H development and a completed base, I will look for a risk entry filtered to the 15M for a long and manage into the next main high.
FX:EURNZD : We can see on the higher timeframe a nice bullish sentiment starting to come in, however we are on the third daily candle where we know we can provide deeper pullbacks. On the lower timeframes price has shown its hand and given us a decent impulsive move for this pair, now similar to CADJPY it is all about 1H development. If we get a completion of the structure on the 1H timeframe I will look for a risk entry long.
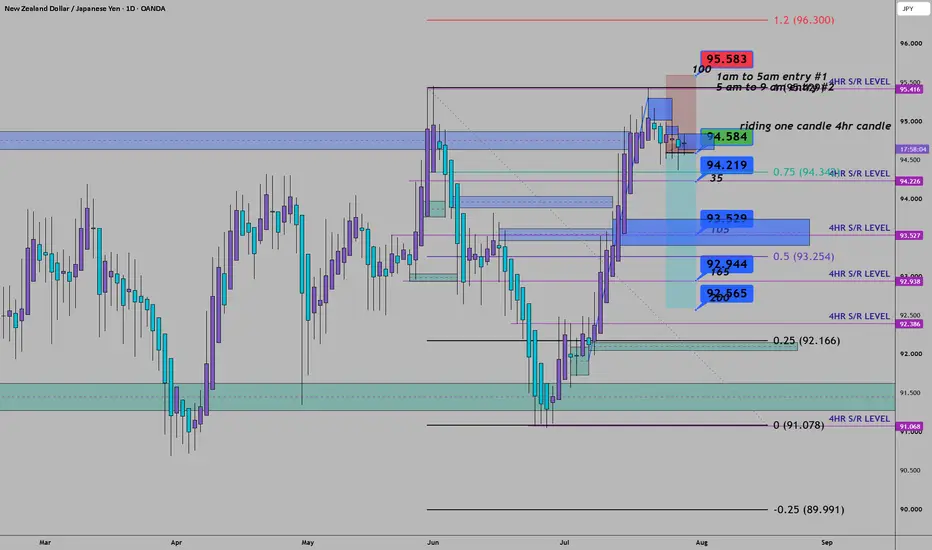
NZDJPY: Bearish Continuation & Short Trade
NZDJPY
- Classic bearish formation
- Our team expects fall
SUGGESTED TRADE:
Swing Trade
Sell NZDJPY
Entry Level - 94.827
Sl - 94.915
Tp - 94.684
Our Risk - 1%
Start protection of your profits from lower levels
Disclosure: I am part of Trade Nation's Influencer program and receive a monthly fee for using their TradingView charts in my analysis.
❤️ Please, support our work with like & comment! ❤️
NZDJPY - Long squeeze before a rally. Bullish trendFX:NZDJPY is consolidating following a distribution phase, while the broader trend remains bullish. The continued weakness of the Japanese yen is providing medium-term support for the pair
The Japanese yen remains under pressure, which continues to favor the New Zealand dollar. From a technical perspective, NZDJPY is maintaining its bullish structure while consolidating within the 94.59–95.35 range. A false breakout below support could shift the short-term imbalance back in favor of buyers and trigger the next leg higher
Resistance levels: 95.19, 95.35
Support levels: 94.59, 94.45
A false break below the 94.58–94.45 support zone, followed by a recovery back into the range and sustained consolidation above this key area, could become the technical catalyst for a continuation of the primary bullish trend
Best regards,
R. Linda
23.07.26 Daily ForecastPairs on Watch -
FX:NZDJPY : Currently live in a short position on this pair. We can see the isolated structure being a two touch with an internal approach on the 15M, one of my go-to setups. The higher timeframe has done the minimum to warrant the shorts to come in, and I am aware I will need to be on my management game if price approach the 1% mark at the lows and begins to reverse. At this point I will be at breakeven.
FX:GBPUSD : This pair looks really great for a little more develop back into the ray line value area but if we get the depth and potentially some internal structure, a 1H risk entry is highly likely. The DXY may pull back deeper into the next low which is fine, that will give this pair a chance to develop a little more and create depth for us to then get short.
FX:EURUSD : A little hedge with this pair in terms of the DXY going long earlier. If the DXY has completed its pullback and it starts to go long earlier, this pair could give us a great insurance entry for the sells that will be manageable into the low. I am using EU/GU and the DXY in line with each other monitor development into London session and look at the possibility of there being an earlier short entry.
NZDJPY H4 | Potential Bearish ReversalThe price is rising to our sell entry level at 93.72, which is an overlap resistance.
Our stop loss is set at 94.43, an overlap resistance.
Our take profit is set at 92.50, a pullback support.
High Risk Investment Warning
65% of retail investor accounts lose money when trading CFDs with this provider. You should consider whether you understand how CFDs work and whether you can afford to take the high risk of losing your money.
NZDJPY ANALYSIS 🟢 NZD/JPY Buy Limit Signal
Entry 1: 92.120
Entry 2: 92.208
Stop Loss: 91.610
Take Profit 1: 93.020
Take Profit 2: 94.410
📈 NZD/JPY is approaching a strong support zone, presenting a potential buy limit opportunity. The first target is set at 93.020, with an extended target of 94.410. If bullish momentum continues to strengthen, the pair could extend its rally beyond the second target.
Trade Management:
If the second entry at 92.208 is activated and price retraces to Entry 1 (92.120), close the first position and move the second position's stop loss to breakeven (B.E.). This strategy helps secure profits while allowing the remaining position to continue toward the final target.
Risk Disclaimer: Forex trading involves substantial risk. Always use proper risk management and never risk more than you can afford to lose.
NZDJPY Will Go Up! Long!
Here is our detailed technical review for NZDJPY.
Time Frame: 1h
Current Trend: Bullish
Sentiment: Oversold (based on 7-period RSI)
Forecast: Bullish
The market is approaching a significant support area 92.521.
The underlined horizontal cluster clearly indicates a highly probable bullish movement with target 92.913 level.
P.S
The term oversold refers to a condition where an asset has traded lower in price and has the potential for a price bounce.
Overbought refers to market scenarios where the instrument is traded considerably higher than its fair value. Overvaluation is caused by market sentiments when there is positive news.
Like and subscribe and comment my ideas if you enjoy them!