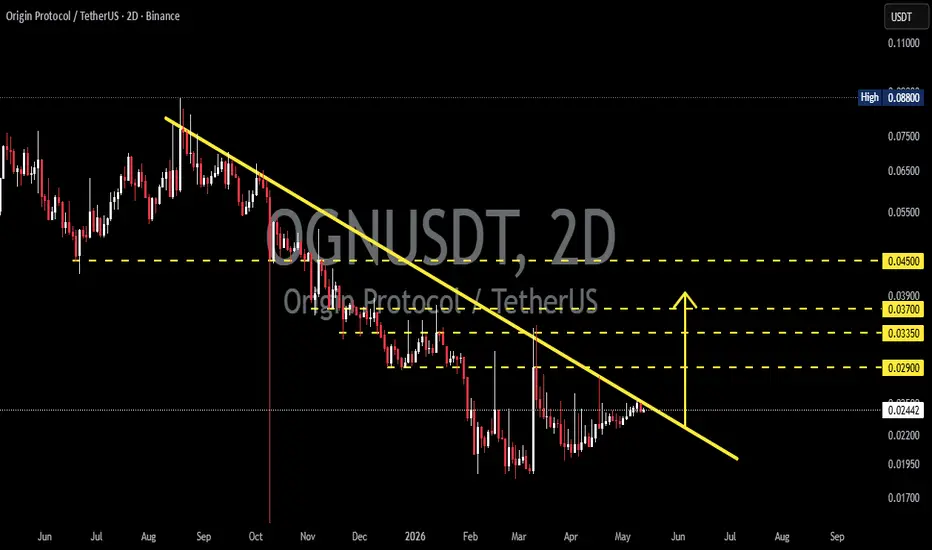
OGN/USDT — Breakout Incoming or Downtrend Continuation?OGN/USDT is still moving within a clear mid-term downtrend structure 📉, marked by a strong descending trendline 🔻 that has continuously pressured the price since the previous major peak.
However 👀, the chart is now starting to show signs of consolidation ⚡ and an attempt to build reversal momentum
#OGN#OGN is currently consolidating 📊 around the 0.02320 level after a decisive breakout from a falling wedge pattern. Traders are now looking for a potential move towards the indicated target price around 0.02725 🚀. Observing consolidation after a pattern breakout often provides opportunities for confi
OriginToken (OGN) ready for new bullish cycle —1,900%-3,000 PPI see a nice jump here. A nice suddenful jump. It is true that OriginToken (OGNUSDT) had no bull market in 2023, 2024 or 2025. It can be said that there was a one very long bear market or two bear markets with a period of rest in-between.
In 2021 OGN grew 3,000% in less than 4 months, some 105 days
OGN Retest at Key Demand Inside DowntrendOGN is trading within a clear descending channel on the daily timeframe, maintaining the overall bearish structure. After a strong rejection from the channel resistance, price has pulled back into a key demand / retest zone around 0.023 – 0.021, which aligns with Fibonacci support.
This area is now
#OGN Ready For a Massive Bullish Move | Must Watch For BullsYello, Paradisers! Is #OriginProtocol about to explode to the upside, or is this a bull trap in disguise waiting to liquidate the impatient? Let’s break down what’s brewing on #OGNUSDT:
💎After forming a clean ascending channel, #OGN has been respecting both the ascending resistance and ascending su
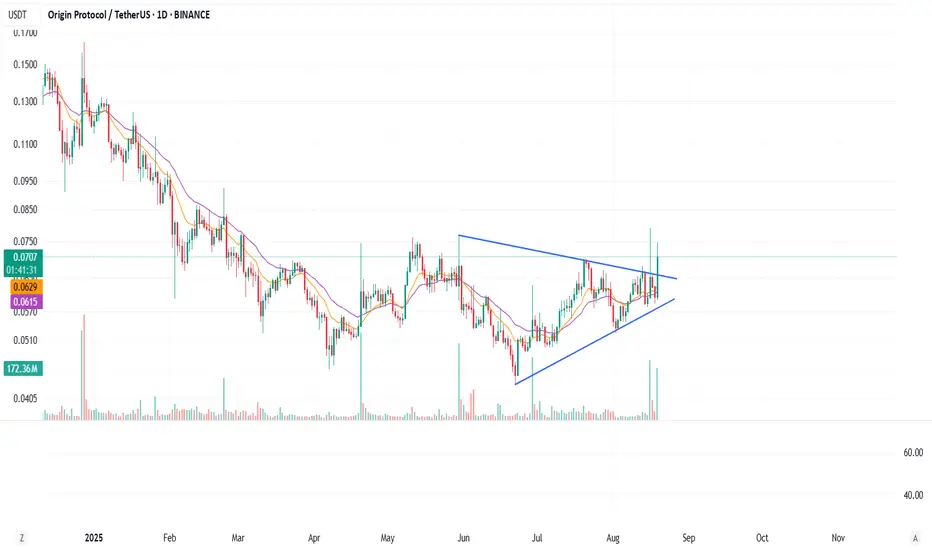
OGN-BULLISHOGN – Symmetrical Triangle Breakout in Play 🚀
Origin Protocol has been consolidating inside a well-defined symmetrical triangle since June, forming higher lows and lower highs. The price is now attempting a breakout with strong daily momentum (+17%).
🔹 Support Zone: $0.062 – $0.064
🔹 Breakout Leve
OGN ANALYSIS🔮#OGN Analysis 💰💰
#OGN is trading in a symmetrical triangle in a weekly time frame and breakouts with high volume and we could see a bullish momentum in #OGN. Before that we will see little bit bearish movement towards its support zone and that a bullish movement.
🔖 Current Price: $0.0768
⏳ Targe
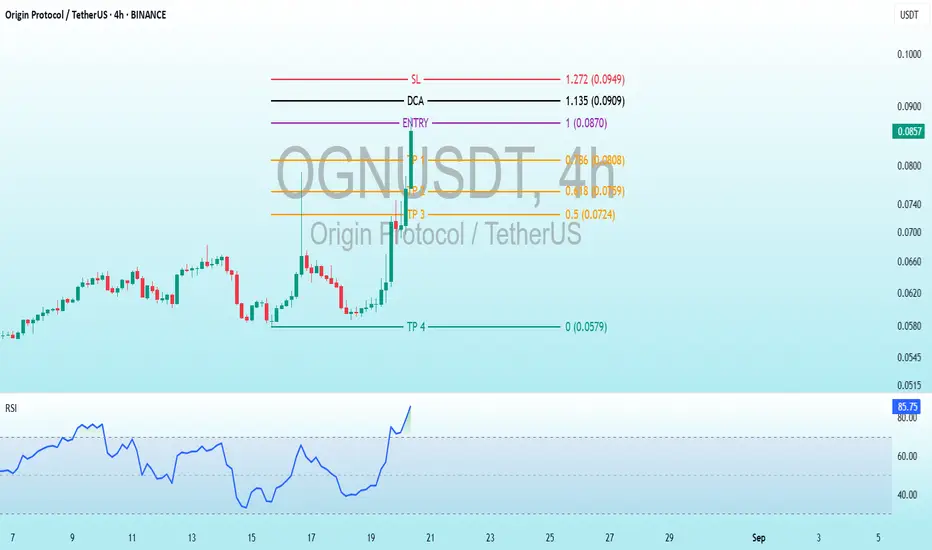
$OGN Overbought Edge: 4H Trading BreakdownBINANCE:OGNUSDT
Trading Levels (Exact Values from the Chart):Entry: 1.00 (0.0870 - 0.0860 USDT) - The planned initial purchase level.
DCA (Dollar-Cost Averaging): 1.135 (0.0909 USDT) - An additional buying point if the price rises.
SL (Stop Loss): 1.272 (0.0949 USDT) - The level to limit losses.
OGNUSDT UPDATE#OGN
UPDATE
OGN Technical Setup
Pattern: Bullish Wave Pattern
Current Price: $0.0649
Target Price: $0.10
Target % Gain: 51.61%
Technical Analysis: OGN is showing a bullish wave formation on the 1D chart, with higher lows and strong upward momentum. Price has reclaimed key support near \$0.06
See all ideas
Summarizing what the indicators are suggesting.
Oscillators
Neutral
SellBuy
Strong sellStrong buy
Strong sellSellNeutralBuyStrong buy
Oscillators
Neutral
SellBuy
Strong sellStrong buy
Strong sellSellNeutralBuyStrong buy
Summary
Neutral
SellBuy
Strong sellStrong buy
Strong sellSellNeutralBuyStrong buy
Summary
Neutral
SellBuy
Strong sellStrong buy
Strong sellSellNeutralBuyStrong buy
Summary
Neutral
SellBuy
Strong sellStrong buy
Strong sellSellNeutralBuyStrong buy
Moving Averages
Neutral
SellBuy
Strong sellStrong buy
Strong sellSellNeutralBuyStrong buy
Moving Averages
Neutral
SellBuy
Strong sellStrong buy
Strong sellSellNeutralBuyStrong buy
Displays a symbol's price movements over previous years to identify recurring trends.