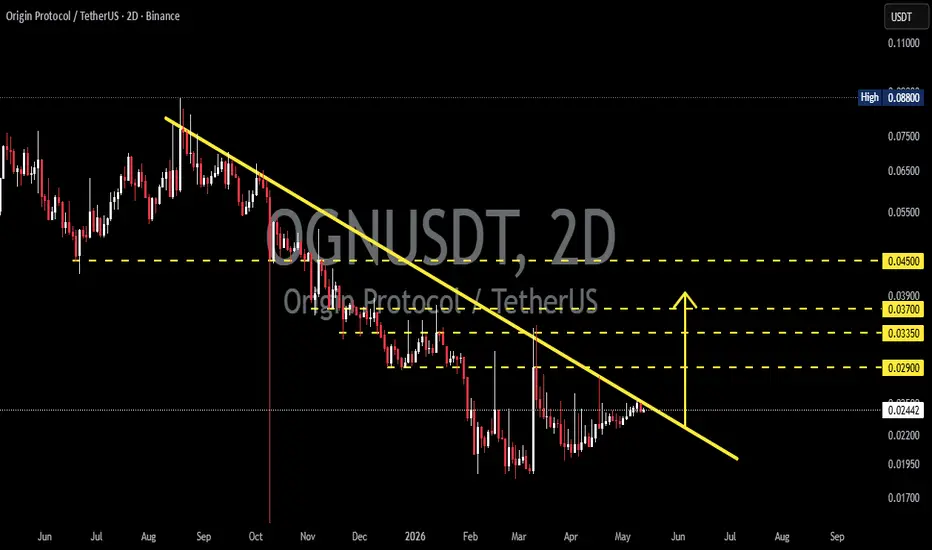
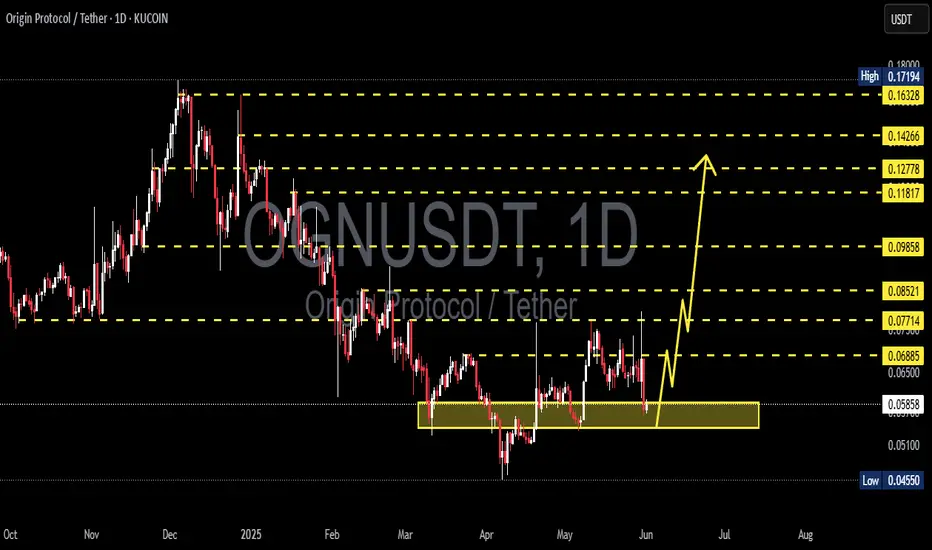
OGN/USDT — Breakout Incoming or Downtrend Continuation?OGN/USDT is still moving within a clear mid-term downtrend structure 📉, marked by a strong descending trendline 🔻 that has continuously pressured the price since the previous major peak.
However 👀, the chart is now starting to show signs of consolidation ⚡ and an attempt to build reversal momentum from the lower support area 🟢.
🚨 At the moment, price action is sitting right at a crucial zone and approaching a major decision point.
A breakout 🚀 or rejection ❌ from this trendline could determine the next massive move.
━━━━━━━━━━━━━━━━━━
📉🔻 Chart Structure & Pattern
OGN is currently forming a:
🔻 Descending Triangle / Descending Resistance Pattern
📌 The descending trendline acts as the main resistance.
📌 Price continues creating lower highs.
📌 Selling pressure appears to weaken as sellers struggle to push price significantly lower.
⚡ This pattern often becomes:
📉 Bearish continuation if support fails
🚀 Bullish reversal if resistance breaks with strong volume confirmation
🔥 Candles are now approaching the apex zone, meaning a major volatility expansion could happen soon.
━━━━━━━━━━━━━━━━━━
🟡⚡ Key Resistance Levels
Important resistance zones visible on the chart:
🔸 0.02900
🔸 0.03350
🔸 0.03700
🔸 0.04500
📈 These levels could become sequential bullish targets if breakout confirmation occurs.
━━━━━━━━━━━━━━━━━━
🟢🐂 Bullish Scenario
📈 The bullish scenario becomes valid if:
✅ Price successfully breaks the descending trendline
✅ Strong candle closes above 0.02900
✅ Volume increases during breakout
🎯 Bullish Targets:
🚀 0.02900
🚀 0.03350
🚀 0.03700
🚀 0.04500
🔥 If the overall crypto market supports the momentum, OGN could potentially establish a mid-term trend reversal after being trapped in a bearish structure for a long time.
📌 Additional Bullish Signals:
🟢 Higher low structure is beginning to form
🟢 Seller pressure appears weaker
🟢 Early accumulation phase may already be developing near the bottom zone
🐂 These could become early signals that buyers are slowly stepping in.
━━━━━━━━━━━━━━━━━━
🔴🐻 Bearish Scenario
📉 The bearish scenario remains valid if:
❌ Price fails to break the trendline
❌ Strong rejection occurs from diagonal resistance
❌ Lower support zones break down again
⚠️ If this happens:
📉 Downtrend will likely continue
📉 Price could retest previous lows
📉 Deeper correction toward new psychological support zones may open
🚨 Since the overall market structure is still technically bearish, traders should remain cautious of fake breakouts.
━━━━━━━━━━━━━━━━━━
📌🔥 Conclusion
OGN is currently trading at a crucial area while testing its mid-term downtrend resistance ⚡.
The market structure is beginning to show reversal attempts 👀, but breakout confirmation is still required before a true bullish continuation becomes valid 🚀.
📍This zone could become:
🚀 An early accumulation area before a massive breakout
OR
📉 Just a temporary relief bounce before continuing lower
🔥 The next few candles will likely determine the future direction of OGN.
━━━━━━━━━━━━━━━━━━
#OGN #OGNUSDT #OriginProtocol #Crypto 🚀 #CryptoTrading #TechnicalAnalysis 📊 #TradingView #Altcoin #Binance #Breakout #Bullish 🐂 #Bearish 🐻 #DescendingTriangle #PriceAction #CryptoAnalysis #Altseason #SupportResistance #TradingCrypto #ChartAnalysis #CryptoMarket
In-depth trading ideas
#OGN#OGN is currently consolidating 📊 around the 0.02320 level after a decisive breakout from a falling wedge pattern. Traders are now looking for a potential move towards the indicated target price around 0.02725 🚀. Observing consolidation after a pattern breakout often provides opportunities for confirmation and entry adjustments.
#OGN #crypto #altcoin #trading
OriginToken (OGN) ready for new bullish cycle —1,900%-3,000 PPI see a nice jump here. A nice suddenful jump. It is true that OriginToken (OGNUSDT) had no bull market in 2023, 2024 or 2025. It can be said that there was a one very long bear market or two bear markets with a period of rest in-between.
In 2021 OGN grew 3,000% in less than 4 months, some 105 days. During the entire move, there was almost no bearish action, just two red candles and most of the selling during these weeks was quickly bought. So 3,000% in a little over three months. A repeat of the same is possible.
OGNUSDT started to produce astonishingly high volume since April 2025, crazy volume. Many times higher compared to the previous bull market.
The project is now trading close to its all-time low but there are many signals pointing towards a reversal. A falling wedge pattern and many attempts to break out of it. All the candles since February look just like Bitcoin.
This is a good chart setup, a good opportunity with strong growth potential and likely to move fast; the market is already bullish and this bullishness will only intensify. Be prepared.
Namaste.
OGN Retest at Key Demand Inside DowntrendOGN is trading within a clear descending channel on the daily timeframe, maintaining the overall bearish structure. After a strong rejection from the channel resistance, price has pulled back into a key demand / retest zone around 0.023 – 0.021, which aligns with Fibonacci support.
This area is now acting as a potential higher low zone, where buyers are attempting to step in after the recent move up.
Key levels to watch
• 0.023 – 0.021: Retest / demand zone
• 0.0285 – 0.0327: Resistance zone
• 0.0368: Major resistance above
• 0.018 – 0.017: Breakdown level
• 0.013 – 0.015: Lower channel support
Scenario outlook
• Bullish case:
If OGN holds this demand zone, it could form a higher low and push toward 0.028 – 0.032, with potential continuation toward 0.036+ if momentum builds.
• Bearish case:
A breakdown below 0.018 would invalidate the recovery and likely send price toward the lower channel support near 0.013–0.015.
#OGN Ready For a Massive Bullish Move | Must Watch For BullsYello, Paradisers! Is #OriginProtocol about to explode to the upside, or is this a bull trap in disguise waiting to liquidate the impatient? Let’s break down what’s brewing on #OGNUSDT:
💎After forming a clean ascending channel, #OGN has been respecting both the ascending resistance and ascending support levels. Price is currently trading just above the 50 EMA, which has been acting as a dynamic support line since early July. This structure shows clear buyer interest around the $0.058–$0.062 zone—an area that aligns with volume cluster support.
💎The bullish scenario remains valid as long as #OGNUSD holds above the demand zone between $0.0499–$0.0580, and especially if it stays above the 50 EMA. As long as this structure is maintained, we could see a bounce toward the moderate resistance level at $0.076, where previous sellers stepped in and price stalled.
💎If buyers can break through that moderate resistance with strength and rising volume, the next key target lies at $0.092, which aligns with a strong resistance level and high-volume node on the visible range. This area is likely to trigger a reaction, so traders should remain agile.
💎However, if price breaks down below the demand zone, this would invalidate the current bullish setup and open the door for a potential move back toward the $0.045–$0.040 area. A broader shakeout would likely accompany this and could trap many late long entries.
Stay patient, Paradisers. Let the breakout confirm, and only then do we strike with conviction.
MyCryptoParadise
iFeel the success🌴
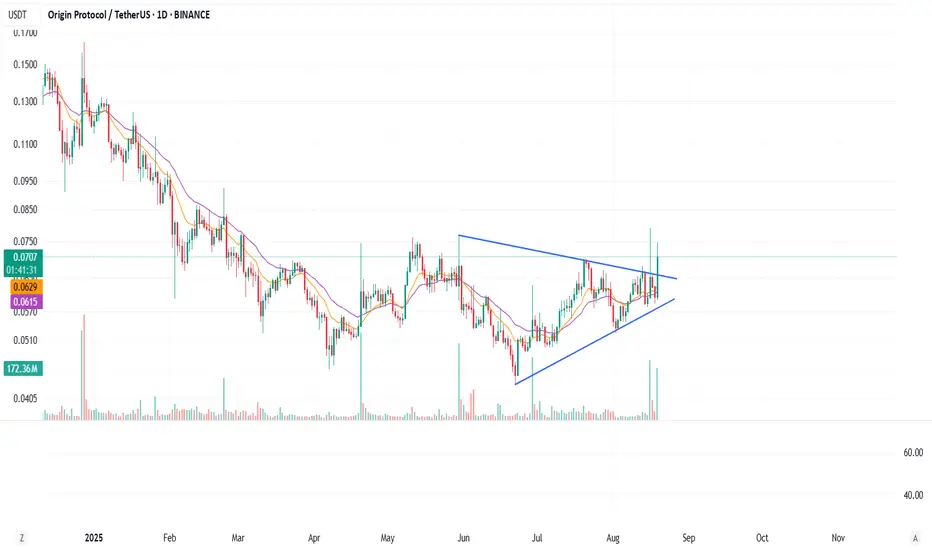
OGN-BULLISHOGN – Symmetrical Triangle Breakout in Play 🚀
Origin Protocol has been consolidating inside a well-defined symmetrical triangle since June, forming higher lows and lower highs. The price is now attempting a breakout with strong daily momentum (+17%).
🔹 Support Zone: $0.062 – $0.064
🔹 Breakout Level / Resistance: $0.072 – $0.075
Bullish Scenario:
A confirmed breakout above $0.075, accompanied by increased volume, could trigger a strong move higher. The measured move from the triangle projects targets towards $0.12 – $0.125. Key resistance levels to watch along the way:
$0.085
$0.095 – $0.10
Final target: $0.12
Bearish Scenario:
If the breakout fails and price closes back below $0.062, the pattern would be invalidated, with possible pullbacks towards $0.055 and $0.048.
OGN ANALYSIS🔮#OGN Analysis 💰💰
#OGN is trading in a symmetrical triangle in a weekly time frame and breakouts with high volume and we could see a bullish momentum in #OGN. Before that we will see little bit bearish movement towards its support zone and that a bullish movement.
🔖 Current Price: $0.0768
⏳ Target Price: $0.0998
⁉️ What to do?
- We can trade according to the chart and make some profits in #OGN. Keep your eyes on the chart, observe trading volume and stay accustom to market moves.💲💲
🏷Remember, the crypto market is dynamic in nature and changes rapidly, so always use stop loss and take proper knowledge before investments.
#OGN #Cryptocurrency #Pump #DYOR
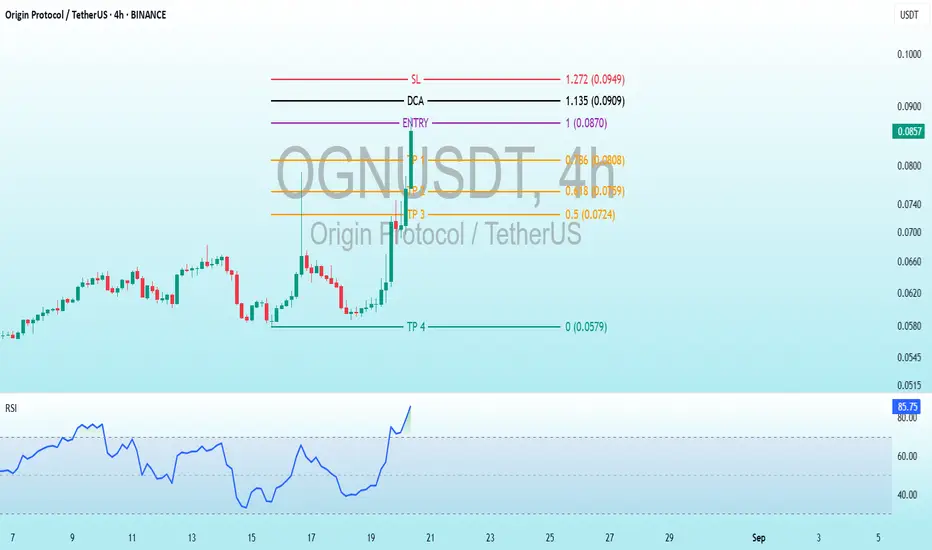
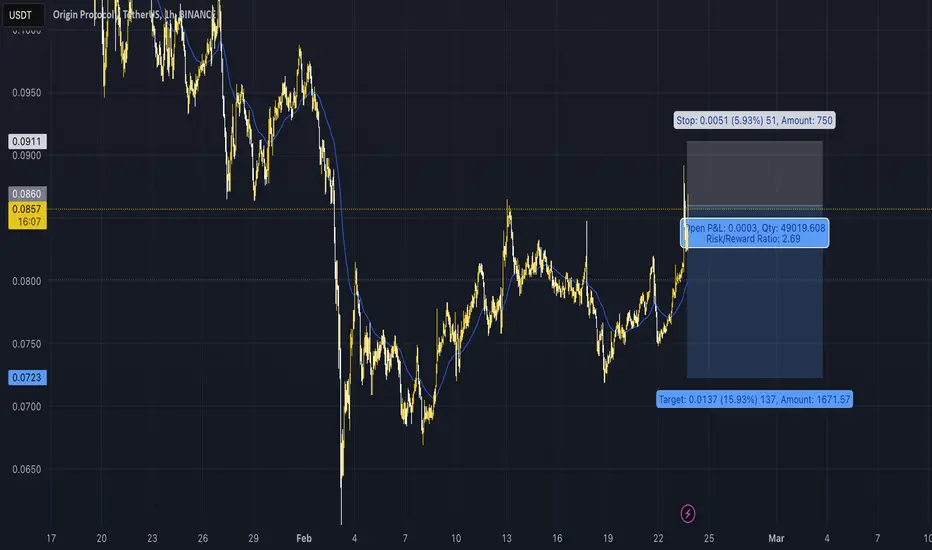
$OGN Overbought Edge: 4H Trading BreakdownBINANCE:OGNUSDT
Trading Levels (Exact Values from the Chart):Entry: 1.00 (0.0870 - 0.0860 USDT) - The planned initial purchase level.
DCA (Dollar-Cost Averaging): 1.135 (0.0909 USDT) - An additional buying point if the price rises.
SL (Stop Loss): 1.272 (0.0949 USDT) - The level to limit losses.
TP (Take Profit):TP1: 0.786 (0.0808 USDT)
TP2: 0.618 (0.0759 USDT)
TP3: 0.5 (0.0724 USDT)
TP4: 0 (0.0579 USDT) - A notably lower target, likely an error or long-term projection.
RSI (Relative Strength Index) Indicator:
The RSI value is 85.30, which is deeply in the overbought territory (above 70 and nearing 90). This indicates the price was overextended at that time, suggesting a potential reversal or correction.
Analysis and Interpretation:Strategy: The chart employs Fibonacci levels to set entry, exit, and loss points. The entry is precisely at 0.0870 - 0.0860 USDT, with a DCA at 0.0909 USDT if the price increases, and a stop loss at 0.0949 USDT to safeguard capital.
Profit Targets: TP1 to TP3 are derived from Fibonacci retracement levels (0.786, 0.618, 0.5), reflecting a structured approach to securing profits as the price declines from its peak. TP4 at 0.0452 USDT is significantly below the current price and seems inconsistent, possibly indicating a typo or a long-term speculative target.
RSI:
The RSI of 85.30 at the chart's timestamp signals a strong overbought condition. Given the 18-hour gap, the RSI may have moderated, but the pullback observed suggests the market may have started correcting.
Recommendation:
Monitor the current price around the entry level (0.0870 - 0.0860 USDT) and DCA (0.0909 USDT). Since the chart is 18 hours old and the RSI was overbought, the price may have adjusted. The slight pullback at 0.0949 USDT supports this possibility. Exercise caution with new entries and consider checking the latest price and RSI.
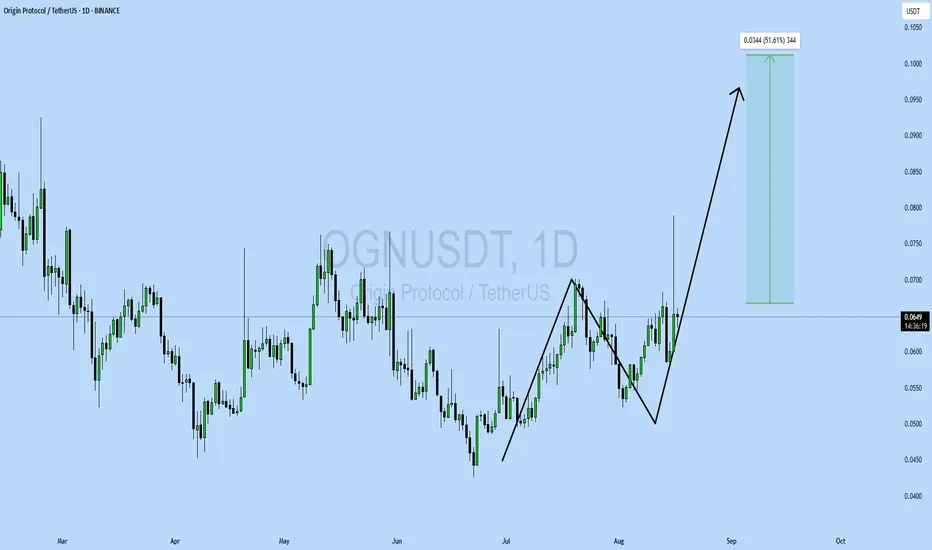
OGNUSDT UPDATE#OGN
UPDATE
OGN Technical Setup
Pattern: Bullish Wave Pattern
Current Price: $0.0649
Target Price: $0.10
Target % Gain: 51.61%
Technical Analysis: OGN is showing a bullish wave formation on the 1D chart, with higher lows and strong upward momentum. Price has reclaimed key support near \$0.06 and is gearing toward the $0.10 resistance zone, confirming bullish continuation.
Time Frame: 1D
Risk Management Tip: Always use proper risk management.
OGNUSDT UPDATE#OGN
UPDATE
OGN Technical Setup
Pattern: Bullish Wave Pattern
Current Price: $0.0649
Target Price: $0.10
Target % Gain: 51.61%
Technical Analysis: OGN is showing a bullish wave formation on the 1D chart, with higher lows and strong upward momentum. Price has reclaimed key support near $0.06 and is gearing toward the $0.10 resistance zone, confirming bullish continuation.
Time Frame: 1D
Risk Management Tip: Always use proper risk management.
OGNUSDT Breakout Alert Descending Trendline Reversal
📊 Pattern and Market Structure
Descending Trendline Breakout:
OGN has successfully broken out of a long-standing descending trendline, signaling a potential shift from a bearish to a bullish trend.
Strong Accumulation Zone / Key Support:
The price has consistently respected the $0.04268 - $0.05402 support area, forming a solid demand zone with multiple rejections and prolonged consolidation.
Potential Reversal Formation:
A double bottom / base consolidation pattern seems to be forming within the support zone, reinforcing the likelihood of a bullish reversal.
📈 Bullish Scenario
If the breakout is confirmed (price holds above and successfully retests the trendline), the bullish targets will be:
1. $0.06229 – minor resistance, likely first retest area.
2. $0.07000 - $0.07432 – previous horizontal resistance zone.
3. $0.08118 – prior distribution zone.
4. $0.09500 - $0.10302 – mid-range supply zone.
5. $0.11000 - $0.12733 – medium-term potential target.
6. $0.14601 - $0.16232 – longer-term target on strong momentum.
📌 A daily candle close above $0.06229 with significant volume could confirm further bullish continuation.
📉 Bearish Scenario
If the breakout turns out to be a false breakout, and price falls back below the support zone ($0.05402):
Expect a drop toward:
$0.04268 – the next major support level.
A breakdown below this may lead to $0.03800 or the formation of a new lower low.
Possible bearish triggers:
Rejection at $0.06229 or above.
Weak breakout volume.
Overall bearish sentiment in the crypto market.
📌 Conclusion:
The descending trendline breakout indicates a potential bullish reversal.
Strong support at the base adds confluence to the setup.
Bullish scenario currently has higher probability, but confirmation and volume are crucial for sustained upside.
#OGNUSDT #CryptoAnalysis #TechnicalAnalysis #AltcoinBreakout #CryptoSignals #BullishReversal #DescendingTrendline #BreakoutAlert #OGN #OriginProtocol
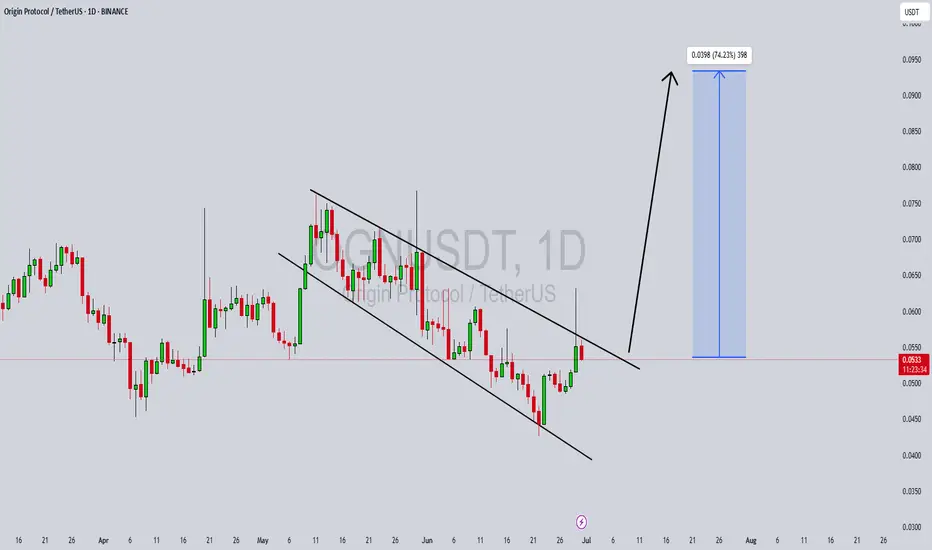
OGNUSDT Forming Descending ChannelOGNUSDT is displaying a promising reversal opportunity as it forms a clear descending channel on the daily chart. This technical setup signals that Origin Protocol could be gearing up for a breakout move, especially with the recent price action testing the upper boundary of the channel. A successful breakout above this resistance zone could unlock significant upside potential, setting the stage for a healthy bullish wave that traders will want to monitor closely.
Volume analysis for OGNUSDT is equally supportive, showing consistent buying interest that hints at accumulation by investors positioning early for a trend reversal. With good volume backing the price action, the probability of a confirmed breakout above the descending channel increases, which can accelerate momentum buying and attract fresh capital inflows. This kind of setup often draws the attention of swing traders and trend-followers looking for high-probability moves.
The expected gain for OGNUSDT in this scenario sits around 60% to 70%+, which is a reasonable target given the recent lows and the potential to reclaim previous levels of support turned resistance. The broader market sentiment towards altcoins is also improving, with many investors rotating funds into projects with strong recovery patterns. Origin Protocol’s fundamentals, coupled with this technical outlook, make it an appealing candidate for medium-term gains.
Traders should keep an eye on daily closes above the channel resistance and watch for confirmation signals like retests and continuation candles. Managing risk is key, but with investors taking renewed interest in this project, OGNUSDT is a crypto pair worth keeping on the watchlist for the next breakout phase.
✅ Show your support by hitting the like button and
✅ Leaving a comment below! (What is You opinion about this Coin)
Your feedback and engagement keep me inspired to share more insightful market analysis with you!
Origin Protocol 1110% Target Explained & 3000% Prev-Bull MarketOrigin Protocol has been moving within a massive broadening channel since December 2022. Now trading within its lower boundary. The upper boundary works as resistance while the lower boundary works as support. Whenever the action starts to happen close to the lower boundary this becomes a buy-opportunity, this entry can be used either for the short- or long-term. With the current market situation, the best focus is long-term. A 6 months time window.
Origin Protocol (OGNUSDT) produced a 3,000%+ bullish wave back in the 2021 bull market. We know for a fact now that this pair can produce wild gains. The price that launched this wave was 0.1068, the peak was 3.39. In comparison, the bottom in 2025 stands at 0.0426. The next peak can be anything but we have plenty of room available for growth. On the chart I have a 1,110% target and this is an easy one. This project is likely to grow 2,000% or more. Can be 3,000%. 1,110% is the safe, strong, easy target.
Thank you for reading.
Namaste.
OGNUSDT | One of Today’s Highest Volume Gainers – +32.44% OGNUSDT just saw an impressive surge in trading activity, surging over thirty percent in volume today. When you spot a coin with that kind of interest, you know smart money is involved and you pay attention.
🟦 Blue Box = Key Support Zone
• This area has shown reliable buyer reactions before. As price approaches, you’ll naturally look for a rebound.
• If OGN dips into the blue box and holds, a measured long can be considered—just wait for lower‑timeframe confirmations on price action and CDV confluences.
📈 How to Trade This Move
Entry with Confidence
Watch for price to touch the blue box and then form a clean higher‑low on a 5‑ or 15‑minute chart. That’s your green light.
Manage Your Risk
Place a stop just below the blue box. If your trigger doesn’t hold, you exit quickly.
Adaptive Mindset
If instead OGN breaks decisively below the blue box with volume, shift out of longs and look for a retest of that level as resistance—this ability to adapt is why followers trust my analysis.
🤝 Why Follow These Levels?
Every zone I share comes from watching real orderflow and proven patterns in the market. These setups have built my high success rate—just check my profile. Most traders guess entries; you’ll be acting on clear, data‑backed signals.
Stay patient, let the market prove itself, and then step in with conviction. That’s how you trade smarter and avoid emotional mistakes.
📌I keep my charts clean and simple because I believe clarity leads to better decisions.
📌My approach is built on years of experience and a solid track record. I don’t claim to know it all but I’m confident in my ability to spot high-probability setups.
📌If you would like to learn how to use the heatmap, cumulative volume delta and volume footprint techniques that I use below to determine very accurate demand regions, you can send me a private message. I help anyone who wants it completely free of charge.
🔑I have a long list of my proven technique below:
🎯 ZENUSDT.P: Patience & Profitability | %230 Reaction from the Sniper Entry
🐶 DOGEUSDT.P: Next Move
🎨 RENDERUSDT.P: Opportunity of the Month
💎 ETHUSDT.P: Where to Retrace
🟢 BNBUSDT.P: Potential Surge
📊 BTC Dominance: Reaction Zone
🌊 WAVESUSDT.P: Demand Zone Potential
🟣 UNIUSDT.P: Long-Term Trade
🔵 XRPUSDT.P: Entry Zones
🔗 LINKUSDT.P: Follow The River
📈 BTCUSDT.P: Two Key Demand Zones
🟩 POLUSDT: Bullish Momentum
🌟 PENDLEUSDT.P: Where Opportunity Meets Precision
🔥 BTCUSDT.P: Liquidation of Highly Leveraged Longs
🌊 SOLUSDT.P: SOL's Dip - Your Opportunity
🐸 1000PEPEUSDT.P: Prime Bounce Zone Unlocked
🚀 ETHUSDT.P: Set to Explode - Don't Miss This Game Changer
🤖 IQUSDT: Smart Plan
⚡️ PONDUSDT: A Trade Not Taken Is Better Than a Losing One
💼 STMXUSDT: 2 Buying Areas
🐢 TURBOUSDT: Buy Zones and Buyer Presence
🌍 ICPUSDT.P: Massive Upside Potential | Check the Trade Update For Seeing Results
🟠 IDEXUSDT: Spot Buy Area | %26 Profit if You Trade with MSB
📌 USUALUSDT: Buyers Are Active + %70 Profit in Total
🌟 FORTHUSDT: Sniper Entry +%26 Reaction
🐳 QKCUSDT: Sniper Entry +%57 Reaction
📊 BTC.D: Retest of Key Area Highly Likely
📊 XNOUSDT %80 Reaction with a Simple Blue Box!
📊 BELUSDT Amazing %120 Reaction!
I stopped adding to the list because it's kinda tiring to add 5-10 charts in every move but you can check my profile and see that it goes on..