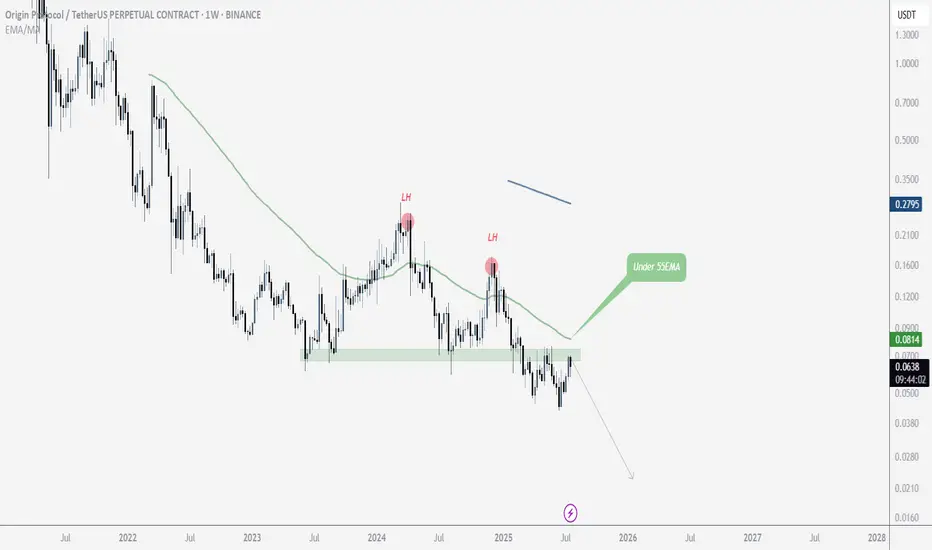
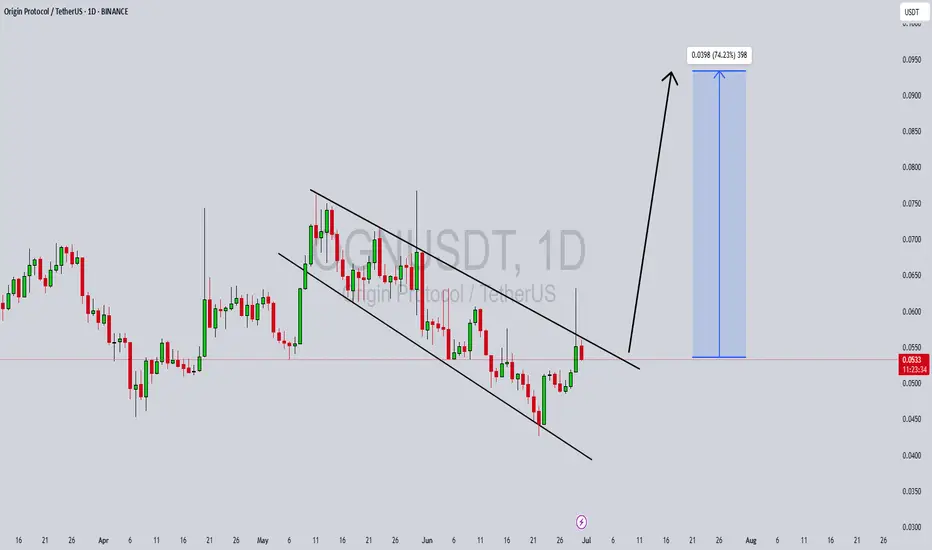
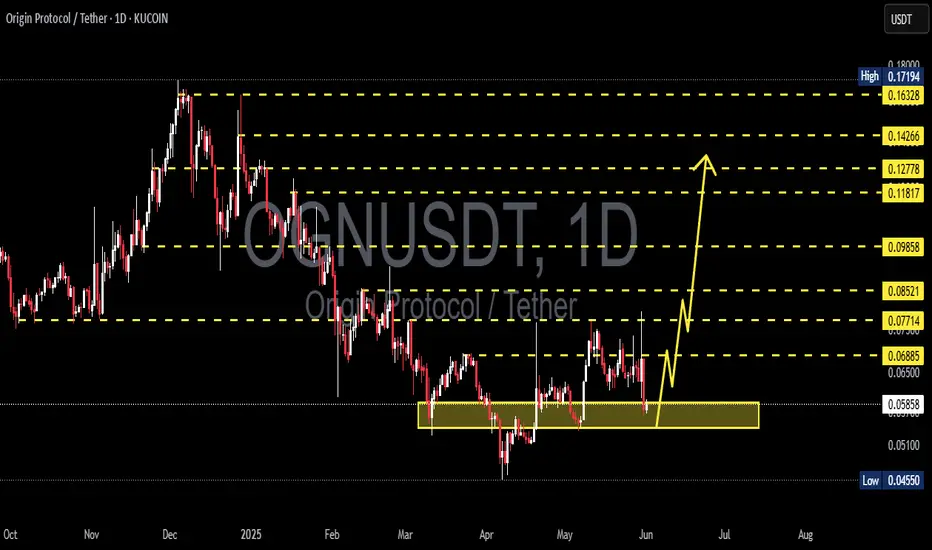
OGN Rebounds Into Major Resistance — Breakout or Bull Trap?OGN has been trading inside a Descending Channel since its major peak in 2024. The pattern is characterized by two downward-sloping, approximately parallel boundaries:
🔴 Upper Resistance (Red Line): A descending resistance trendline connecting successive lower highs, showing that sellers have maintained control over the broader trend.
🟡 Lower Support (Yellow Line): The lower boundary of the channel, which has acted as a dynamic support zone during previous declines.
🟢 Mid-Channel Trendline: T
Origin Protocol / Tether
No trades
No trades
In-depth trading ideas
OGN Long-Term Downtrend Reaches Critical Support ZoneOGN is approaching a major support area inside its long-term descending channel after a prolonged bearish trend. Price is currently testing the lower boundary of the structure, where buyers need to step in to prevent further downside.
A recovery attempt could start if OGN holds the 0.0143 - 0.0137 support zone and reclaims the 0.0162 - 0.0174 resistance area. A stronger breakout above 0.0219 would confirm increasing bullish momentum.
However, failure to defend the current support zone could pu
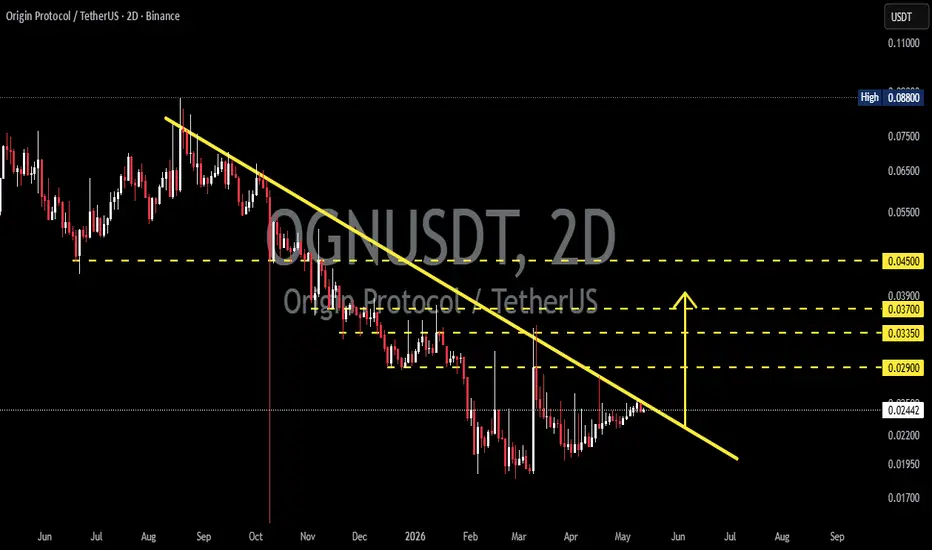
OGN/USDT — Breakout Incoming or Downtrend Continuation?OGN/USDT is still moving within a clear mid-term downtrend structure 📉, marked by a strong descending trendline 🔻 that has continuously pressured the price since the previous major peak.
However 👀, the chart is now starting to show signs of consolidation ⚡ and an attempt to build reversal momentum from the lower support area 🟢.
🚨 At the moment, price action is sitting right at a crucial zone and approaching a major decision point.
A breakout 🚀 or rejection ❌ from this trendline could determine
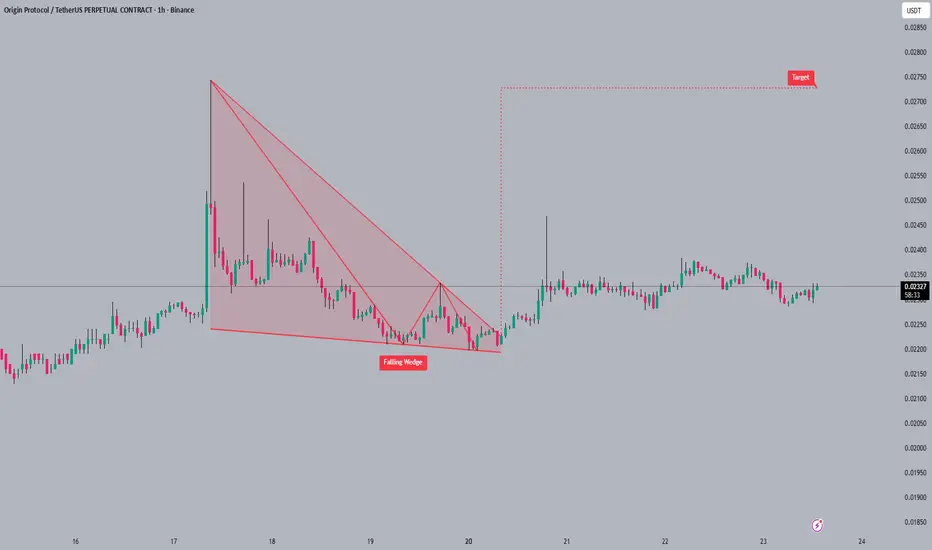
#OGN#OGN is currently consolidating 📊 around the 0.02320 level after a decisive breakout from a falling wedge pattern. Traders are now looking for a potential move towards the indicated target price around 0.02725 🚀. Observing consolidation after a pattern breakout often provides opportunities for confirmation and entry adjustments.
#OGN #crypto #altcoin #trading
OriginToken (OGN) ready for new bullish cycle —1,900%-3,000 PPI see a nice jump here. A nice suddenful jump. It is true that OriginToken (OGNUSDT) had no bull market in 2023, 2024 or 2025. It can be said that there was a one very long bear market or two bear markets with a period of rest in-between.
In 2021 OGN grew 3,000% in less than 4 months, some 105 days. During the entire move, there was almost no bearish action, just two red candles and most of the selling during these weeks was quickly bought. So 3,000% in a little over three months. A repeat of t
OGN Retest at Key Demand Inside DowntrendOGN is trading within a clear descending channel on the daily timeframe, maintaining the overall bearish structure. After a strong rejection from the channel resistance, price has pulled back into a key demand / retest zone around 0.023 – 0.021, which aligns with Fibonacci support.
This area is now acting as a potential higher low zone, where buyers are attempting to step in after the recent move up.
Key levels to watch
• 0.023 – 0.021: Retest / demand zone
• 0.0285 – 0.0327: Resistance zone
#OGN Ready For a Massive Bullish Move | Must Watch For BullsYello, Paradisers! Is #OriginProtocol about to explode to the upside, or is this a bull trap in disguise waiting to liquidate the impatient? Let’s break down what’s brewing on #OGNUSDT:
💎After forming a clean ascending channel, #OGN has been respecting both the ascending resistance and ascending support levels. Price is currently trading just above the 50 EMA, which has been acting as a dynamic support line since early July. This structure shows clear buyer interest around the $0.058–$0.062 zon
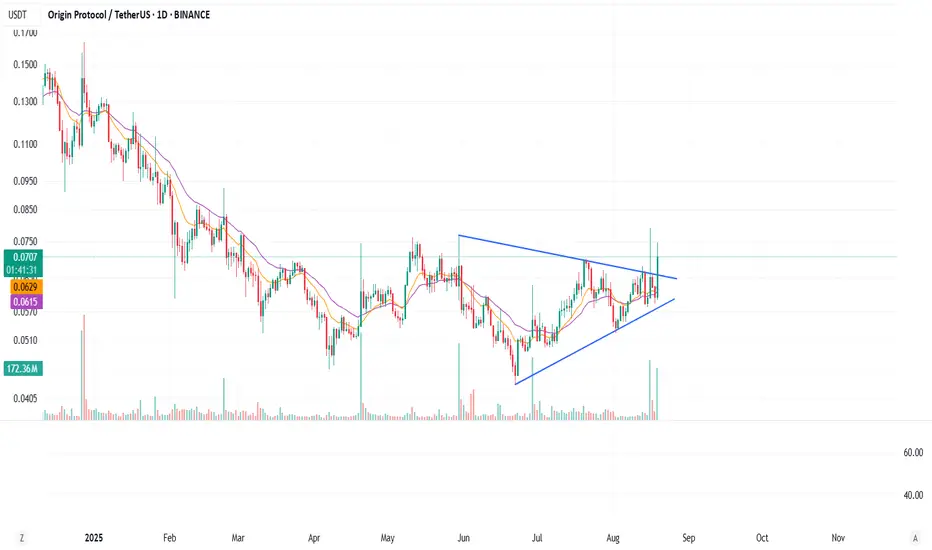
OGN-BULLISHOGN – Symmetrical Triangle Breakout in Play 🚀
Origin Protocol has been consolidating inside a well-defined symmetrical triangle since June, forming higher lows and lower highs. The price is now attempting a breakout with strong daily momentum (+17%).
🔹 Support Zone: $0.062 – $0.064
🔹 Breakout Level / Resistance: $0.072 – $0.075
Bullish Scenario:
A confirmed breakout above $0.075, accompanied by increased volume, could trigger a strong move higher. The measured move from the triangle projects
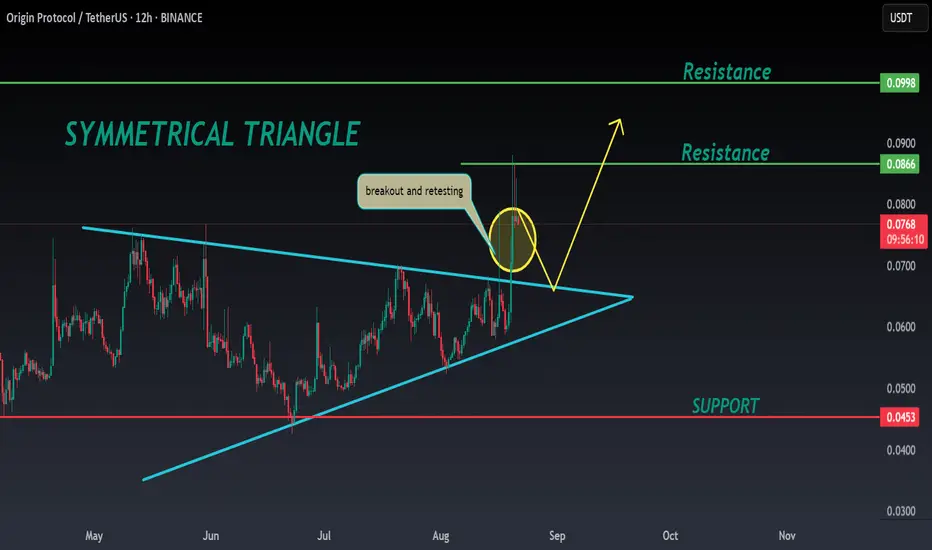
OGN ANALYSIS🔮#OGN Analysis 💰💰
#OGN is trading in a symmetrical triangle in a weekly time frame and breakouts with high volume and we could see a bullish momentum in #OGN. Before that we will see little bit bearish movement towards its support zone and that a bullish movement.
🔖 Current Price: $0.0768
⏳ Target Price: $0.0998
⁉️ What to do?
- We can trade according to the chart and make some profits in #OGN. Keep your eyes on the chart, observe trading volume and stay accustom to market moves.💲💲
🏷Reme
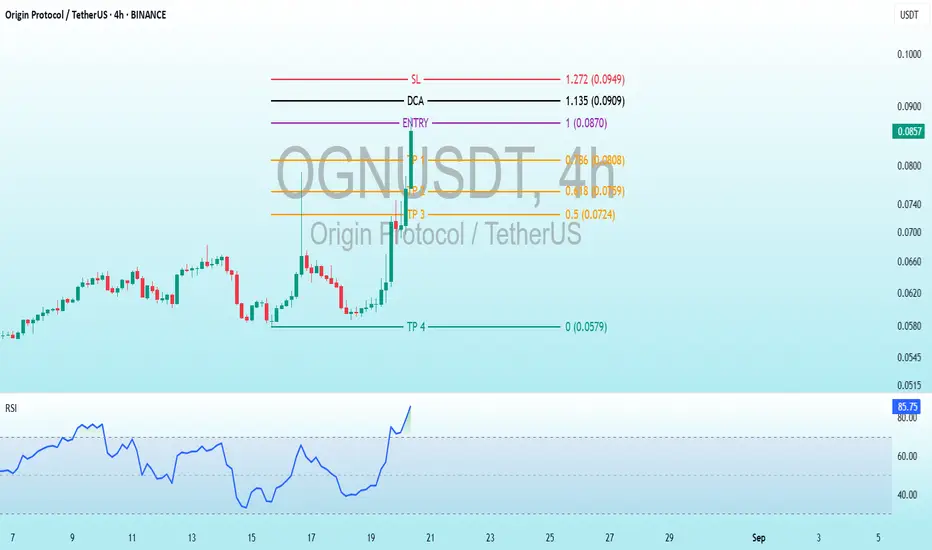
$OGN Overbought Edge: 4H Trading BreakdownBINANCE:OGNUSDT
Trading Levels (Exact Values from the Chart):Entry: 1.00 (0.0870 - 0.0860 USDT) - The planned initial purchase level.
DCA (Dollar-Cost Averaging): 1.135 (0.0909 USDT) - An additional buying point if the price rises.
SL (Stop Loss): 1.272 (0.0949 USDT) - The level to limit losses.
TP (Take Profit):TP1: 0.786 (0.0808 USDT)
TP2: 0.618 (0.0759 USDT)
TP3: 0.5 (0.0724 USDT)
TP4: 0 (0.0579 USDT) - A notably lower target, likely an error or long-term projection.
RSI (Relative Strengt
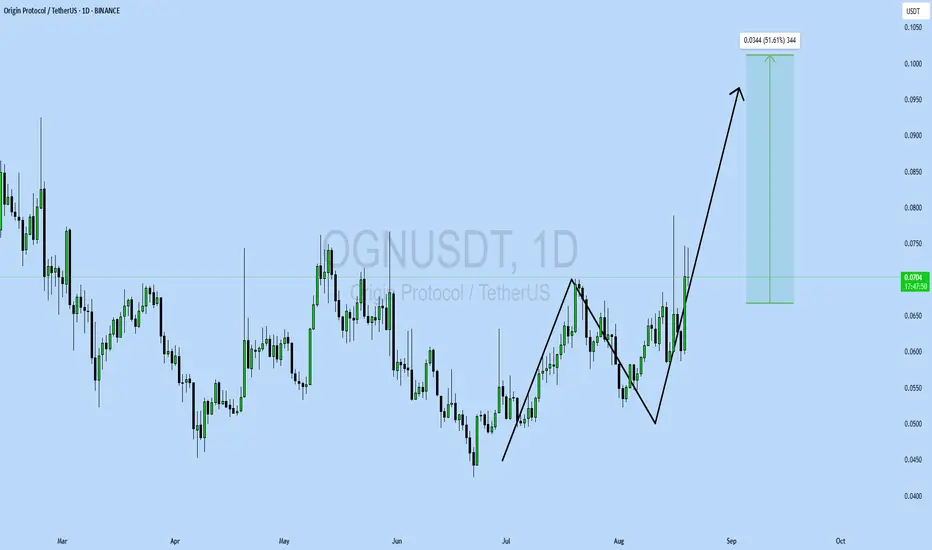
OGNUSDT UPDATE#OGN
UPDATE
OGN Technical Setup
Pattern: Bullish Wave Pattern
Current Price: $0.0649
Target Price: $0.10
Target % Gain: 51.61%
Technical Analysis: OGN is showing a bullish wave formation on the 1D chart, with higher lows and strong upward momentum. Price has reclaimed key support near \$0.06 and is gearing toward the $0.10 resistance zone, confirming bullish continuation.
Time Frame: 1D
Risk Management Tip: Always use proper risk management.
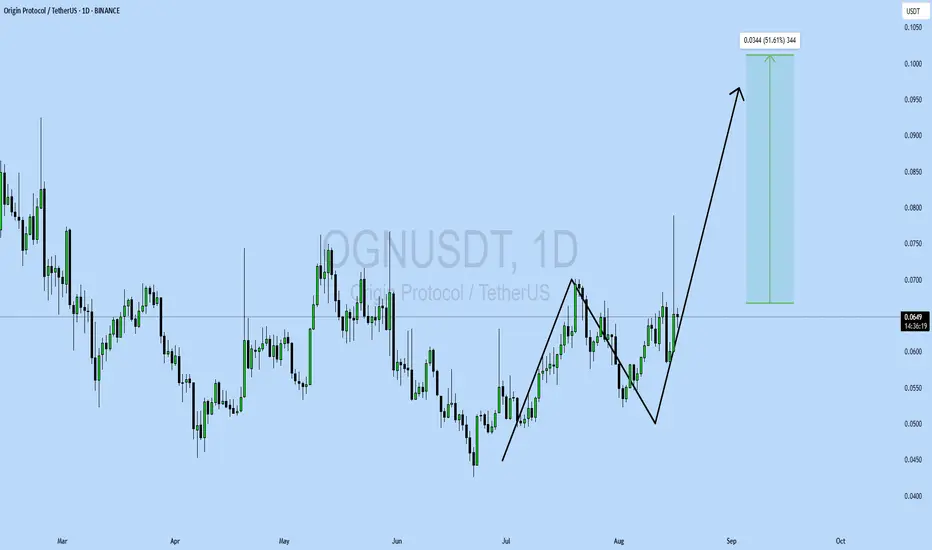
OGNUSDT UPDATE#OGN
UPDATE
OGN Technical Setup
Pattern: Bullish Wave Pattern
Current Price: $0.0649
Target Price: $0.10
Target % Gain: 51.61%
Technical Analysis: OGN is showing a bullish wave formation on the 1D chart, with higher lows and strong upward momentum. Price has reclaimed key support near $0.06 and is gearing toward the $0.10 resistance zone, confirming bullish continuation.
Time Frame: 1D
Risk Management Tip: Always use proper risk management.
OGNUSDT Breakout Alert Descending Trendline Reversal
📊 Pattern and Market Structure
Descending Trendline Breakout:
OGN has successfully broken out of a long-standing descending trendline, signaling a potential shift from a bearish to a bullish trend.
Strong Accumulation Zone / Key Support:
The price has consistently respected the $0.04268 - $0.05402 support area, forming a solid demand zone with multiple rejections and prolonged consolidation.
Potential Reversal Formation:
A double bottom / base consolidation pattern seems to be forming within
OGNUSDT Forming Descending ChannelOGNUSDT is displaying a promising reversal opportunity as it forms a clear descending channel on the daily chart. This technical setup signals that Origin Protocol could be gearing up for a breakout move, especially with the recent price action testing the upper boundary of the channel. A successful breakout above this resistance zone could unlock significant upside potential, setting the stage for a healthy bullish wave that traders will want to monitor closely.
Volume analysis for OGNUSDT is
Origin Protocol 1110% Target Explained & 3000% Prev-Bull MarketOrigin Protocol has been moving within a massive broadening channel since December 2022. Now trading within its lower boundary. The upper boundary works as resistance while the lower boundary works as support. Whenever the action starts to happen close to the lower boundary this becomes a buy-opportunity, this entry can be used either for the short- or long-term. With the current market situation, the best focus is long-term. A 6 months time window.
Origin Protocol (OGNUSDT) produced a 3,000%+
OGNUSDT | One of Today’s Highest Volume Gainers – +32.44% OGNUSDT just saw an impressive surge in trading activity, surging over thirty percent in volume today. When you spot a coin with that kind of interest, you know smart money is involved and you pay attention.
🟦 Blue Box = Key Support Zone
• This area has shown reliable buyer reactions before. As price approaches, you’ll naturally look for a rebound.
• If OGN dips into the blue box and holds, a measured long can be considered—just wait for lower‑timeframe confirmations on price action and CDV con