OG:USDT LOOKS READY FOR UNEXPECTED BREAKOUT📊 OG:USDT
Depending on the trend study, OG:USDT is showing an interesting setup for day trading.
The token is gaining strength with its structure and volume, and it can slowly build towards a possible breakout.
For this reason, we will follow OG and see if it can continue building into a stronger trend.
In-depth trading ideas
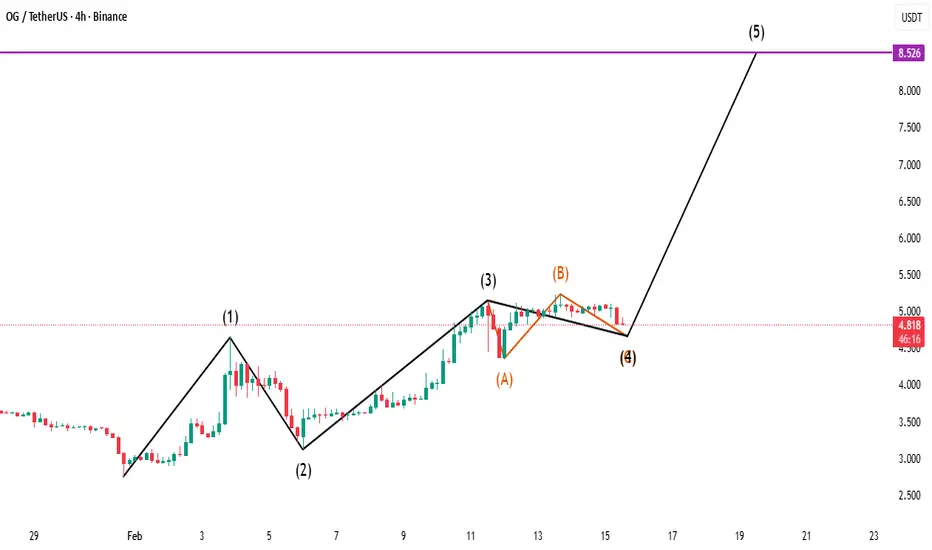
Bearish Momentum: Wave E Extension Following Volume Profile VAH Wave E Continuation / Technical Analysis
Following the development of Wave E, we just witnessed a strong rejection at the Volume Profile's VAH (Value Area High).
With this price action, the bearish thesis is reinforced, and we can expect a continuation of the downward movement for Wave E.
Key Takeaway: The rejection at high volume resistance confirms selling pressure, keeping the bearish target intact.
OG Potential Short: Watching for the 3-Wave BounceI have a bearish outlook across almost all assets right now, having already published shorts for BTC and ETH. Now, I’m looking at OG for a potential short entry on this relief rally. If we get a 3-wave corrective bounce to the upside, we can look for a short entry and wait for Wave E to complete.
#OG Here's my analysis of the chart:
#OG is currently trading at 3.126 🪙, showing signs of breaking out from a falling wedge pattern. The falling wedge pattern suggests a potential bullish reversal 🐂 after a period of consolidation. If #OG breaks out, the target is around 3.700, as indicated on the chart 🚀.
Always wait for confirmation before entering a trade: A breakout isn't valid until price closes above resistance.
#OG #crypto #trading #altcoin
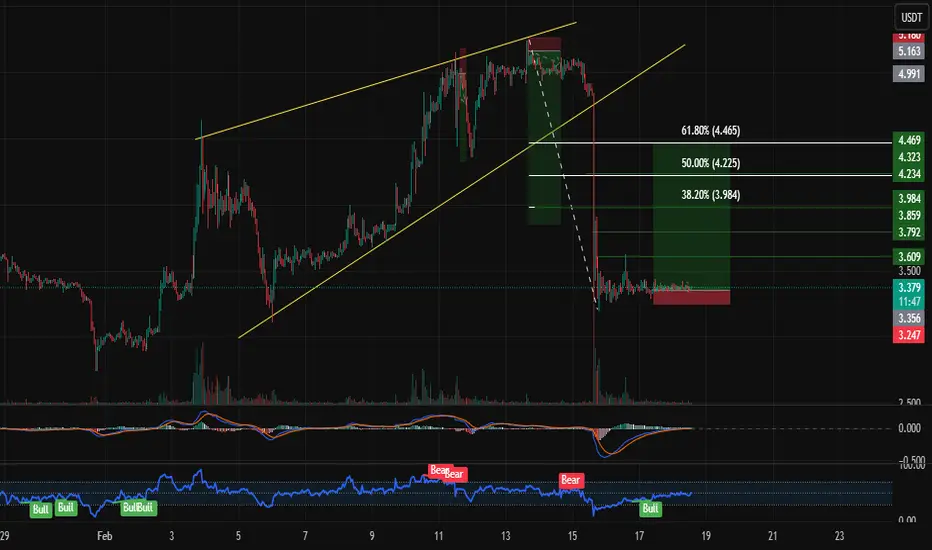
OG USDT LONG SIGNAL📢 OG/USDT – Trade Setup (LONG)
📈 Position: LONG
🕒 Timeframe: 15M
📊 Market: Binance Perpetual
💰 Entry Zone:
3.30 – 3.609 (Limit Order)
🛑 Stop-Loss:
3.24
🎯 Take-Profit Targets:
TP1: 3.60
TP2: 3.792
TP3: 3.98
TP4: 4.234
TP5: 4.46
TP6: 4.469
⚙️ Leverage: 10–5×
📌 Trade Management:
✔️ Move SL to Break Even after TP1
✔️ Take partial profits at each TP
✔️ Risk max 1–2% of capital
✔️ Confirm breakout structure on chart before entry
⚠️ Always analyze the chart carefully before entering.
🧠 Technical Analysis:
Price is holding support near 3.247 and forming higher lows on the 15-minute timeframe. A break above 3.609 confirms bullish continuation toward Fibonacci resistance levels and previous highs.
OGUSDT Forming Bullish ContinuationOGUSDT is forming a clear bullish continuation pattern, a classic bullish wave signal that often indicates an upcoming breakout. The price has been consolidating within a narrowing range, suggesting that selling pressure is weakening while buyers are beginning to regain control. With consistent volume confirming accumulation at lower levels, the setup hints at a potential bullish breakout soon. The projected move could lead to an impressive gain of around 190% to 200% once the price breaks above the wedge resistance.
This bullish continuation pattern is typically seen at the end of downtrends or corrective phases, and it represents a potential shift in market sentiment from bearish to bullish. Traders closely watching OGUSDT are noting the strengthening momentum as it nears a breakout zone. The good trading volume adds confidence to this pattern, showing that market participants are positioning early in anticipation of a reversal.
Investors’ growing interest in OGUSDT reflects rising confidence in the project’s long-term fundamentals and current technical strength. If the breakout confirms with sustained volume, this could mark the start of a fresh bullish leg. Traders might find this a valuable setup for medium-term gains, especially as the wedge pattern completes and buying momentum accelerates.
✅ Show your support by hitting the like button and
✅ Leaving a comment below! (What is your opinion about this Coin?)
Your feedback and engagement keep me inspired to share more insightful market analysis with you!
OG Fan Token OG to print 200% upside more to resistanceOn the above 8 day chart price action has corrected 90% since October on this football token.
Resistance is around 200% above current price action with RSI at ridiculously oversold levels for this timeframe. There's many more technical reasons for being bullish, but time is limited for usual waffle.
Is it possible price action falls further? Sure.
Is it probable? No.
Start scaling out after $8 or wait for a probability condition to print.
Ww
==============================================
Disclaimer
This idea is for educational and informational purposes only. It is not financial advice. Cryptocurrency trading carries significant risk of loss and is not suitable for all investors. Always conduct your own research (DYOR) and consider consulting a qualified financial advisor before making any investment decisions. Past performance is not indicative of future results.
OG/USDT Price Analysis – 1H Timeframe | Bullish Recovery SetupBINANCE:OGUSDT is currently trading near a high-probability demand region on the 1-hour timeframe, where price is reacting after a sharp corrective move.
The chart highlights a Buying Breaker Block between $3.536 and $3.423, which has previously acted as strong support and is now a key decision zone for bulls.
If price holds this breaker block and shows bullish confirmation, a recovery move is likely, with upside targets projected toward $3.799 as the first resistance and $4.247 as the extended bullish target.
In case of deeper retracement, the Last Buying Zone at $3.329 – $3.285 serves as the final demand area where buyers are expected to defend the structure.
A strong reaction from this zone would still support a bullish reversal scenario; however, a clean breakdown and acceptance below $3.227, which is marked as the invalidation level, would confirm bearish continuation and shift market control to sellers.
Overall, holding above the demand zones keeps the bullish structure intact, while a loss of the last buying zone would signal increased downside risk.
Traders should wait for confirmation at these key levels to manage risk effectively.
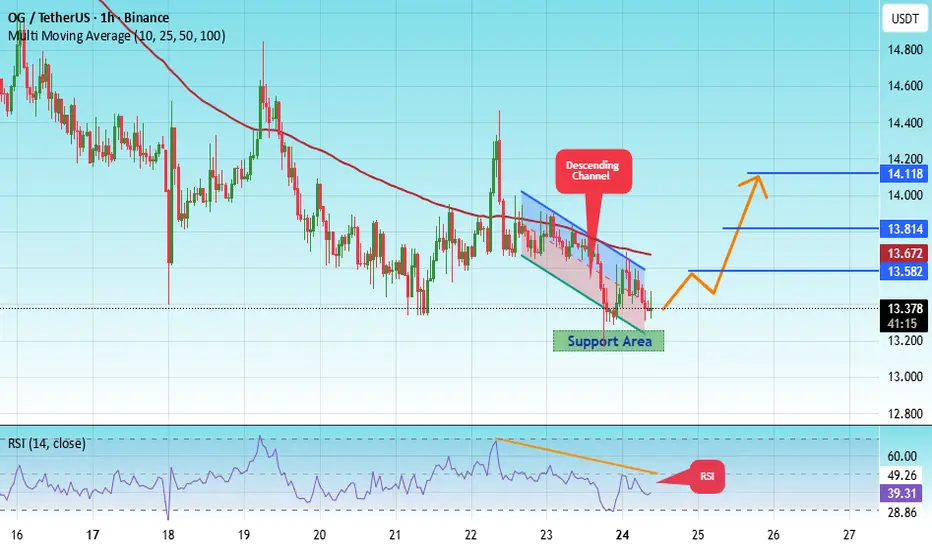
#OG/USDT Analysis. Long Setup#OG
The price is moving within an ascending channel on the 1-hour timeframe and is adhering to it well. It is poised to break out strongly and retest the channel.
We have a downtrend line on the RSI indicator that is about to break and retest, which supports the upward move.
There is a key support zone in green at 13.20, representing a strong support point.
We have a trend of consolidation above the 100-period moving average.
Entry price: 13.38
First target: 13.58
Second target: 13.80
Third target: 14.10
Don't forget a simple money management rule:
Place your stop-loss order below the support zone in green.
Once the first target is reached, save some money and then change your stop-loss order to an entry order.
For any questions, please leave a comment.
Thank you.
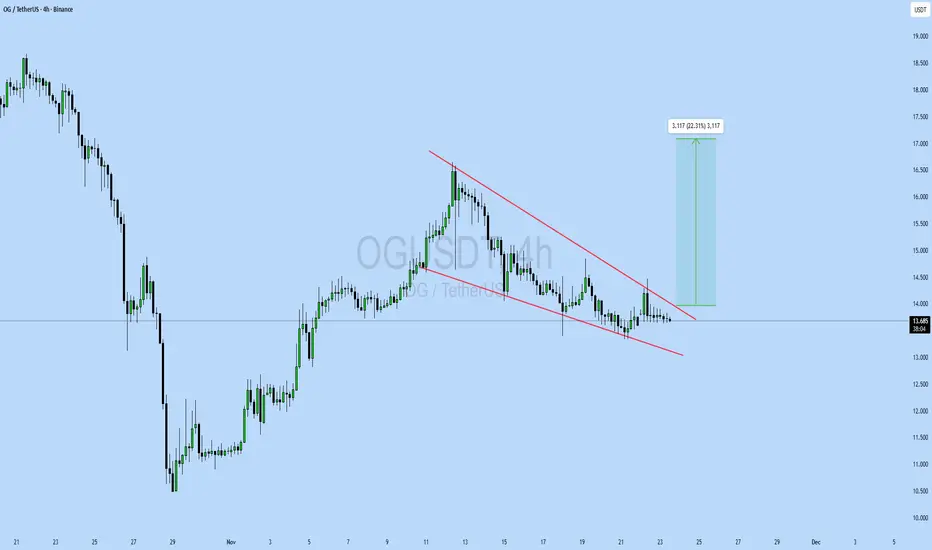
OGUSDT UPDATE#OG
UPDATE
OG Technical Setup
Pattern: Falling Wedge Pattern
Current Price: $13.67
Target Price: $16.78
Target % Gain: 22.31%
Technical Analysis: OG is breaking out of a falling wedge pattern on the 4H chart, showing early bullish momentum. The price has moved above the resistance trendline with steady candles forming near the breakout zone. The structure suggests a continuation toward the measured move target as long as the breakout holds and buyers maintain control.
Time Frame: 4H
Risk Management Tip: Always use proper risk management.
OGUSDT 12H#OG is facing the descending resistance and the 12H SMA100. Consider buying here and near the support levels at:
$13.792
$12.833
$12.126
In case of a breakout above both resistances, the potential targets are:
🎯 $17.126
🎯 $18.616
🎯 $20.738
🎯 $23.441
⚠️ Always use a tight stop-loss and apply proper risk management.
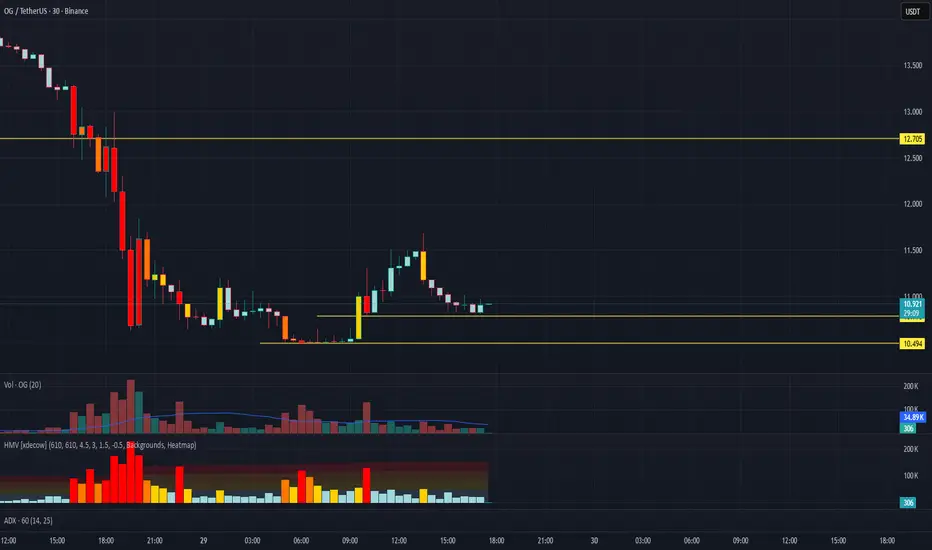
OG/USDT Analysis. Long Setup
On this asset, we’ve detected a large number of volume anomalies, which suggests strong accumulation by a major player. Additionally, there’s a structural breakout on the chart, and above the current price, we can see a volume gap, creating potential for upward movement.
In the order book, below $10.8, there are limit buy orders totaling around $1.7 million, which is a significant volume for this coin.
We’re considering a long position from current levels or after a false breakout of $10.5, where the first signs of abnormal activity appeared.
Growth target: $12.7.
This publication is not financial advice.
Scalp Long – OG💎 Scalp Long – OG
RSI indicates strong oversold conditions, forming a double-bottom pattern that suggests a potential reversal.
Price is consolidating, while buying volume is gradually increasing, showing signs of a recovery setup.
🎯 Plan:
→ Enter after confirmation of bullish breakout from the accumulation zone.
→ TP: 13.63 | SL: 10.38 | RR: 1 : 5.98
Market structure favors a rebound.
Keep positions lean, trail SL as price gains momentum.
Stay patient — only enter once the setup confirms clearly.
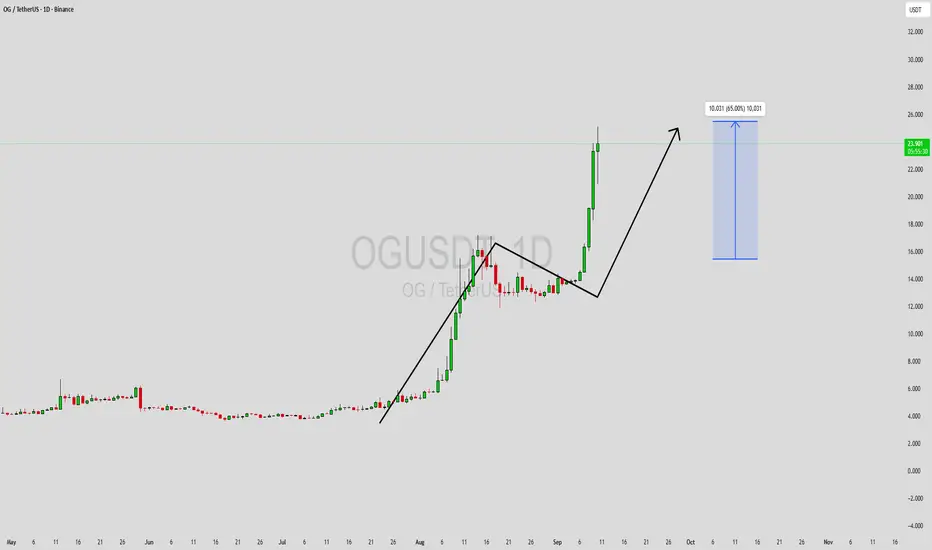
OGUSDT Forming Bullish ContinuationOGUSDT is currently displaying a strong bullish continuation setup, as seen in the recent price breakout and consolidation phase. After a massive rally, the pair entered a brief period of correction, which acted as a healthy retest before momentum returned to the upside. With strong buyer interest and a clear uptrend, the structure is pointing toward further gains, aligning with the 40% to 50%+ profit expectation.
Volume analysis supports this move, as trading activity has remained consistently strong throughout the rally. Sustained volume during bullish retracements is often a sign of smart accumulation, indicating that investors are positioning themselves for the next leg higher. The momentum breakout has confirmed renewed strength, signaling that OGUSDT is ready to push toward new resistance levels.
Investor confidence in OGUSDT continues to grow as the project gains attention in the market. The current setup provides traders with a favorable risk-to-reward ratio, especially given the clear breakout structure and potential upside targets. If momentum continues, we may see OGUSDT extend its bullish trend in the coming sessions.
✅ Show your support by hitting the like button and
✅ Leaving a comment below! (What is You opinion about this Coin)
Your feedback and engagement keep me inspired to share more insightful market analysis with you!
OGUSDT Forming Bullish ContinuationOGUSDT is currently displaying a strong bullish continuation setup, as seen in the recent price breakout and consolidation phase. After a massive rally, the pair entered a brief period of correction, which acted as a healthy retest before momentum returned to the upside. With strong buyer interest and a clear uptrend, the structure is pointing toward further gains, aligning with the 40% to 50%+ profit expectation.
Volume analysis supports this move, as trading activity has remained consistently strong throughout the rally. Sustained volume during bullish retracements is often a sign of smart accumulation, indicating that investors are positioning themselves for the next leg higher. The momentum breakout has confirmed renewed strength, signaling that OGUSDT is ready to push toward new resistance levels.
Investor confidence in OGUSDT continues to grow as the project gains attention in the market. The current setup provides traders with a favorable risk-to-reward ratio, especially given the clear breakout structure and potential upside targets. If momentum continues, we may see OGUSDT extend its bullish trend in the coming sessions.
✅ Show your support by hitting the like button and
✅ Leaving a comment below! (What is You opinion about this Coin)
Your feedback and engagement keep me inspired to share more insightful market analysis with you!
OG Fan Token Coin Price Prediction and Technical AnalysisOG/USDT has exploded higher with a parabolic move, surging from the consolidation range and breaking past the 16.964 resistance with strength. Price is now trading near 22.7, showing signs of possible short-term exhaustion after the steep rally. If buyers manage to hold above 16.964, continuation toward higher levels remains likely. However, if momentum cools, a retest of 16.964 or even the deeper 12.344 demand zone could occur before another bullish leg.
📈 Key Levels:
Buy trigger: Retest/hold above 16.964 support
Buy zone: 16.96 – 17.20 region (secondary at 12.34 if deeper pullback)
Target: 22.70+ continuation zone
Invalidation: Daily close below 12.344 (would signal weakening bullish momentum)
👉 Follow me for More Real Time Opportunities.
Share your Thoughts if you have any?