OKB Distribution Trap: Is a Sharp Drop Coming?Yello Paradisers! Are you prepared for a potential sharp downside move on #OKB, or are you still calling this “just a healthy pullback” while smart money quietly distributes above you? At first glance, the structure may look harmless. But when we remove emotions and read the chart objectively, the story changes completely. This is not a random retracement. This is a high-risk zone where discipline matters more than opinions.
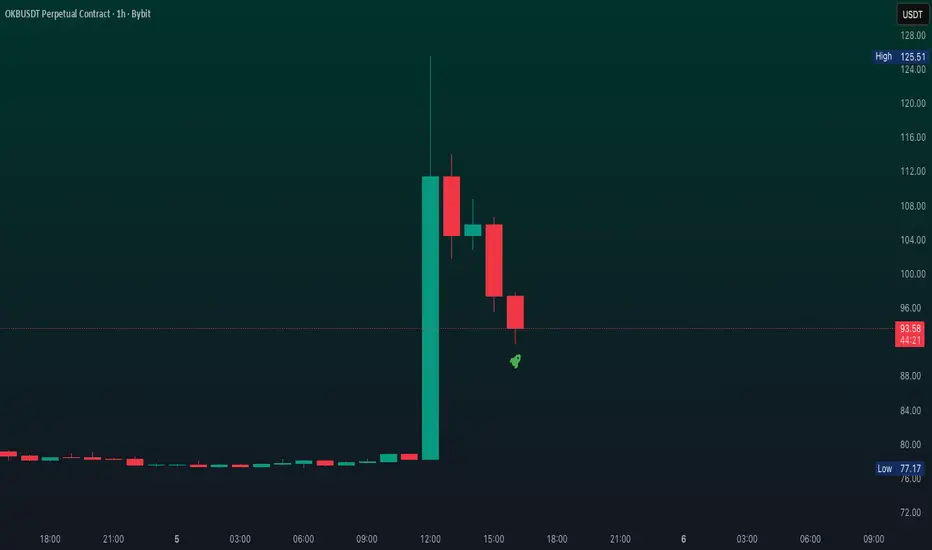
💎#OKB has printed a clear buying climax followed immediately by a climactic action candle. This is one of the most important probability professional traders watch closely during potential distribution phases. In simple terms, institutions often use aggressive upward volatility to offload positions into retail FOMO while inexperienced traders continue buying late into the move.
💎#OKB recent breaks below the buying climax lower trigger line is an extremely important development. This was not just random volatility — It was a strong momentum breakdown, and because this weakness appeared for the second time supported with a two-bar reversal showing that sellers are slowly beginning to dominate the market structure. If price confirms another breakdown below this trigger area, the probability of a much deeper correction increases significantly.
💎The next major downside target remains around 66.100, and if bearish momentum accelerates, this level could be reached much faster than most market participants currently expect. This is exactly why emotional trading becomes dangerous during these conditions. Markets move aggressively when the majority becomes overly confident.
💎#OKB continues respecting the descending resistance trend-line perfectly, failing multiple times to reclaim higher levels. This repeated rejection confirms ongoing structural weakness. Additionally, overall structure is bearish and market respect the order block + FVG zone in the retracement phase.
💎As long as price sustained momentum within the supply zone, probabilities continue favoring further downside continuation. The immediate support around 70.200 now acts as the first downside magnet, and losing this area could accelerate panic selling across the market.
💎If #OKB manages to break above the key resistance at 84.500 with a strong momentum candle, this whole bearish probability would be invalidated, and we could instead see a bullish continuation. As always, we let price confirm our bias.
Discipline is key, Paradisers! The charts may look volatile, but this is where professionals thrive and amateurs panic. Don’t let emotions guide your trades. Wait for clear confirmation and manage risk like a pro. Strive for consistency, not quick profits. Treat the market as a businessman, not as a gambler.
MyCryptoParadise
iFeel the success🌴
In-depth trading ideas
OKB: local squeeze with $108 destinationThe Macro Picture 🗺️
After a deep flush to the $60 macro floor in February and a violent reclaim spike toward $125, OKB has spent nearly three months coiling inside an $80–$92 accumulation box. This kind of prolonged structural reset typically clears out over-leveraged shorts and rebuilds liquidity at both edges of the range — a textbook playground for the next directional impulse. Price is now breaking the upper boundary with conviction, and the path of least resistance is opening toward the next macro level.
The Setup ⚙️
The Squeeze: The $80–$92 box compressed volatility for nearly three months while the structure quietly absorbed sell pressure. The latest impulse cleared $92 on expanded range, signaling that bulls are no longer defending — they are advancing.
The Trigger: The breakout candle pushed price to ~$96 with RSI snapping to the overbought side near 75. As indicated by the white projection, a pullback to retest $92 as the new support flip is the high-confluence continuation scenario.
The Support Flip: The former range ceiling at $92 now converts into the immediate defense line. Bulls desperately need this level to hold on the first retest — a clean reclaim is what unlocks the path toward the macro ceiling.
The Roadmap: Primary target sits at $108 — the macro ceiling that has capped every rally since January and the next high-confluence resistance above the box. Invalidation: a sustained 1D close back below $85 would invalidate this bullish thesis and signal the breakout was a trap, dragging price back into the accumulation range.
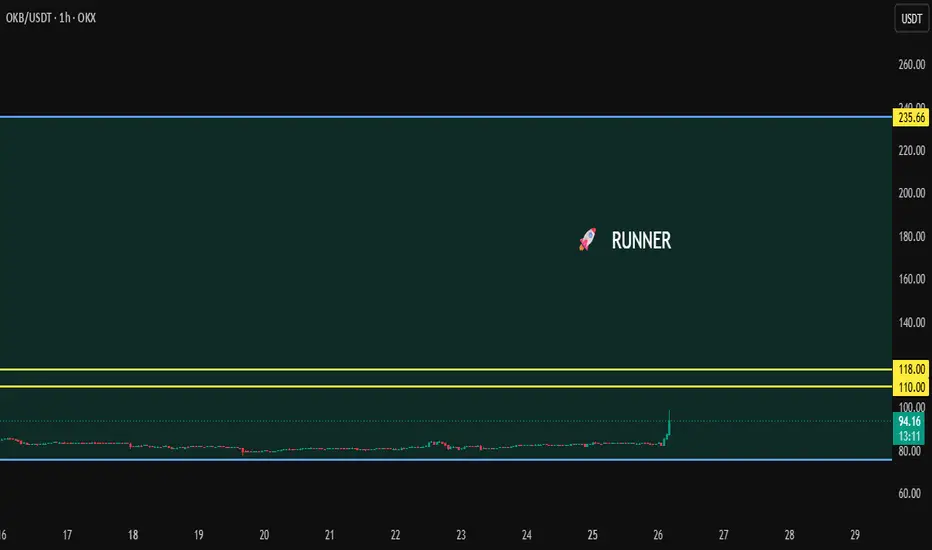
OKB/USDT – Update NEW INCREASE IN VIEW📊 OKB/USDT – Update
OKB continues showing strong price stability while building momentum above the key support zone. The recent breakout attempt suggests buyers are stepping back in, increasing the probability of a larger continuation move if trend confirmation follows.
🎯 TP 1: 110.00
🎯 TP 2: 118.00
🚀 TP 3: Runner target open — allowing the trend to capture maximum upside potential.
👉 As long as price remains above the support zone, the bullish scenario stays active.
This is our trading expectation and not financial advice — everything depends on confirmed trend continuation.
OKB (OKB/USDT): 1H Outlook — Impulsive BreakoutOKB is currently exhibiting a strong bu llish momentum on the hourly (1H) timeframe. Following a period of local consolidation and a successful retest of the value area, the price has initiated an impulsive leg to the upside. The current technical landscape suggests a continuation of the trend toward higher Fibonacci extension levels.
Market Structure:
The price action shows a clear shift from a sideways range into an impulsive bullish sequence.
We have observed a confirmed reaction from the 0.5 Fibonacci support level ($87.49), which served as the foundation for the current push higher.
Fibonacci Confluence:Current Pivot: Price is currently trading near the 0.786 Fibonacci level ($88.93). A sustained move above this level confirms the strength of the trend.
Resistance/Targets:
Target 1: $90.00 (The previous local peak / 1.0 Fib level).
Target 2: $91.20 (1.238 Fibonacci extension).
Final Target: $91.92 (1.382 Fibonacci extension).
Momentum Projection:
The anticipated "zigzag" path (green line) suggests a brief consolidation near the $90.00 psychological level followed by an expansion toward the $91.20 zone.
OKB 4H – Compression Inside Symmetrical TriangleOKB on the 4H timeframe is currently trading around 84.52 while compressing inside a well-defined symmetrical triangle formed by a descending resistance trendline from the March highs and a rising support trendline from the March lows.
Both trendlines have been respected multiple times across several weeks, and the structure is now tightening with price sitting at mid-range.
Volatility is contracting as the two boundaries converge.
Key Levels To Watch
87.50–88.00 → Descending resistance trendline, upper boundary
85.00 → Minor horizontal resistance just above current price
84.50 → Current price, mid-triangle zone
84.00 → Horizontal support inside range
82.50–83.00 → Rising support trendline, lower boundary
Below 80.70 → Full structure breakdown
As long as OKB remains inside this tightening triangle, structure is neutral and a directional expansion is pending.
A clean break and close above 88.00 descending resistance would signal a bullish resolution and open room toward 90.00+.
A breakdown below the rising support trendline near 82.50 would resolve the triangle to the downside and open room toward 80.70 and below.
This is a compression setup.
Breakout from this triangle will define the next directional move.
Neutral inside range.
Bias only on confirmed breakout or breakdown.
OKB price analysis📈 CRYPTOCAP:OKB jumps again — this time on major institutional news
Last time CRYPTOCAP:OKB pumped after the tokenomics update announcement.
Today the move in OKX:OKBUSDT came after news that Intercontinental Exchange (ICE) — the operator of major global exchanges including the New York Stock Exchange — has invested in OKX and launched a new stage of strategic cooperation.
The plan includes:
🔹 Access for OKX users to ICE US futures markets
🔹 Trading of tokenized NYSE stocks
🔹 Integration of traditional financial assets directly on the crypto platform
Interestingly, the first non-crypto trading pairs have already appeared.
One platform, multiple asset classes, deep liquidity — this could become a powerful growth driver.
📊 From a technical perspective, it would be great to see OKX:OKBUSDT firmly holding above $88.
If the exchange also introduces additional benefits for CRYPTOCAP:OKB holders, this partnership could open a completely new growth cycle for the token.
Looking at the broader picture, targets around $200–$240 within the next 6 months no longer look unrealistic if the momentum continues.
❓ Do you think this ICE partnership can become a long-term driver for OKB, or is it just a short-term news pump?
______________
◆ Follow us ❤️ for daily crypto insights & updates!
🚀 Don’t miss out on important market moves
🧠 DYOR | This is not financial advice, just thinking out loud
OKB: bounce or breakdown? key levels to watch this weekOKB
Who’s watching this dip into the demand zone and thinking “is this where the bounce starts?” According to industry sources, OKX ecosystem news and steady exchange volumes keep this token on the radar, even while the broader market chops around. Today price is parked right inside a big green support block after a multi‑day bleed, so this is where bulls either wake up or get steamrolled.
On the 4H chart I see a ranging structure with repeated wicks into the same support and RSI grinding just under midline, not oversold but cooled off. I’m leaning long from this demand area, looking for a rotation back toward the mid‑range, helped by any positive liquidity or listing headlines that attract fresh buyers. If we get a strong 4H candle closing above the local mini‑range high, that’s my confirmation that sellers are finally running out of ammo.
My base plan: accumulate in the green zone and target the 84–87 region first, with potential extension into the red supply blocks above if momentum kicks in. Invalid for me if price loses the lower edge of the demand area and closes below it decisively – then it opens a clean path to a deeper flush and I step aside. I might be wrong, but for now this looks like classic “buy the fear, sell the boredom” territory.
OKB – Demand Zone Reaction?OKB has recently shown a strong reaction from the marked demand zone, signaling that buyers are stepping in.
As price retests this demand area, we will be looking for short-term long setups, anticipating a potential rebound.
However, for the bulls to take control on the higher timeframe, a confirmed break above the blue structure around 127 will be required.
Such a breakout would signal a shift from short-term recovery to a broader bullish move.
⚠️ Disclaimer: This is not financial advice. Always do your own research and manage risk properly.
📚 Stick to your trading plan regarding entries, risk, and management.
Good luck! 🍀
All Strategies Are Good; If Managed Properly!
~Richard Nasr
OKB: breakout potential? key levels to watch for the days aheadOKB. Who else woke up and thought this 4H candle looked illegal in some states? Exchange tokens have been catching a bid again as volumes pick up and, according to market chatter, traders rotate back into high‑beta CEX plays. Today OKB ripped straight out of its range and the market reacted instantly.
On the 4H chart, price launched from the green demand block around 80‑85 and is now banging its head under resistance near 95‑100 with RSI deep in overbought territory. Main volume sits below us, so up here it’s thin air until the next supply around 105‑115. ✅ Key zones I’m watching: 88‑90 support, 100‑105 first resistance, 114‑120 extension. I might be wrong, but blindly shorting this kind of momentum feels like volunteering for a margin call.
My base plan: I want a cool‑down and a retest of 88‑90 to see if bulls defend; if they do, I like the long idea back toward 105 then 115. If buyers lose 85 on a 4H close, I’ll treat this as a blow‑off and look for a deeper flush into 78‑72 before thinking long again. For now I’m flat, letting FOMO burn off while the chart sets up a cleaner entry.
OKB: recovery or further decline? key levels to watch todayOKB. Still recovering from that brutal liquidation crash? After the wipeout and all the talk about compensations and “risk controls” according to industry sources, the market is clearly in trust‑rebuild mode, and OKB is trading like a wounded alt. That’s why this sideways chop here matters a lot: it’s either a base for recovery or just a pause before the next leg down.
On the 4H chart price is stuck under local resistance around 75‑77 with a flat, heavy range and RSI failing to get back above 50. Volume profile shows a fat node right here and a vacuum below, while all the serious supply zones sit much higher near 95‑110. That combo makes me lean to the downside over the next days, expecting sellers to press again once this support gives up.
My base plan: if 72 breaks and flips to resistance, I see room toward 68 and then the green demand area near 60 ✅ I’m watching shorts from the upper edge of the range with a tight invalidation above 80. Alternative: if buyers suddenly reclaim 80 and hold a 4H close, that opens the door for a squeeze into 90‑95 and I step aside or rethink long. I might be wrong, but ignoring risk here is how accounts get flash‑crashed too ⚠️
OKB - Structure Holding, Bulls PreparingOKB is currently going through a corrective phase after the strong impulsive move higher. That correction, however, is now bringing price back into a major structure and demand zone that previously acted as a strong base.
This area is technically important. It combines historical structure with demand, making it a key decision zone for the next move.
As long as this structure holds, the bias remains constructively bullish, and we will be looking for long opportunities, not shorts.
For bulls to fully regain control, price needs to break above the falling red channel, signaling the end of the correction and a shift back into trend continuation.
Until then, patience is key. This is where markets decide.
⚠️ Disclaimer: This is not financial advice. Always do your own research and manage risk properly.
📚 Stick to your trading plan regarding entries, risk, and management.
Good luck! 🍀
All Strategies Are Good; If Managed Properly!
~Richard Nasr
Bear Flag Formation — Downside Continuation Toward 91–88A clear bear flag has formed after a strong impulsive bearish move. Price is currently consolidating inside an ascending corrective channel, which typically represents a pause before trend continuation rather than a reversal.
After this corrective bounce, I expect a breakdown below the lower boundary of the flag and continuation of the bearish trend. The measured move of the pattern suggests a downside target in the 91–88 zone, which also aligns with a potential demand/support area.
The bearish scenario remains valid as long as price stays below the upper boundary of the flag. A decisive breakdown with momentum would confirm the setup.
OKB - The 100 Level TestThis one is pretty straightforward.
OKB is still trading inside a clear range, and price is now pushing into the lower bound of that range, right around the $100 round number.
That area matters. It has acted as support before, and it’s doing so again....
As long as:
• the lower range support holds
• and $100 remains intact
➡️ I’ll be looking for long setups , targeting a move back toward the upper bound of the range.
If $100 fails, the idea is invalid.
If it holds, the range trade remains in play.
⚠️ Disclaimer: This is not financial advice. Always do your own research and manage risk properly.
📚 Stick to your trading plan regarding entries, risk, and management.
Good luck! 🍀
All Strategies Are Good; If Managed Properly!
~Richard Nasr
OKB Traders Are Being Set Up Is This the Final Trap Before DropYello Paradisers! Are you watching what’s happening with #OKB right now? Because this move might be the last warning before a much deeper drop. We’ve spotted a series of red flags, and the chart is speaking loud and clear smart money is positioning, and it’s not on the bullish side, Even more importantly, #OKB swept the upper trigger line of buying climax. The price action on higher time frames shows a clear bearish structure there is a major probability for the downside move.
💎#OKB respected the descending resistance and failed to break above it, which confirms ongoing weakness. #OKB momentum has now clearly shifted to the downside and mitigate the fair value gap, as long momentum sustained within the supply zone, we can expect a further move down toward the minor support level of 109.
💎#OKB swept the upper trigger line liquidity of the buying climax, strongly suggesting that institutional players are offloading and preparing for more downside move according to volume spread analysis (VSA).
💎#OKB swept buy side liquidity with upthrust test which confirmed the weakness, if momentum holds, the next major target sits around 106 that could be tested soon.
💎If #OKB manages to break above the key resistance at 120.6 with a strong momentum candle, this whole bearish probability would be invalidated, and we could instead see a bullish continuation. As always, we let price confirm our bias.
Discipline is key, Paradisers! The charts may look volatile, but this is where professionals thrive and amateurs panic. Don’t let emotions guide your trades. Wait for clear confirmation and manage risk like a pro. Strive for consistency, not quick profits. Treat the market as a businessman, not as a gambler.
MyCryptoParadise
iFeel the success🌴
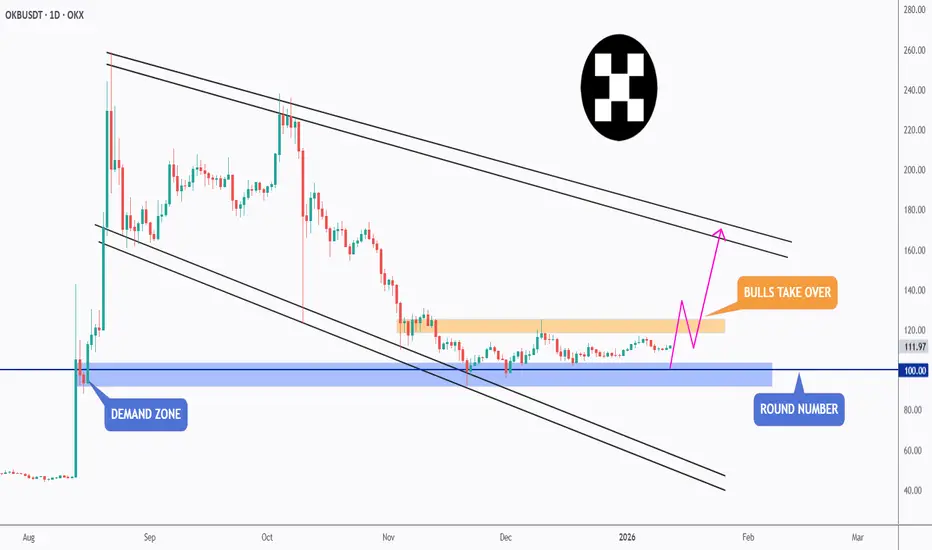
OKB - The Level Everyone Is Watching!OKB is currently sitting at a very strong rejection zone , and this one is hard to ignore.
Price is reacting around the $100 round number, which lines up perfectly with a clear demand zone. This area has already proven its importance in the past, and once again, buyers are stepping in.
Structurally, OKB is still trading inside a falling wedge, which is typically a bullish formation when defended from below.
As long as this demand + round number confluence continues to hold, I’ll be looking for trend-following long setups, targeting a move back toward the upper bound of the falling wedge.
⚠️ Disclaimer: This is not financial advice. Always do your own research and manage risk properly.
📚 Stick to your trading plan regarding entries, risk, and management.
Good luck! 🍀
All Strategies Are Good; If Managed Properly!
~Richard Nasr
OKB - Quiet Accumulation Before the Next Move?OKB has been through a long corrective phase, grinding lower inside a descending channel.
What stands out now is context.
Price is sitting on a major demand zone, a level that previously sparked strong upside momentum.
Since tapping this area, sellers have clearly slowed down, and price has started to compress rather than continue lower. That’s usually the first sign that selling pressure is getting absorbed.
At the same time, OKB is now pushing back toward the key structure above. This is the line in the sand.
As long as we’re holding above demand, I’m not interested in chasing shorts down here.
🏹For bulls to truly take over , we’ll need a clean break and acceptance above the orange structure zone. That’s when momentum shifts from defensive to offensive.
Until then, we wait :)
⚠️ Disclaimer: This is not financial advice. Always do your own research and manage risk properly.
📚 Stick to your trading plan regarding entries, risk, and management.
Good luck! 🍀
All Strategies Are Good; If Managed Properly!
~Richard Nasr
OKB - Are Bulls About to Flip the Script?📉After a prolonged corrective phase, OKB is starting to show early signs of structural stabilization. Price has respected the major demand zone, where selling pressure slowed down and downside momentum clearly weakened.
⚔️What stands out now is the tight consolidation above demand, combined with a gradual reclaim of higher levels. This type of behavior often signals a shift from distribution to accumulation, especially after a long bearish channel.
📍The key focus is the orange resistance band. A clean break and hold above this area would be a strong confirmation that bulls are taking control, opening the door for a larger recovery move toward the upper bounds of the broader structure.🏹
Until that breakout happens, patience is key. Let price prove strength before committing aggressively. But structurally, this is one of those zones where risk starts favoring the upside, not the downside.
Is this the quiet phase before expansion? 🤔
⚠️ Disclaimer: This is not financial advice. Always do your own research and manage risk properly.
📚 Stick to your trading plan regarding entries, risk, and management.
Good luck! 🍀
All Strategies Are Good; If Managed Properly!
~Richard Nasr
OKB/USDT Chart Analysis 11-Dec-25Sell Stop: 95
Buy Stop: 132
Take Profit 1: 173
Take Profit 2: 211
Following the recent bearish trend, a clear RSI divergence has formed, indicating weakening downside momentum. This divergence, combined with price structure, suggests a potential shift in market direction. The trend now appears to be transitioning into a bullish phase, and a continuation to the upside is expected if price sustains above the Buy Stop level.
⚠️ Always remember to safeguard your capital with a well-placed stop-loss and disciplined risk management.
OKB - Demand Holding Strong… Correction on the Horizon?📉OKB is currently trading inside a broad falling channel , but price has just reacted from a major demand zone, which also aligns with the lower bound of the black channel. This confluence creates a strong oversold area where buyers typically step in.
⚔️As long as this demand zone continues to hold, we will be looking for bullish correction setups toward the upper bound of the falling channel. This would be the natural corrective wave after an extended sell-off.
🏹However, for the bulls to fully confirm control, price must break and hold above the orange high. A breakout above that structure would signal a shift in momentum and open the way for a larger trend reversal.
For now, demand is holding, the channel is intact, and the market is positioned for a potential rebound… will OKB deliver the correction we’re waiting for? 🤔
⚠️ Disclaimer: This is not financial advice. Always do your own research and manage risk properly.
📚 Stick to your trading plan regarding entries, risk, and management.
Good luck! 🍀
All Strategies Are Good; If Managed Properly!
~Richard Nasr
OKB - Entering the Oversold Zone!📉OKB has been steadily correcting within a descending channel , but the price is now approaching a massive confluence area, the intersection of the blue demand zone, lower black trendline, and the oversold region.
⚔️This area has historically acted as a strong accumulation zone, where buyers tend to step back in and drive the next impulsive wave. From here, I’ll be looking for long opportunities, ideally after a clear bullish confirmation or a break above the short-term red channel.
🏹If the bulls manage to defend this zone, we could see a strong push toward the upper bound of the black channel, around the $200 mark.
⚠️ Disclaimer: This is not financial advice. Always do your own research and manage risk properly.
📊All Strategies Are Good; If Managed Properly!
~Richard Nasr
OKB a Perfect example of a successful analysis Dear all;
today I have OKB, this the first time a pay attention for this coin and guess what?
when I did analysis it using my tools it did respect my analysis pretty good so far, and I expect it
to hit all the target very easily.
I did notice another opportunity within the current one as you see in the chart and the all current target (T1) is almost matching with the new one (T2).
Good Luck.