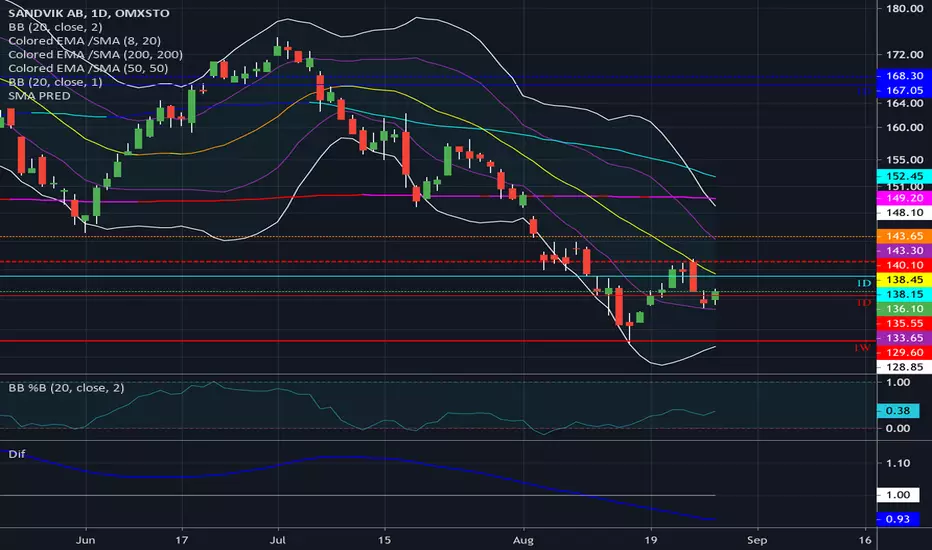
Swing Trade Sandvik ABSwing trade in Sandvik AB. Upside of 7% and a Risk Reward of 3.2.
Entry 200, SL 195.40 & TP Level at 213.9.
When I get to the TP Level I will trail the stop Bar By Bar. This means I will place SL just below the previous day's low with the intention that we will break higher than 213.9.
Good luck.
Sandvik AB
No trades
No trades
Compare with Sandvik
13.4 SEK
14.69 B SEK
120.68 B SEK
1.02 B
Last report date
Jul 17, 2026
Report period
Q2 2026
EPS
4.17 SEK
Revenue
36.75 B SEK
Earnings call summary
Record Q2 results with double-digit growth in orders and revenues, driven by strong mining and machining segments, strategic acquisition of Diemme Filtration, and robust price realization. Margins and profits reached new highs, with positive outlook despite macro uncertainty.
Details
Sector
CEO
Stefan Widing
Website
Headquarters
Stockholm
Founded
1897
IPO date
Mar 15, 1905
ISIN
SE0000667891
FIGI
BBG000BR0GN6
Identifiers
ISIN SE0000667891
Sandvik AB engages in the development, manufacture, and sale of tools, equipment, and tooling systems for the mining and construction industries. It operates through the following segments: Mining, Rock Processing, Machining, and Intelligent Manufacturing. The Mining segment focuses on the supply of equipment, tools, parts, service, and technical solutions for the mining and infrastructure industries. The Rock Processing segment refers to equipment, service and technical solutions for processing rock and minerals. The Machining segment consists of tools, tooling systems and services that optimize machining operations. The Intelligent Manufacturing segment comprises of digital manufacturing and software solutions for design and planning automation and industrial metrology. The company was founded by Göran Fredrik Göransson in 1862 and is headquartered in Stockholm, Sweden.
Why I am shorting Sandvik [SAND] | Technical AnalysisFor you who would like to check the company out more in dept: www.home.sandvik
§1 Fundamental blah blah
§2 Position and forecast
§3 Technical summary
§1 Fundamental blah blah
Sandvik is a Swedish company which is well diversified troughout the mechanical industry.
They make things like:
Ceramic
See all ideas
Summarizing what the indicators are suggesting.
Neutral
SellBuy
Strong sellStrong buy
Strong sellSellNeutralBuyStrong buy
Neutral
SellBuy
Strong sellStrong buy
Strong sellSellNeutralBuyStrong buy
Neutral
SellBuy
Strong sellStrong buy
Strong sellSellNeutralBuyStrong buy
An aggregate view of professional's ratings.
Neutral
SellBuy
Strong sellStrong buy
Strong sellSellNeutralBuyStrong buy
Neutral
SellBuy
Strong sellStrong buy
Strong sellSellNeutralBuyStrong buy
Neutral
SellBuy
Strong sellStrong buy
Strong sellSellNeutralBuyStrong buy
Displays a symbol's price movements over previous years to identify recurring trends.
3.366% YTM
Maturity dateSep 27, 2029
Coupon3.75% (Fixed)
3.274% YTM
Maturity dateNov 25, 2028
Coupon0.38% (Fixed)
3.006% YTM
Maturity dateJun 7, 2027
Coupon2.13% (Fixed)
See all SAND bonds
Frequently asked questions
The current price of SAND is 347.7 SEK — it has decreased by −0.40% in the past 24 hours. Watch Sandvik AB stock price performance more closely on the chart.
Depending on the exchange, the stock ticker may vary. For instance, on OMXSTO exchange Sandvik AB stocks are traded under the ticker SAND.
SAND stock has fallen by −11.36% compared to the previous week, the month change is a −15.05% fall, over the last year Sandvik AB has showed a 45.48% increase.
We've gathered analysts' opinions on Sandvik AB future price: according to them, SAND price has a max estimate of 465.00 SEK and a min estimate of 290.00 SEK. Watch SAND chart and read a more detailed Sandvik AB stock forecast: see what analysts think of Sandvik AB and suggest that you do with its stocks.
SAND reached its all-time high on Jul 3, 2026 with the price of 413.1 SEK, and its all-time low was 33.3 SEK and was reached on Sep 21, 2001. View more price dynamics on SAND chart.
See other stocks reaching their highest and lowest prices.
SAND stock is 2.47% volatile and has beta coefficient of 1.41. Track Sandvik AB stock price on the chart and check out the list of the most volatile stocks — is Sandvik AB there?
Today Sandvik AB has the market capitalization of 435.15 B, it has decreased by −13.15% over the last week.
Yes, you can track Sandvik AB financials in yearly and quarterly reports right on TradingView.
Sandvik AB is going to release the next earnings report on Oct 22, 2026. Keep track of upcoming events with our Earnings Calendar.
SAND earnings for the last quarter are 4.17 SEK per share, whereas the estimation was 4.41 SEK resulting in a −5.44% surprise. The estimated earnings for the next quarter are 4.41 SEK per share. See more details about Sandvik AB earnings.
Sandvik AB revenue for the last quarter amounts to 36.75 B SEK, despite the estimated figure of 36.07 B SEK. In the next quarter, revenue is expected to reach 36.49 B SEK.
SAND net income for the last quarter is 5.24 B SEK, while the quarter before that showed 3.88 B SEK of net income which accounts for 0.00% change. Track more Sandvik AB financial stats to get the full picture.
Yes, SAND dividends are paid annually. The last dividend per share was 6.00 SEK. As of today, Dividend Yield (TTM)% is 1.73%. Tracking Sandvik AB dividends might help you take more informed decisions.
Sandvik AB dividend yield was 2.00% in 2025, and payout ratio reached 51.23%. The year before the numbers were 2.90% and 58.91% correspondingly. See high-dividend stocks and find more opportunities for your portfolio.
As of Jul 22, 2026, the company has 41.8 K employees. See our rating of the largest employees — is Sandvik AB on this list?
EBITDA measures a company's operating performance, its growth signifies an improvement in the efficiency of a company. Sandvik AB EBITDA is 32.60 B SEK, and current EBITDA margin is 23.37%. See more stats in Sandvik AB financial statements.
Like other stocks, SAND shares are traded on stock exchanges, e.g. Nasdaq, Nyse, Euronext, and the easiest way to buy them is through an online stock broker. To do this, you need to open an account and follow a broker's procedures, then start trading. You can trade Sandvik AB stock right from TradingView charts — choose your broker and connect to your account.
Investing in stocks requires a comprehensive research: you should carefully study all the available data, e.g. company's financials, related news, and its technical analysis. So Sandvik AB technincal analysis shows the sell today, and its 1 week rating is neutral. Since market conditions are prone to changes, it's worth looking a bit further into the future — according to the 1 month rating Sandvik AB stock shows the buy signal. See more of Sandvik AB technicals for a more comprehensive analysis.
If you're still not sure, try looking for inspiration in our curated watchlists.