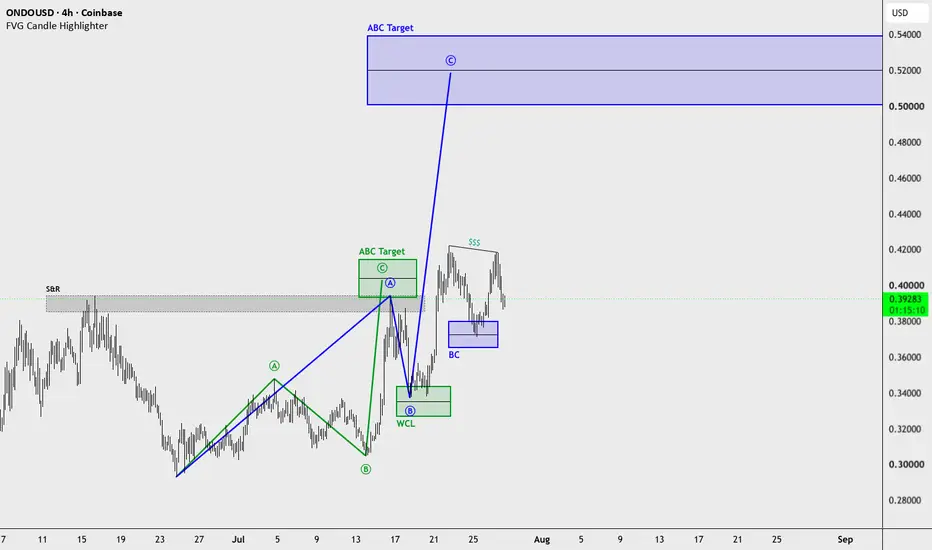
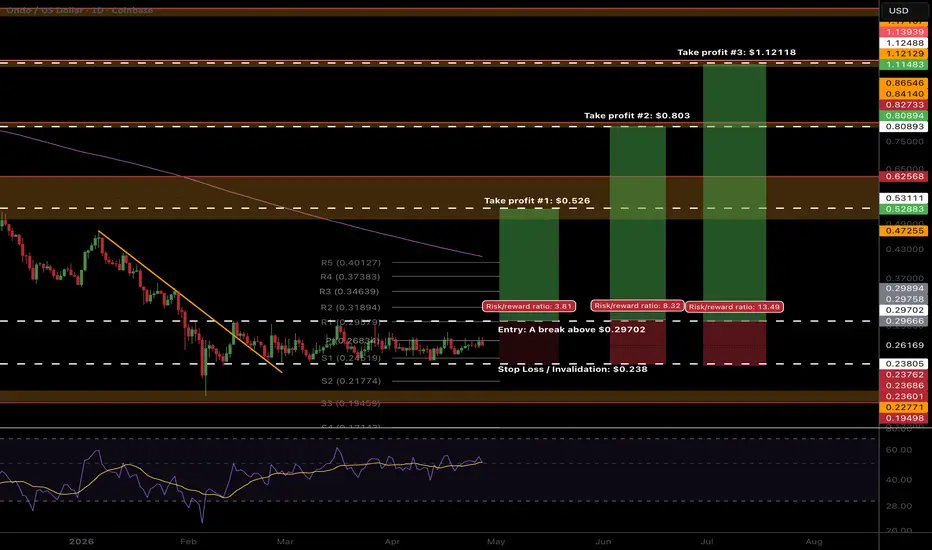
ONDO: Nested Wave Structure Signals Expansion Toward ATHOndo Finance is exhibiting a textbook nested wave sequence on the sub-daily timeframe, where a completed minor corrective cycle has laid the foundation for a larger-degree bullish expansion. After sweeping liquidity and respecting key weekly support, price staged a strong reaction upward, successfully turning local resistance into active support.
The chart highlights this nested pattern in motion. Following the initial impulse leg, price executed a discount retracement into a freshly established demand block. By defending this institutional zone, buyers have sustained a clean higher-low structure, building momentum to target the higher-degree target zone located above.
As price consolidates near support, continuation remains the path of least resistance so long as the demand block remains intact. While long-term momentum leaves room for eventual retests of historical peaks, traders should monitor reaction within the upper target zone for initial profit realization. A loss of local demand invalidates this setup and signals deeper consolidation.
In-depth trading ideas
ONDO Dips to $0.28: RWA Gem Undervalued Amid 2026?Title: 🚨 ONDO Dips to $0.28: RWA Gem Undervalued Amid 2026 Unlocks or Supply Trap? Deep Dive!
Hello TradingView community! 👋
Today, let's dive into ONDOUSD with a detailed analysis focusing on fundamentals, SWOT, and technicals. 📊 This isn't financial advice just an in-depth look based on public data.
Current Snapshot:
Price: $0.28 💵
52-Week High/Low: $2.14 / $0.20 📈📉
Market Cap: $2.84B 💰
Fundamental Analysis (e.g., Intrinsic Value and Ratios):
For crypto tokens like ONDO (governance for RWA tokenization), adapt traditional methods to tokenomics and protocol metrics. No EPS or D/E, but use MC/TVL ratio (1.1x at $2.84B MC / $2.6B TVL), book value per token approximated via circulating supply (~3.2B pre-unlock, post ~5.1B after 1.94B unlock).
For instance, DCF models might project a value range of $0.30 to $0.50 based on growth assumptions of 20% TVL increase (historical 39% rise), terminal growth 5%, and 15% discount rate, using annualized fees ~$64M as cash flow proxy. Compare to peers for relative valuation (e.g., Centrifuge lower MC/TVL but less adoption; ONDO premium due to institutional ties).
Key ratios: Negative ROE analog ( -75% 1-year return), P/E N/A, but FDV/Fees ~42x highlights efficiency and valuation status (undervalued below $0.30 without unlock pressure, but $0.41 to $0.74 forecasts imply upside post-absorption). 📈
SWOT Analysis (Strengths, Weaknesses, Opportunities, Threats):
Strengths : 💪 Leader in RWA tokenization with $2.6B TVL, products like OUSG/USDY for tokenized Treasuries, institutional partnerships (Franklin Templeton, MetaMask), and scalable multi-chain presence.
Weaknesses : ⚠️ Heavy supply unlocks (1.94B tokens in Jan 2026, 61% increase), high volatility from market corrections (88% drawdown from ATH), and limited direct revenue accrual to token holders.
Opportunities : 🌟 Growing RWA market with regulatory clarity, new integrations (e.g., Solana stocks, perpetuals platform), and events like Ondo Summit driving adoption.
Threats : 🛑 Competition from Centrifuge/others, macro risks delaying institutional inflows, and persistent unlock dilution until 2026.
Technical and Risk Insights:
Incorporate non-repainting indicators like 200-day SMA ($0.70) for support/resistance. Current RSI (30) signals oversold 🚨. Risk factors: Volatility (beta ~1.8 vs BTC, implied from altcoin nature), or factor exposure (e.g., to interest rates via Treasuries).
Consider performance attribution how much return comes from sector vs. stock selection (60% from RWA trends vs. ONDO-specific unlocks). 📉
Historical Context and Examples:
ONDOUSD has shown -75% annualized returns over 1 year, with examples like the Jan 2026 unlock leading to recovery potential (from $0.20 low rebounding amid TVL growth).
This illustrates how methods like SWOT or relative valuation can inform decisions in real markets. 📜
What do you think does this align with your view on ONDOUSD for 2026? Share your analyses or charts below! ❓
#ONDOUSD #StockAnalysis #FundamentalAnalysis #InvestingEducation
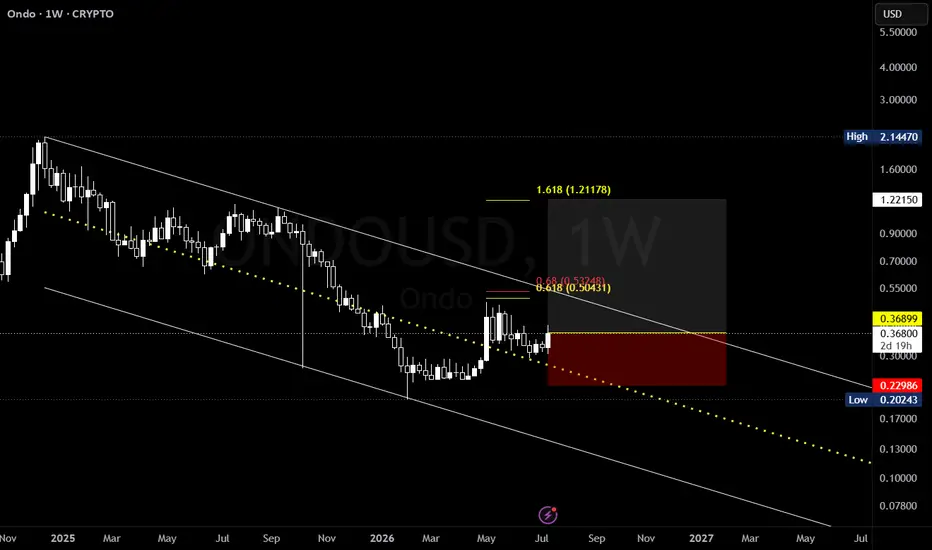
ONDO/USD — Long Setup From the $0.34-0.36 Demand ZoneAfter a brutal 15-month bleed from the $2.10 ATH (Dec 2024) to a $0.20 capitulation low (Feb 2026), ONDO printed its first real bottoming signal: a weekly bullish engulfing candle in early May that ripped from $0.287 to $0.488 on 3x average volume ($320M+). That kind of absorption after a year of distribution doesn't happen by accident.
Since then, price has built a higher low at $0.34 and is consolidating in a textbook bull flag between $0.34-$0.48.
Multi-Timeframe Read
Weekly: Rounded-bottom / possible inverse H&S in formation. Neckline at $0.55-$0.58. Measured-move target: $0.85-$0.95.
Daily: Descending flag/pennant after the May impulse. HL at $0.34, LH at $0.476. June 2 candle absorbed $0.36-$0.43 on 22M of 4H volume — second demand footprint at the flag base.
4H: Pullback in progress from $0.43. Looking for tag of the demand zone to trigger.
Key Levels
Resistance:
$0.44 — Range top / first target
$0.488 — May swing high (breakout trigger)
$0.55 — Weekly neckline / second target
$0.70 — Major weekly supply / runner target
Support:
$0.34-0.36 — Active demand zone (entry)
$0.32 — Invalidation
$0.27 — Prior consolidation floor
$0.20 — Capitulation low
The Trade:
Entry $0.35 avg (ladder $0.36 / $0.35 / $0.34)
Stop $0.32 (daily close basis)
Risk ~8.6%
T1 $0.44 → 3.0R, trim 1/3
T2 $0.55 → 6.7R, trim 1/3
T3 $0.70 → 11.7R, runner
Blended R:R if all targets hit: ~7R
Invalidation:
Daily close below $0.32 = setup is dead, do not average down
Loss of $0.27 = back to capitulation territory, full reset
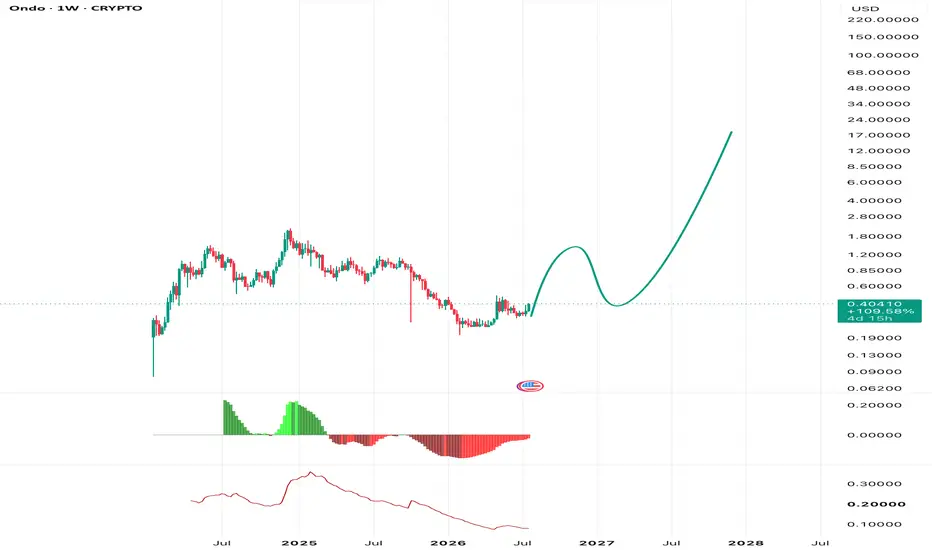
Ondo double bottom targets new ATHOndo has formed a double bottom. Macd sellside pressure is about to being bullish I believe Ondo has already moved out of its bear cycle and is ready to hit new all time highs. Perfect time to go long. Enter at either the bottom of the channel or when the neckline breaks. The measured move targets above its previous all time high. Ondo is moving don’t skip on this one. Ondo finance recently announced metamask will be selling tokenized stocks through the Ondo blockchain. It will match prices listed for stocks and fill with ondo tokenized assets. Definitely a gem of a coin.
ONDO retracing hard, but still bullishLSE:ONDO is retracing hard, but I am still in the long for now, even though it approaches entry price as it did not hit take profit #1, falling a few bucks shy. Annoying but thats the way it is sometimes.
Bulls need to see a reversal from the top of the range it breakout from or things will start too look bearish.
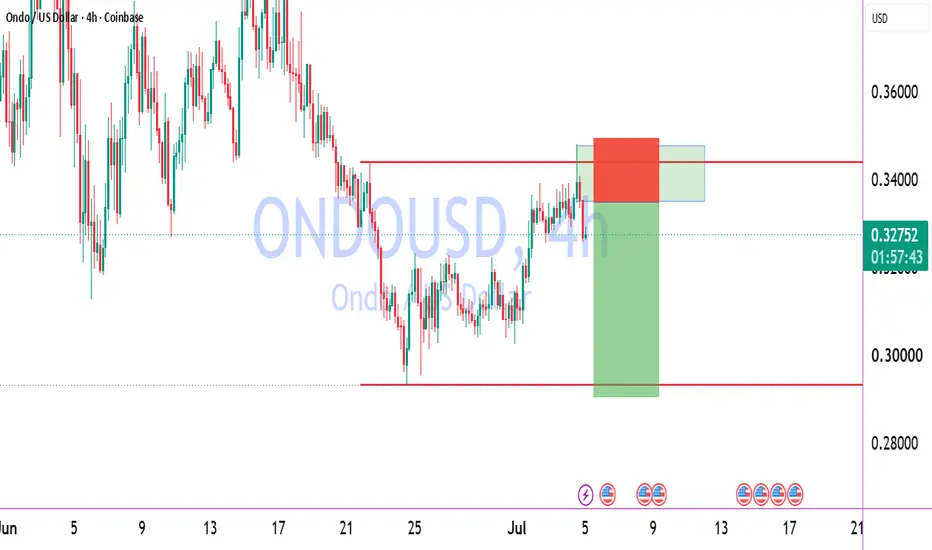
ONDO | 4hr ChartEnd of Week 19 & start to Week 20
** T.A explained **
Multiple Time-Frame Analysis; Color Code | Strength favors the higher timeframe.
Yearly timeframe = black
Monthly timeframe = pink
weekly = grey
daily = red
4hr = orange
1hr = yellow
15min = blue
5min = green if they are shown. (Level visibility on intervals is set to timeframe the level was found on and below to keep chart view organized.)
Ranges defined
A Range = two or more consecutive color candles (2+ in a row, same color creates a range)
There are two types of ranges - Accumulation Ranges &
Distribution Ranges.
*A single candle is a range on a lower timeframe. Mark the candle and then find the range / level on a lower timeframe aka "Range Finding".
Some people use boxes and call this boxing finding the zone - supply & demand zones - and marking the entire range top to bottom. This is acceptable but introduces risk by increasing probability of orders getting filled.
Candle Science further defines the zone / range into levels. So. after finding a range, identify and label the first and last candle of the range.
This is Candle Science. Everything has a default expectation and users thinking is guided by IF/THEN statements.
Below are the default expectations for each range and the first and last candle within the range.
DISTRIBUTION RANGES:
When price is above a distribution range its default expectation is to support price accumulation.
The first distribution candle in a distribution range is labeled as the BackSide Candle (BS).
Expectation = strong reaction to price. Look for price action to create long wicks reaching to or away from level. A steep angle trend is expected to form so Fair Value Gaps are expected to form on the timeframe of the level and lower timeframes.
If a steep angle trend is not forming, and long wicks are not being created then the idea is that liquidity is not there, confidence in the level is low. Price Action may then be looking for more liquidity to and seek it out at the FrontSide Candle.
FrontSide (FS) Candle = The last distribution candle in a distribution range.
Expectation = create a low angle accumulation trend reversal.
3 bar reversal patterns laddering up
like the distribution candles are the rungs of an accumulation ladder. price uses the top side of the BackSide Candle or the top side of the FrontSide Candle as support. They are used in bull flags to break distribution trends.
IF price fails to gain a BackSide or FrontSide level THEN they act as RESISTANCE. But we will then train our eyes to look at the bottom side of Accumulation Ranges because they have a default expectation as Resistance.
When Price is below an accumulation candle, the bottom side of the accumulation candle is the level of resistance.
ACCUMULATION RANGES DEFINED:
Inverse BackSide Candle (Inv.BS) = the first accumulation candle in an accumulation range.
Expectation. = strong reaction to price. long wicks reaching to or away from level. Creates a steep angle distribution trend. Usually create F.V.G's and impulsive, volatile moves like the BackSide Candle.
Inverse FrontSide Candle (Inv.FS) = The last accumulation candle in an accumulation range.
Expectation = reversal, create a low angle distribution trend. The bottom side of the accumulation candles are used as resistance levels.
TOOLS USED:
Boxes - used to define a zone by marking the entire range (if its small) or just one entire candle or just the wick of the candle to define the zone.
Horizontal Ray tool - used to define the level.
levels when dashed lines are untested, active level where buyers or sellers are waiting to create a level of interest.
Tested levels are dotted lines. If used, they reference the range and could become Origin levels or R.a.t.s in the future (levels where new trends originate or where traders are using Rejection as A Target to scalp and reverse position - aka stoploss hunters; like the rats they are.
Again the color code:
Yearly timeframe color is Black
Monthly timeframe is color pink
weekly grey
daily is red
4hr is orange
1hr is yellow
15min is blue
5min is green if they are shown.
strength favors the higher timeframe.
ONDO long triggeredLSE:ONDO is up 10% this morning triggering my long. This is a multi-month bottoming signal with oversold weekly and daily conditions.
The first resistance is the daily 200EMA, which must be overcome for bullish confidence. The series of High Volume Node targets are next as take profits.
Safe trading
ONDO Wave 2 survived, just...LSE:ONDO is having a significant pullback compared to other alts despite the RWA narrative, which is frustrating.
It came just shy of making a lower low, but did not make one, keeping wave 2 alive.
A bottom is likely in on crypto, let's see if Ondo can come back to life or if it shows relative signs of weakness.
Safe trading
ONDO, so much for the RWA narrativeLSE:ONDO is almost at all time low. the Real World Asset (RWA) narrative is still around but never really took and instead punishing anyone with capital who belives.
Weekly RSI is oversold, the Fibs have nearly be ran completely. Its the last stand for ONDO. No weekly 200EMA and well below the weekly pivot.
I think we are going to see bottoms soon enough. Dumping on a low liquidity Saturday is a suspicious move that could trigger a capitulation event.
Safe trading
Lower Lows For ONDOONDO Potentially printing sub-wave 5 of an extended 3rd wave of one higher degree. This suggests lower lows for ONDO. This also hints that the 5th impulsive wave of an even higher degree is not in yet. Key take away: Price is still impulsive to the downside.
This Publish Is Intended For Educational Purposes Only
ONDO, rekt, fresh low...LSE:ONDO
🎯Price printed a 3 white knight bullish engulfing pattern, jumping above the daily pivot before being rejected hard to fresh lows, keeping the downtrend intact. The 0.786 Fibonacci retracement has been penetrated as price loses the High Volume Node support. S1 pivot is the next target, $0.3.
📈 Daily RSI is showing unconfirmed bullish divergence.
👉 Analysis is invalidated above $0.5 swing high.
Safe trading
ABC Potentially Coming to an End Soon for ONDOABC 3-3-5
ONDO has been impulsive to the downside for quite some time; a 5 wave move. But now price is slightly above a 1:1 window Fib extension of Wave AB. This is an area to look out for a potential wave bottom. This doesn't necessarily mean a reversal but some type of ABC to the upside is a likely outcome.
Selling volume has been drying up but no evidence of RSI bullish divergence on the weekly thus far or any other bullish clues from my main indicators. But this TA suggests further retracement of Wave-C for ONDO. Key levels of support to look out for are between $0.28 & $0.33.
This Publish Is Intended For Educational Purposes Only
ONDO Short-term analysis | Trading and expectationsLSE:ONDO
🎯Price printed a 3 white knight bullish engulfing pattern, jumping above the daily pivot and the descending resistance trend-line. Price must get above $0.5 to negate the bearish divergence that has emerged. Wave 1 of a new uptrend appears to be underway.
📈 Daily RSI tapped oversold with bullish divergence, where it caught a bid.
👉 Analysis is invalidated below the swing low, $0.35
Safe trading
ONDO Macro analysis | The bigger picture | Long-term holdersLSE:ONDO
🎯 Wave 2 appears complete at the altCoin golden pocket, 0.786 Fibonacci retracement and High Volume Node support. Price is reacting well with a bullish engulfing candle. Wave 3 has an expected target in price discovery os the R£ weekly pivot $4.21, offering a 10x from here.
📈 Weekly RSI hit oversold threshold and ticked up bullishly.
👉 Analysis is invalidated below $0.35
Safe trading