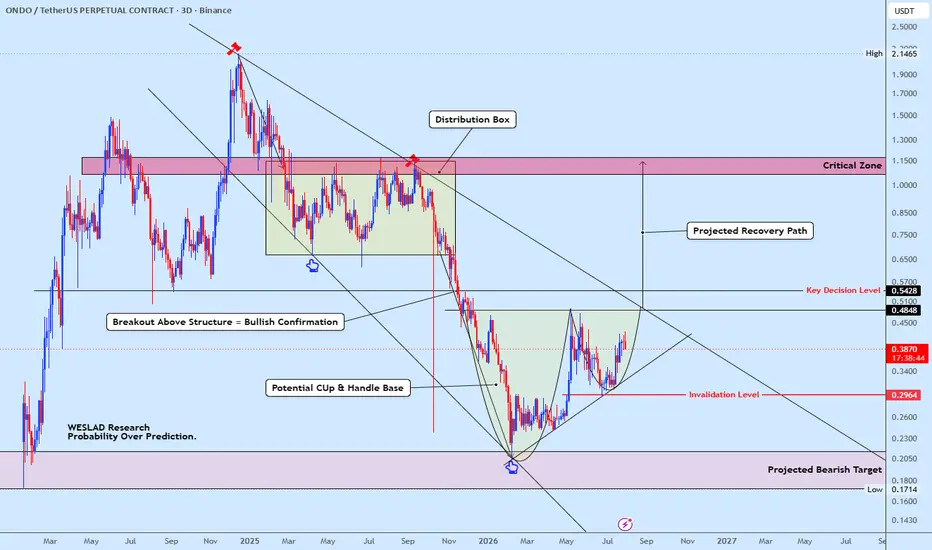
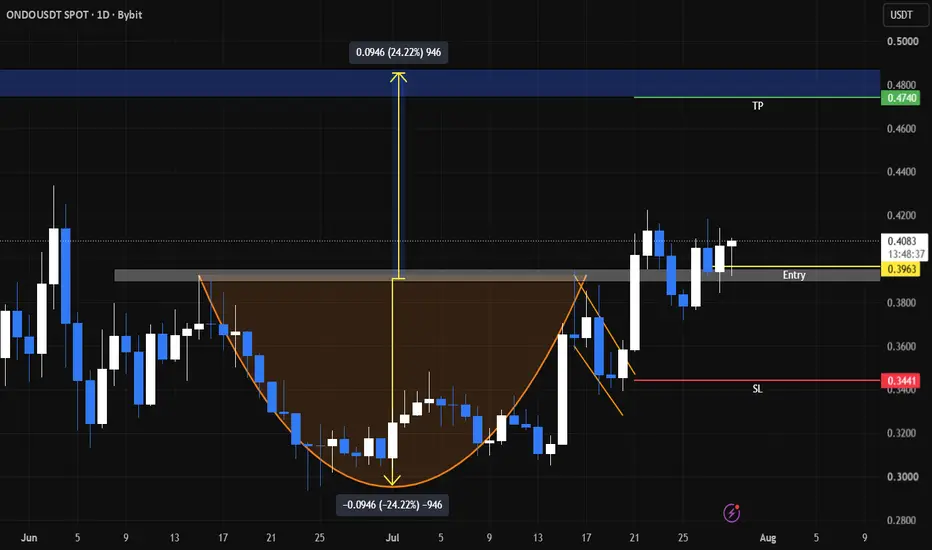
ONDOUSDT Buyers Defending Structure as Recovery Scenario BuildsONDOUSDT is developing a potential Cup & Handle base after completing an extended correction from the previous distribution phase. Price has established higher lows while respecting a key accumulation region, suggesting buyers are gradually regaining control.
The immediate focus is the key decision level around $0.54. A decisive breakout above this structural resistance would confirm bullish continuation and expose the higher-timeframe supply zone near $1.15, where significant selling pressure is expected.
Failure to hold above the $0.2964 invalidation level would weaken the bullish outlook and increase the probability of a retest toward the projected demand region. Until then, the developing structure continues to favor a constructive recovery scenario.
WESLAD Research™
Probability Over Prediction.
In-depth trading ideas
Ondo HTF Analysis: Is This the End of the Downtrend?Ondo (ONDO) HTF Review: Is This the End of the Downtrend?
Ondo has been stuck in a downtrend for 15 months, and it has now reconquered two important moving averages, arriving at the final gate to break the downtrend.
What Is Ondo?
Ondo Finance is a project that brings real world assets (RWA) onto the blockchain.
Simply put, it tokenizes traditional yield-bearing assets like US Treasury bills. In other words, it builds a bridge between DeFi and traditional finance. Its founder, Nathan Allman, is a former Goldman Sachs digital assets specialist.
Why Can Ondo Create Value?
The real story here is the BlackRock connection.
Ondo's institutional product OUSG directly holds BlackRock's BUIDL fund as its underlying. On top of that, Ondo is the single largest holder of BUIDL. In other words, it works not as a rival to the world's biggest asset manager but as a supply chain partner. As the RWA narrative grows, Ondo positions itself at the center of this trend. This may give it a fundamental backing that most altcoins do not have.
Technical Analysis
Price is currently at 0.4036 dollars.
Here is what matters. Price has climbed above both the SMA50 (0.3467) and the SMA200 (0.3147). What is more, the SMA50 is slowly sitting above the SMA200, so we can simply talk about a golden cross. In other words, the ground appears to be firming up.
However, Ondo is still inside the 15-month descending channel.
The real zone of destiny for the bulls is between 0.48 and 0.60. This area is both the channel top and strong horizontal resistance. Unless this band is cleared with a weekly close, every move up may remain just an in-channel bounce. A close above 0.60 would be the first confirmation that the downtrend has genuinely been broken.
Conclusion
Ondo looks strong on fundamentals and appears to have taken its first steps toward a reversal on the technical side.
Reclaiming the moving averages is positive but not enough on its own. The real signal will be clearing the 0.48 to 0.60 pivot zone. Before that area is passed, it is too early to say the trend has turned.
Do you think Ondo can close above 0.60 dollars weekly this cycle and break the downtrend?
ONDO: Healthy Pullback Reinforces Bullish MomentumONDO: Healthy Pullback Reinforces Bullish Momentum – Risk Management Protocol at the $0.50 Resistance Floor
ONDO has officially entered a powerful breakout expansion wave, validating the accuracy of our previous technical framework. Notably, prior to launching its current upward surge, the price action executed a successful retest against the dynamic MA100 trendline support. This brief technical dip functioned as a healthy cooling-off phase, effectively flushing out short-term profit-taking while absorbing lingering market supply.
Observing the visual data from the daily chart , the price holding firmly above the dynamic MA100 baseline confluent with a steep higher-low structure provides a solid launchpad for the bulls. Buying demand continues to step in aggressively, confirming that institutional liquidity remains fully committed to driving prices toward higher targets. Long-term upside potential remains widely uninhibited for trend-following entries.
However, in the short term, the price action will soon challenge the strategic psychological resistance around the $0.50 round number level. This cluster carries potential short-term profit-taking pressure. For traders holding trend-following Long positions from the lower accumulation base, the optimal approach is to remain patient while trailing stop-loss orders to newly established support floors as the price nears $0.50 to guarantee capital protection.
Disclaimer: This is not financial advice, DYOR.
ONDO Price Analysis: Breakout Watch as Bulls Eye $0.46......BINANCE:ONDOUSDT Price Analysis: Breakout Watch as Bulls Eye $0.46 Resistance
Snapshot
Open: $0.4039 | High: $0.4170 | Low: $0.3996 | Close: $0.4165
Change: +$0.0127 (+3.15%) on the day
EMAs (20/50/100/200): $0.3788 / $0.3596 / $0.3493 / $0.3783
RSI (14): 64.00, trending above its signal line at 61.17
The Setup
ONDO has spent the past several months building a base after a sharp decline from above $0.46 earlier in the year. From February through April, price consolidated in a wide accumulation range roughly between $0.22 and $0.30, grinding sideways while momentum reset. That base gave way to a strong breakout in early May, which pushed the token back above $0.40 and into a new, higher trading range through the summer.
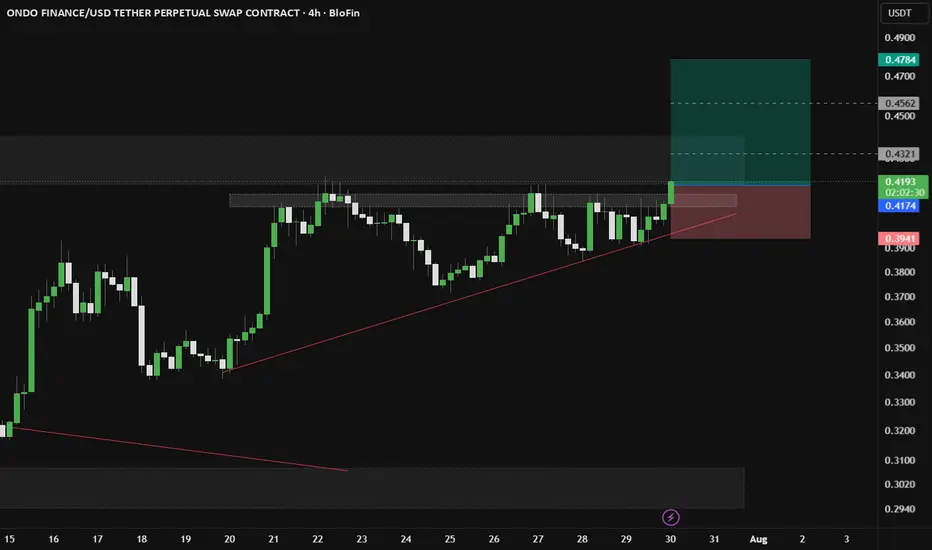
Since May, ONDO has been capped by a descending trendline connecting lower highs — the same trendline that has rejected every recovery attempt for months. That's changed this week: the July 30 candle shows price closing decisively above that trendline, with the token also holding above all four major EMAs (20, 50, 100, and 200-day), a sign that short, medium, and long-term momentum are now aligned bullish.
Key Levels to Watch
Immediate resistance: $0.44–$0.4877 — a well-defined supply zone where multiple prior rallies stalled out. This is the level that needs to break and hold on a daily close for the next leg to extend.
Upside targets on a breakout: A confirmed move through resistance opens the door toward $0.50 first, with $0.58–$0.60 as the next major target if buying pressure continues.
Support/invalidation: The former descending trendline, now acting as breakout support near $0.38–$0.40, is the level bulls need to defend. A daily close back below this zone would weaken the near-term bullish structure and risk a retest of the EMA cluster around $0.35–$0.38.
Momentum Check
RSI at 64 — comfortably above the neutral 50 line but still shy of overbought territory (typically 70+) — suggests there's room left for the rally to run before momentum becomes stretched. The RSI sitting above its own signal line reinforces the idea that buying pressure is building rather than fading.
What Could Play Out
The chart's projected path (as marked) shows a plausible pullback-and-continuation pattern: an initial push toward the $0.48–$0.52 area, a shallow retracement back toward the breakout zone to retest it as support, followed by a resumption of the uptrend toward $0.58–$0.60 if that retest holds.
Bull case: Sustained close above $0.46 → momentum buying → $0.50 → $0.58 target zone.
Bear case: Rejection at resistance and a close back below $0.38–$0.40 → risk of slipping back toward the EMA cluster and prior range.
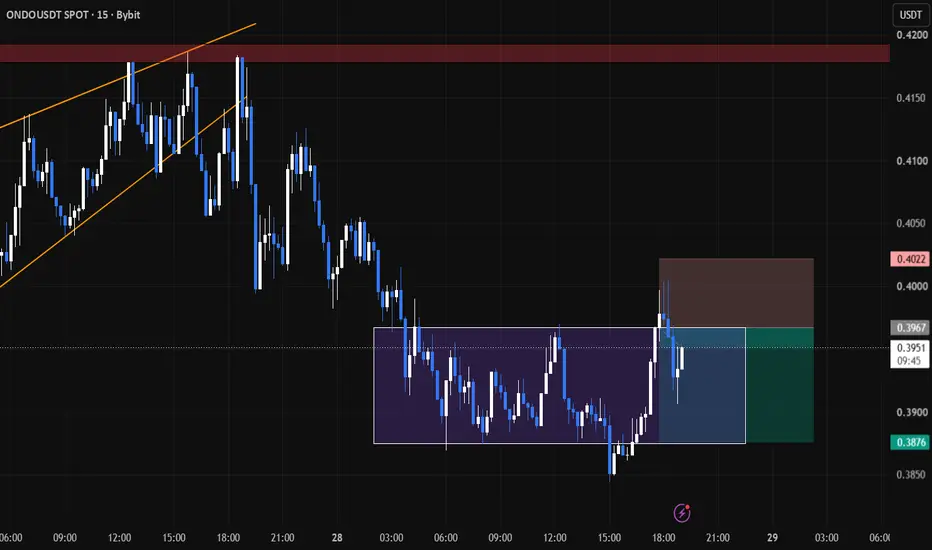
Ondo - 30-7-2026 1H EW analysisONDO remains bearish on the 1-hour timeframe, with price currently developing a corrective wave structure after the previous impulsive decline. The current advance appears corrective rather than the start of a new bullish impulse, suggesting sellers still have the higher probability.
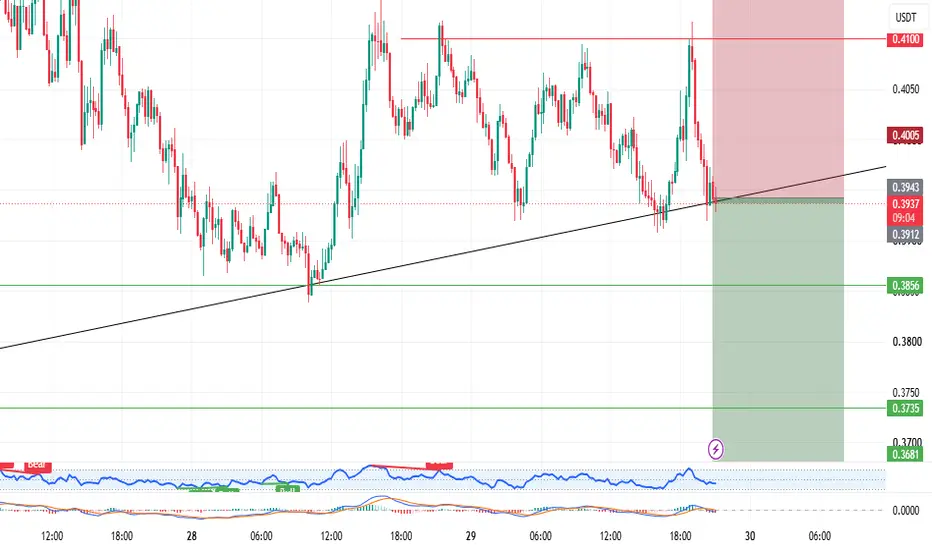
ONDO USDT SHORT SIGNAL#.3 ONDO/USDT – Trade Setup (SHORT)
📈 Position Type: SHORT
🕒 Timeframe: 1H
📊 Market: Futures
💰 Entry Zone:
0.3880
🛑 Stop-Loss:
0.40
🎯 Take-Profit Targets:
• TP1: 0.3815
• TP2: 0.3743
• TP3: 0.3638
• TP4. 3480
Tp5.
⚙️ Leverage:
5 *10
▫️ After TP1, move SL to Entry + 0.2%.
▪️ Exit Plan:
• 40% at TP1
• 20% at TP2
• 20% at TP3
20% at TP4
📌 Risk Management:
Risk only 1–2% of your capital per trade.
⚠️ Always check and confirm the setup on your chart before entering the trade.
ONDOUSDT | Daily Reversal, 4H Compression Into Supply
⚛️ ONDO has put in a strong reversal from the July lows, reclaimed its key EMA structure, and is now holding above the 10/20/50 on the Daily. The trend quality has improved substantially, but price is now pressing into a clear descending supply zone, so this is the decision point.
On the 4H, price has been building a higher base above the 10/20/50 cluster after the initial expansion. That is constructive. The setup becomes actionable only if ONDO can break through the descending resistance and show acceptance above it.
🟢 Continuation Scenario
A clean 4H close and hold above the 0.411 to 0.414 supply area would put the recent local high near 0.4255 in play. Clearing that level with participation would confirm the next leg of the Daily reversal.
The ideal look is a break, a tight retest that holds above the broken trendline, then continuation. No need to chase directly into supply.
🔴 Failure Scenario
If ONDO rejects here and loses the 4H EMA cluster around 0.3962 to 0.3946, it likely rotates back toward 0.3882. A deeper loss of that support would invalidate the clean higher-low structure and turn this back into a broader range.
This is a good example of why location matters. Daily structure is improving, but price still has to prove it can absorb overhead supply.
Location → Compression → Confirmation.
Not a signal. Just how I’m reading structure and participation.
$ONDO HOLDERS, WATCH THIS ZONE CAREFULLY LSE:ONDO HOLDERS, WATCH THIS ZONE CAREFULLY 🔥
ONDO made a strong move after breaking out from the previous range. Now price is pulling back from the $0.41–$0.42 resistance area, and this pullback could be an important moment for buyers. I’m watching the Fibonacci 0.382–0.618 zone because this area matches with the previous breakout level and a possible demand zone.
I’m not entering a long trade immediately because the market still needs to show a clear reaction. I want to see buyers stepping in, strong volume coming back, and RSI showing signs of recovery before taking any position. Good trades come from confirmation, not from guessing the bottom.
The long idea stays valid as long as ONDO can hold the $0.37–$0.35 support area. But if price loses this zone with a strong bearish move and high selling volume, the setup will be cancelled.
ONDO: Can Bulls Finally Clear $0.45?Critical resistance in focus
ONDO has rallied back towards the key $0.45 resistance zone, an area that has repeatedly rejected price since December 2025. Bulls will need a convincing break and close above this level to strengthen the recovery.
Moving averages turning bullish
The 21/8-week EMAs are on the verge of a bullish crossover, reflecting the steady improvement in trend since ONDO completed its bottoming process. A confirmed crossover would further strengthen the technical outlook.
Momentum improving
RSI has reclaimed the 50 level, suggesting momentum is beginning to favour the bulls. Meanwhile, StochRSI is turning higher and remains below overbought territory, leaving room for further upside.
Limited resistance beyond
Should ONDO reclaim $0.45, there is relatively little resistance until the previous key swing low around $0.6214. A successful breakout could therefore accelerate the recovery.
Recovery still needs confirmation
The recent rebound remains constructive, but everything hinges on the $0.45 resistance zone. Until that level is overcome, buyers still have work to do despite the improving technical picture.
In Summary
ONDO continues to recover after forming a bottom through an extended period of sideways consolidation. With the 21/8-week EMAs close to a bullish crossover, RSI back above 50 and StochRSI turning higher, momentum is gradually improving. However, the $0.45 resistance zone remains the defining level. A decisive breakout would expose the $0.6214 swing high, while another rejection would keep the recent recovery in check.
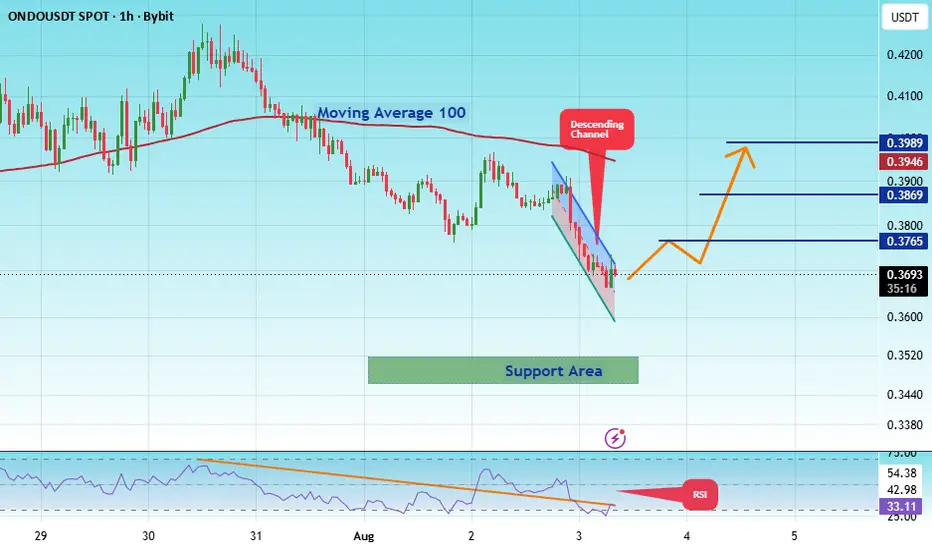
#ONDOUSDT — Descending Wedge & High R/R Zone#ONDO
The price is moving within a descending channel on the 1-hour timeframe and has reached the lower boundary. It is now poised for a bounce and is expected to retest this boundary.
The Relative Strength Index (RSI) indicates a downward trend, which is likely to continue given the overbought conditions.
There is a key support zone in green at 0.3461. The price has bounced off this zone several times, making it a strong support level.
The price is trending towards the 100-period moving average, which we are approaching. This trend supports an upward move.
Entry Price: 0.3690
Target 1: 0.3765
Target 2: 0.3869
Target 3: 0.3989
Stop Loss: At the resistance zone in green
Remember this simple rule: Money management.
Any questions? Please leave a comment.
Thank you.
ONDO LONG — 4H ALMA Setup (WR 90% · avg RR 1.9)█ SETUP
BYBIT:ONDOUSDT.P · 4H · long only.
(Context: Ondo Finance — tokenized Treasuries / RWA rails; trades with alt-beta and institutional DeFi flows.)
ALMA Averaging Strategy: ALMA 3 / σ2, SD band 2, min diff 6 bars to add / 1 bar to exit, 25% per bar, up to 4 adds, hard stop −10% from average entry.
Strategy Tester (ONDO 4H):
Win rate 90% · profit factor 9.1 · max drawdown 9%
Avg winning trade +7.1% · avg losing trade −3.7%
Typical hold ~23×4H bars on winners — RWA perp mean-reversion grid on the tighter template
═
█ WHY NOW
Fresh 4H ALMA twin longs on the 1 Aug 12:00 UTC bar ~ $0.3851 — re-arm after the mid-Jul ladder took profit into the mid-$0.33–0.37 zone.
Same Averaging family, new cycle off the post-July consolidation shelf — process refill on bar-close, not a discretionary “buy the RWA headline” call. Mark ~ $0.3849 (flat vs fill). Hard stop −10% from fill ~ $0.3466 . Exits follow Pine ALMA flip + min diff or the hard stop. Scale-in stays 25% per bar, up to 4 adds, if lower bars qualify.
═
█ MACRO
Sector: ONDO = RWA / tokenized cash & Treasuries — beta to stablecoin rails, bank-vs-yield regulation, and alt rotation when BTC risk appetite holds. Tokenized-equity collateral and tokenized-asset perps kept the “on-chain securities” tape loud into early Aug.
Tape (1–2 Aug): BTC ETF flow stress and weekend liquidity gaps capped broad alt beta; Bybit’s tokenized mega-cap collateral push and tokenized-asset research kept RWA rails in the headline mix while Bessent / CLARITY lobby noise stayed in the weekly recap. Fill is the 4H ALMA re-arm ~$0.385 — not a token unlock or product-launch forecast.
Execution is 4H ALMA Averaging at the fill close.
═
█ OUTLOOK
Positive factors
- Tester: 90% WR · PF 9.1 · avg win +7.1% vs avg loss −3.7% (avg RR 1.9) · max DD 9% — high hit-rate grid with tight loss side vs the −10% hard stop
- Fresh twin re-arm on the same 4H close after a clean mid-Jul TP cycle — process reset, not an open loser being averaged in silence
- EMA — execution TF below-stretch: 4H Below · 4H Cur S:13 vs Avg S:8.0 · +2.5% dev — time overheated under the 4H mean = mean-reversion fuel into the long template
- EMA — weekly discount: 1W Below · S stretch ~45 vs avg ~13.6 · +21.5% dev — slow-TF stretch below EMA still frames the buy-the-dip regime
- VWAP — support tagged: chart touch Support ~ $0.3816 (from 14 Jul) with spot ~ $0.385 — reaction zone under the fill, not a clean breakaway chase
- SMC — demand at fill: 4H FVG Enter Bull ~$0.3845 ( 2 Aug 08:00) · 1D FVG Enter Bull ~$0.3798 ( 1 Aug ) — bid-side inefficiency tagged into the re-arm pocket
- Long-score ~19 vs short-score ~−14 — model lean still favors the long side of the board
Negative factors
- ALMA — execution TF still SHORT: 4H Signal SHORT · S:2 vs SAvg:3.5 — below the band but young ; bounce not mature on the same clock the Averaging template armed
- ALMA — daily short-phase: 1D / 3D SHORT · 1D S:3 vs SAvg:3.3 · 3D S:2 vs SAvg:4.1 — slow grids not flipped; 4H long needs follow-through, not one-bar expansion
- EMA — daily/3D above-stretch: 1D Above · 1D Cur L:19 vs Avg L:4.7 · −3.1% · 3D Above · L stretch ~7 vs avg ~5.5 · −7.9% — time-overheated above slower EMAs = giveback / digest risk on new longs
- EMA — 1H young below: 1H Below · 1H Cur S:5 vs Avg S:11.5 · +0.7% — fast below-session not stretched; downside can still probe before a clean reclaim
- VWAP — overhead ceiling: nearest Active Resistance ~ $0.3999 (22 Jul) — ~4% runway before the first swing shelf; not an empty expansion lane
- SMC / PA — two-way tape: 4H FVG Raid Bear ~$0.3915 earlier same session · PA Bearish FVG Formed — supply housekeeping above the fill
- Twin correlated templates at one price — same beta, not diversification; first lot only (1 of 4) until lower bars qualify
- 4H fake-S ~39% on the Metric board — execution-TF noise is elevated vs cleaner large-cap grids
Takeaway: the 4H ALMA strategy and 90% WR / 1.9 avg RR support the re-arm ~$0.385 off tagged VWAP support and bull FVG demand, but young 4H/1D SHORT ALMA plus 1D/3D above-EMA time-stretch and ~$0.40 VWAP resistance cap upside — net read is a strategy-backed repair grind into overhead supply, not a clean RWA trend leg; nominal risk stays on the −10% hard stop / Pine exit path.
Base case: 4H ALMA holds · digest toward the ~$0.40 VWAP Resistance shelf if alt-beta stabilizes · room for qualifying adds only on lower closes the template allows.
Bear case: lose the ~$0.3816–0.385 support pocket · 4H SHORT ALMA reasserts · −10% from ~$0.3851 toward ~$0.3466 · BTC liquidity / RWA headline gap through the perp.
Chart: BYBIT:ONDOUSDT.P 4H — ALMA Averaging Strategy.
Educational idea. Live position — past backtest ≠ future results. NFA.
#ONDOUSDT — Descending Wedge & High R/R Zone#ONDO
The price is moving within a descending channel on the 1-hour timeframe and has reached the lower boundary. It is now poised for a bounce and is expected to retest this boundary.
The Relative Strength Index (RSI) indicates a downward trend, which is likely to continue given the overbought conditions.
A key support zone (in green) has been identified at 0.3700. The price has bounced off this zone several times, making it a strong support level.
The price is trending towards the 100-period moving average, which we are approaching. This trend supports an upward move.
Entry Price: 0.3840
Target 1: 0.3876
Target 2: 0.3911
Target 3: 0.3968
You can close at the second target or wait for the third target. The choice is yours.
Stop Loss: At the resistance zone (in green).
Remember this simple rule: Money Management.
Any questions? Please leave a comment.
Thank you.
ONDO IS FUTURE OF TOKENIZATIONONDO Is Pumping Hard Following DTCC Pilot
CRYPTOCAP:ONDO is future of Tokenization
The token has surged nearly 20% in the past 24 hours after becoming the first to launch DTCC backed tokenized stocks.
The protocol completed the first tokenized stock issuances using the DTCC tokenization service, recording digital representations of DTC-held securities, including Circle NYSE:CRCL Stock.
With over $2.5B in TVL, Ondo is building a foundation for the future of finance.
ONDO USDT SHORT SIGNAL#150. ONDO/USDT – Trade Setup (SHORT)
📈 Position Type: SHORT
🕒 Timeframe: 1H
📊 Market: Futures
💰 Entry Zone:
0.3944
0.41
🛑 Stop-Loss:
0.4202
🎯 Take-Profit Targets:
• TP1: 0.3861
• TP2: 0.3737
• TP3: 0.3596
• TP4..0.34
⚙️ Leverage:
5 *10
▫️ After TP1, move SL to Entry + 0.2%.
▪️ Exit Plan:
• 50% at TP1
• 25% at TP2
• 25% at TP3
📌 Risk Management:
Risk only 1–2% of your capital per trade.
⚠️ Always check and confirm the setup on your chart before entering the trade.
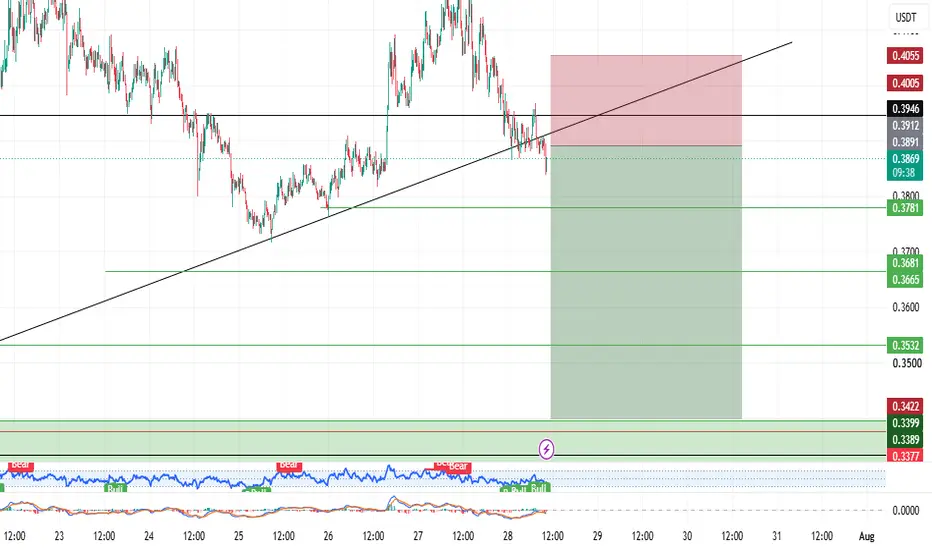
ONDO USDT SHORT SIGNAL#138. ONDO/USDT – Trade Setup (SHORT)
📈 Position Type: SHORT
🕒 Timeframe: 1H
📊 Market: Futures
💰 Entry Zone:
0.3891
🛑 Stop-Loss:
0.4055
🎯 Take-Profit Targets:
• TP1: 0.3780
• TP2: 0.3665
• TP3: 0.3532
• TP4: 0.3398
⚙️ Leverage:
5*10
▫️ After TP1, move SL to Entry + 0.2%.
▪️ Exit Plan:
• 40% at TP1
• 20% at TP2
• 20% at TP3
20%. at. TP4
📌 Risk Management:
Risk only 1–2% of your capital per trade.
⚠️ Always check and confirm the setup on your chart before entering the trade.
ONDOUSDTONDOUSDT continues to maintain a bullish market structure on the 4-hour timeframe. Despite the recent market-wide decline, the move can still be considered a healthy correction within the prevailing uptrend, as the Higher High (HH) and Higher Low (HL) structure has not been fully invalidated.
The key resistance level to watch is 0.4150, which represents the most recent swing high and a significant resistance zone. If price approaches this level with increasing buying volume, breaks above it, and manages to close beyond the resistance, it could confirm trend continuation and provide a potential long opportunity.
On the other hand, a bearish scenario should not be ignored. As shown on the chart, price has broken its ascending trendline. However, a trendline break alone is not sufficient confirmation for a short position. A higher-probability bearish setup would require a pullback to the broken trendline or the formation of a Lower High (LH) followed by a Lower Low (LL), accompanied by increasing selling volume. Such price action would provide stronger confirmation of a potential trend reversal.
As always, prioritise risk management, wait for confirmation before entering any position, and avoid anticipating breakouts.
This analysis reflects my personal opinion and should not be considered financial or investment advice.
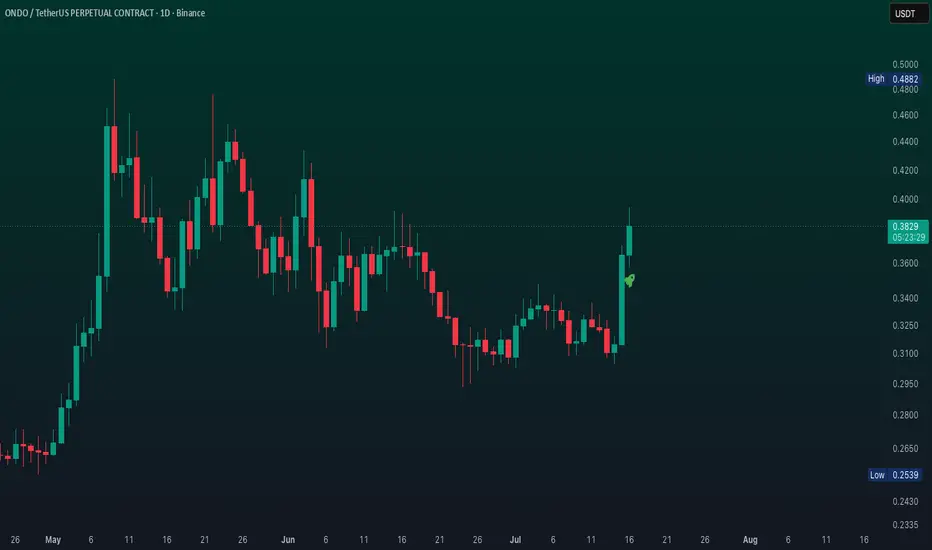
ONDO: local squeeze with $0.4882 destinationThe Macro Picture 🗺️
ONDO based through July and just snapped back to $0.3958, reclaiming ground above the $0.3541 local low with a strong impulse candle. The trend has flipped from grind to reclaim — buyers stepping in and pushing toward the range top.
The Setup ⚙️
The Range Floor 🟢
$0.3541 (Local Low) is the near demand shelf the recovery is built on, with $0.2411 (Macro Support) as the deeper base. As long as $0.3541 holds on pullbacks, the bid stays intact.
The Decision Point 🔴
$0.4708 (Local High) is the gate. A daily close above it clears the last local resistance and opens the path to the $0.4882 measured-move target at the macro ceiling.
The Roadmap 🛣️
Hold above $0.3541 → break $0.4708 → run toward $0.4882. Invalidation is a clean daily close below $0.3541 — that stalls the recovery.
This is a GRID Range Play: a defined band to rotate, buying pullbacks toward the floor and scaling out into the breakout.
More setups in profile.
#ONDO #crypto #trading #TA #3Commas #GRID