#ONEUSDT – The Final Shakeout Before Reversal?#ONE
The price is moving within a descending channel on the 1-hour timeframe and has reached the lower boundary. It is now poised for a bounce and is expected to retest this boundary.
The Relative Strength Index (RSI) indicates a downward trend, which is likely to continue due to overbought conditions.
A key support zone has been identified in green at 0.00100. The price has bounced off this zone several times, making it a strong support level.
The price is trending towards the 100-period moving average, which we are approaching. This trend supports an upward move.
Entry Price: 0.00125
First Target: 0.00132
Second Target: 0.00138
Third Target: 0.00146
You can close at the second target or wait for the third target to be reached. The choice is yours.
Stop Loss: At the resistance zone in green.
Remember this simple rule: Money Management.
Any questions? Please leave a comment.
Thank you.
In-depth trading ideas
#ONEUSDT – The Final Shakeout Before Reversal?#ONE
The price is moving within a descending channel on the 1-hour timeframe and has reached the lower boundary. It is now poised for a bounce and is expected to retest this boundary.
The Relative Strength Index (RSI) indicates a downward trend, which is likely to continue given the overbought conditions.
There is a key support zone (in green) at 0.00125. The price has bounced off this zone several times, making it a strong support level.
The price is trending towards the 100-period moving average, which we are approaching. This trend supports an upward move.
Entry Price: 0.00150
Target 1: 0.00154
Target 2: 0.00160
Target 3: 0.00170
Stop Loss: At the resistance zone (in green)
Remember this simple rule: Money management.
Any questions? Please leave a comment.
Thank you.
ONEUSDT - Bear Flag: Breakdown or Bounce? Critical Support Test!📊🔍 Technical Analysis
🪙 💵 Coin: GETTEX:ONE #ONE
⏳ Time Frame: 8H
🚩 📉 Pattern: Bear Flag
🎯 Market Bias: 🔴 Bearish Continuation
🚀 Potential Move: 10%+ (depending on breakout confirmation)
Harmony (ONE) is currently trading within a 🚩 Bear Flag, a classic bearish continuation pattern that forms after a strong downward move (📉 Flagpole), followed by a temporary upward-sloping consolidation (🏳️ Flag).
From a technical perspective, this pattern suggests that sellers remain in control, as long as the price fails to break above the upper trendline.
📍 On the chart, the price is currently testing the 🔴 lower trendline of the Bear Flag. This area represents a key dynamic support, making it a crucial level that could determine the next major price movement.
---
🐻🔴 Bearish Scenario (Probability: 75%)
⚠️ The primary outlook remains bearish while the price continues to trade within the Bear Flag structure.
✅ Key points to watch:
🔻 A confirmed breakdown below the lower trendline of the Bear Flag.
📉 The breakdown is supported by an increase in trading volume.
🎯 Once the breakdown is confirmed, the probability of further downside increases significantly.
📍 The next downside target lies around the following support zone, offering a potential decline of 10% or more from the breakdown level.
📉 As long as the market structure continues to form:
Lower High 📉
Lower Low 📉
➡️ The bearish trend remains valid.
✅ The strongest confirmation would be an 8H candle close below the channel support.
---
🐂🟢 Bullish Scenario (Probability: 25%)
A bullish scenario will only gain confirmation if:
🟢 The price successfully holds the lower trendline as support.
📈 A strong bullish rejection occurs, accompanied by increasing trading volume.
🚀 The price breaks above the upper trendline of the Bear Flag.
✅ An 8H candle closes above the channel resistance.
If this breakout is confirmed:
❌ The Bear Flag pattern becomes invalidated.
📈 The price could then continue toward the next major resistance level.
⚠️ However, until a confirmed breakout occurs, any upward movement should still be considered:
📈 A relief rally within the broader downtrend.
---
📚🚩 Pattern Explanation — Bear Flag
The Bear Flag is one of the most reliable bearish continuation patterns, typically appearing after a sharp sell-off.
The pattern consists of two main components:
📉 1. Flagpole
🔻 A strong impulsive decline that reflects aggressive selling pressure.
It represents powerful bearish momentum.
---
🏳️ 2. Flag
📈 A temporary upward-sloping consolidation channel.
This consolidation usually serves as a pause before the prevailing downtrend resumes.
---
📌 Characteristics of a Bear Flag
📉 Trading volume typically decreases during the consolidation phase.
🔻 A breakdown below the lower trendline serves as the primary signal for bearish continuation.
⏳ The longer the price fails to break above the upper trendline, the greater the probability of a bearish breakdown.
🎯 The measured target is generally projected using the height of the Flagpole, starting from the breakout point.
---
📌⚠️ Conclusion
📉 ONE is still trading within a well-defined 🚩 Bear Flag on the 8H timeframe.
📍 The price is currently sitting at the channel's critical support, making this a decisive area for the next market move.
🔻 If this support fails, the Bear Flag could be confirmed, opening the door for another significant bearish continuation.
🟢 On the other hand, if buyers successfully defend the support and the price breaks above the upper trendline, the bearish structure would become invalid, increasing the probability of a bullish reversal.
📊 For now, the technical bias remains bearish until a confirmed bullish breakout occurs.
---
⚠️💡 Reminder
🕯️ Always wait for candle confirmation before making any trading decisions.
📊 Never rely solely on chart patterns—also pay close attention to volume, market structure, and price action.
🛡️ Practice proper risk management in every trading setup.
---
#ONEUSDT #ONE #Harmony #Crypto #Cryptocurrency #Altcoin #TechnicalAnalysis #TradingView #BearFlag #Bearish #Breakdown #PriceAction #ChartPattern #Support #Resistance #Binance #CryptoTrading #SwingTrading #MarketStructure #RiskManagement
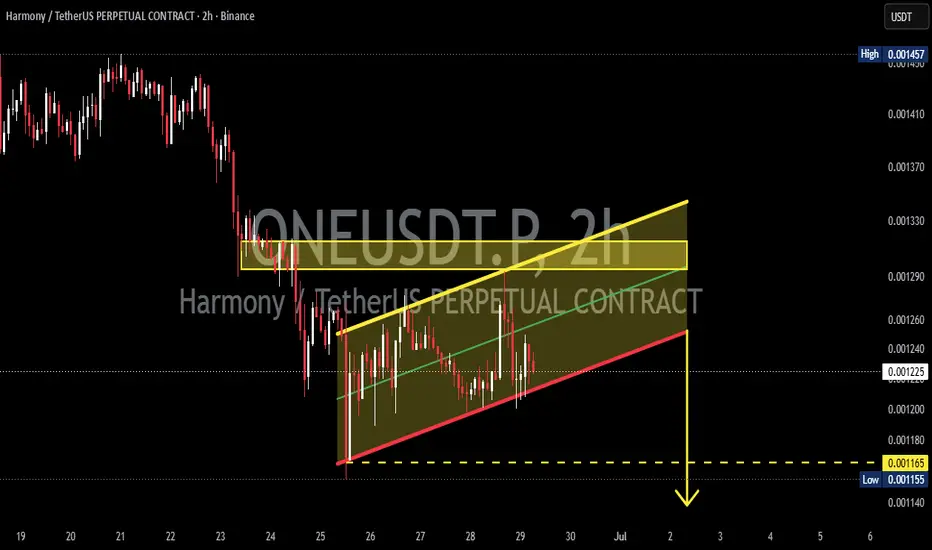
ONEUSDT - Bear Flag, Is a Major Breakdown Getting Closer?On the 2-hour timeframe, ONEUSDT is still trading within a Bear Flag structure, a classic bearish continuation pattern that forms after a sharp decline (flagpole), followed by a temporary consolidation inside an ascending channel.
At the moment, price is moving within the ascending channel (the flag), while the horizontal resistance zone (🟨 yellow box) continues to act as a strong barrier that buyers have failed to break. This suggests that buyers are attempting a recovery, but sellers remain in control as long as price stays below this resistance.
📌 Overall, the market structure continues to favor a bearish continuation unless a confirmed breakout occurs with increasing trading volume.
---
🚩📉 Bear Flag Pattern
A Bear Flag is a bearish continuation pattern consisting of two main phases:
🔻 Flagpole
- A strong and impulsive price decline driven by dominant selling pressure.
🏳️ Flag
- A temporary consolidation or gradual upward movement within an ascending channel before the primary downtrend resumes.
📍 In this chart:
✅ The flagpole has already formed clearly.
✅ Price is currently consolidating inside an ascending channel.
✅ The 🟨 horizontal resistance zone further reinforces selling pressure.
📌 As long as price remains below this resistance area, the Bear Flag pattern remains valid.
---
🟢 Bullish Scenario
A bullish confirmation would require:
✅ Price breaks above the upper trendline of the Bear Flag.
✅ The breakout also clears the horizontal resistance zone (🟨 yellow box).
✅ A strong candle closes above the breakout level with increasing trading volume. 📈
🚀 If all these conditions are met, the Bear Flag could fail (Bear Trap), opening the door for a bullish continuation toward the next resistance levels.
⚠️ However, until a confirmed breakout occurs, any upward movement should still be considered a potential relief rally.
---
🔴 Bearish Scenario
The primary outlook remains in favor of the sellers.
A stronger bearish confirmation would occur if:
✅ Price loses the ascending trendline support.
✅ A breakdown is confirmed with a candle closing below support.
✅ Selling volume increases during the breakdown. 📉
🎯 If these conditions are met, the Bear Flag pattern would be confirmed, increasing the probability of a continuation toward the next support zone, including a retest of the previous low around 0.001165, or even lower if selling pressure continues to intensify.
---
🎯 Key Levels to Watch
🟨 Resistance
🔸 Horizontal Resistance Zone (Yellow Box)
🔸 Upper Bear Flag Trendline
🟥 Support
🔹 Lower Bear Flag Trendline
🔹 Support Area around 0.001165
---
📌⚠️ Conclusion
The current ONEUSDT structure continues to display a valid Bear Flag pattern. Although price is moving inside an ascending channel, this formation is more likely to represent a temporary consolidation before a potential continuation of the broader downtrend.
📉 As long as the major resistance remains intact, the probability continues to favor the bearish continuation scenario.
💡 Traders are advised to wait for a confirmed breakout or breakdown before making trading decisions in order to avoid false signals.
«⚡ "Trade the confirmation, not the prediction."»
---
#ONEUSDT #ONE #BearFlag #Crypto #Cryptocurrency #TechnicalAnalysis #PriceAction #Altcoins #CryptoTrading #Support #Resistance #Breakdown #Breakout #ChartAnalysis #Trader #Bearish #Bullish #RiskManagement
#ONEUSDT – The Final Shakeout Before Reversal?#ONE
The price is moving within a descending channel on the 1-hour timeframe and has reached the lower boundary. It is now poised for a bounce and is expected to retest this boundary.
The Relative Strength Index (RSI) indicates a downward trend, which is likely to continue given the overbought conditions.
There is a key support zone (in green) at 0.00180. The price has bounced off this zone several times, making it a strong support level.
The price is trending towards the 100-period moving average, which we are approaching. This trend supports an upward move.
Entry Price: 0.00203
First Target: 0.00209
Second Target: 0.00217
Third Target: 0.00224
You can stop at the first and second targets and close the price, or continue towards the third target. Stop Loss: At the resistance zone (in green).
Remember this simple rule: Money Management.
Any questions? Please leave a comment.
Thank you.
#ONEUSDT – The Final Shakeout Before Reversal?#ONE
The price is moving within a descending channel on the 1-hour timeframe and has reached the lower boundary. It is now poised for a bounce and is expected to retest this boundary.
The Relative Strength Index (RSI) indicates a downward trend, which is likely to continue given the overbought conditions.
There is a key support zone in green at 0.00205. The price has bounced off this zone several times, making it a strong support level.
The price is trending towards the 100-period moving average, which we are approaching. This trend supports an upward move.
Entry Price: 0.00229
Target 1: 0.00234
Target 2: 0.00239
Target 3: 0.00246
You can stop at the first and second targets and close the price, or continue to the third target.
Stop Loss: At the resistance zone in green.
Remember this simple rule: Money Management.
Any questions? Please leave a comment.
Thank you.
Harmony (ONE): Macro Reversal Signal and the New Growth RoadmapHarmony (ONE) has just made a landmark move on the weekly chart, officially escaping the grip of the long-term descending channel that has dominated for months. This is not just a typical technical bounce; it is a decisive structural shift in 2026. Observing the current candle in chart, we see a robust bullish body, the largest in the past three months. This proves that buying pressure is dominant and institutional capital has finally entered the fray to pave the way for a new growth trajectory after a period of exhausted accumulation.
This setup offers an ideal Risk-to-Reward (RR) ratio for medium-term investors. As the price holds above the broken boundary, the old resistance has flipped into a solid "steel foundation." A strategic stop-loss is recommended below the 0.002 USD psychological level—a safety zone situated beneath the breakout point to avoid market noise. Regarding profit targets, we are aiming for the first milestone at the 100-period moving average (MA100), where minor supply pressure might occur. The long-term target is the peak of the previous channel. The alignment between price momentum and current chart structure presents a golden opportunity to catch a powerful recovery cycle as macro technical barriers are neutralized.
this is not investment advice, DYOR
Liquidity swept | Bearish wave incoming for ONE (4H)Price is in a bearish trend on higher timeframes. As we move to higher timeframes, the corrective move upward from the bottom shows weak momentum and frequent pullbacks, indicating strong selling pressure.
Recently, we have a bearish CH (Change of Character) on the chart, suggesting that strong sellers have re-entered the market and are attempting to push the price lower again.
Additionally, price has swept the liquidity pool above the chart, and there is also a liquidity pool below. Price is likely to move toward sweeping the lower liquidity.
We are looking for sell/short positions within the supply zone. Targets are marked on the chart. At the first target, move your stop loss to break-even.
A daily candle close above the invalidation level would invalidate this analysis.
If you would like us to analyze a coin or altcoin for you, first like this post, then comment the name of your altcoin below.
What is your opinion about ONE?
Harmony (ONE): Descending Channel ChallengeHarmony (ONE) has recently recorded a slight breakout above the upper boundary of the descending channel that has persisted since May 2025. However, through the lens of a professional risk manager, this movement raises significant questions regarding its sustainability. The appearance of small, fragmented bullish candle bodies is a clear indication that buying pressure remains incredibly weak—lacking the momentum required to completely neutralize the selling pressure that has dominated for over a year. In 2026, fakeout signals frequently emerge to deceive impatient investors at sensitive technical pivot points.
The crux of the matter lies in the fact that price candles are still operating just below a critical medium-term "ceiling": the 100-period Moving Average (MA100). This is the strategic hurdle that distinguishes a weak relief rally from a decisive growth cycle. Instead of risking an entry at the current sensitive position, the optimal tactic is to set a "Buy Stop" order just above the MA100 zone. Patiently waiting for the market to confirm strength at this level not only helps you filter out noise but also clears the roadmap toward the All-Time High (ATH) with an outstanding Risk-to-Reward (RR) ratio. Among professionals, patience at this stage is the ultimate key to decisive capital preservation before the macro trend officially shifts and smart money returns to the ecosystem. Maintain discipline as technical obstacles are neutralized.
this is not investment advice, DYOR
#ONE#ONE is showing a strong upward move 🚀 after successfully breaking out of a falling wedge pattern. Price is now pushing higher, with an indicated target level around 0.002490 🎯 in sight. Recognizing and trading classic chart patterns can offer clear directional signals for potential gains ✨.
#ONE #altcoin #chartpatterns #bullish
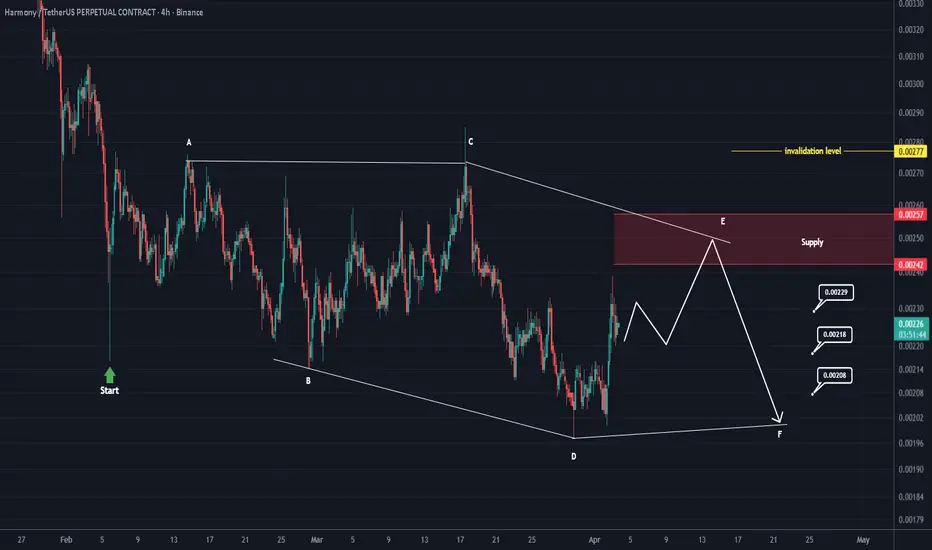
Harmony Alert: ONE Approaching Key Resistance (4H)Based on what we marked on the chart, Strat appears to have entered a corrective pattern against the bearish trend.
This corrective pattern looks like a diametric, and we are currently in wave E of this structure.
If the price reaches the red zone, we will look for sell/short positions within that red zone.
It’s recommended to enter positions using DCA within the red zone.
Targets are marked on the chart; it’s best to break even at the first target.
A daily candle closing above the invalidation level will invalidate this analysis.
If you have a symbole or altcoin you want analyzed, first hit the like button and then comment its name so I can review it for you.
What do you think? Is ONE bullish?
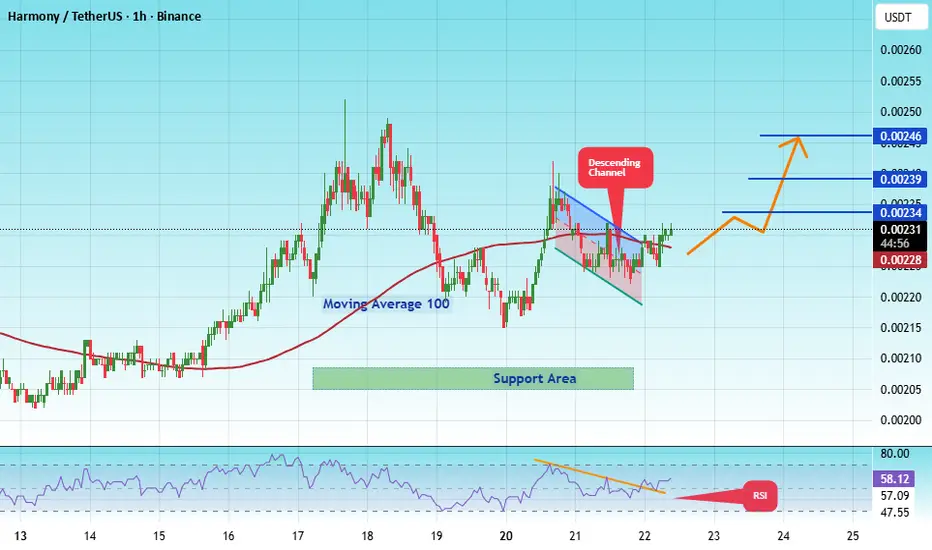
#ONE/USDT – The Final Shakeout Before Reversal?#ONE
The price is moving within a descending channel on the hourly timeframe. It has reached the lower boundary and is trending towards a bounce. A retest of this boundary is expected.
The Relative Strength Index (RSI) indicates a downward trend, and this trend is likely to continue due to the overbought condition.
A key support zone (in green) was found at 0.00211, and the price has bounced off this zone several times, making it a strong support level.
The price is trending towards the 100-period moving average, which we are approaching. This trend supports a potential upward move.
Entry Price: 0.00229
Target 1: 0.00229
Target 2: 0.00238
Target 3: 0.00247
Stop Loss: At the resistance zone (in green)
Remember this simple rule: Money management.
Any questions? Please leave a comment.
Thank you.
#NEOUSDT is back at its historical demand zone!#NEO
The price is moving within a descending channel on the 1-hour timeframe and has reached the lower boundary. It is now poised for a bounce and is expected to retest this boundary.
The Relative Strength Index (RSI) indicates a downward trend, which is likely to continue given the overbought conditions.
There is a key support zone in green at 0.00200. The price has bounced off this zone several times, making it a strong support level.
The price is trending towards the 100-period moving average, which we are approaching. This trend supports an upward move.
Entry Price: 0.00207
Target 1: 0.00212
Target 2: 0.00217
Target 3: 0.00221
You can stop at the first and second targets and close the price, or continue to the third target.
Stop Loss: At the resistance zone in green.
Remember this simple rule: Money Management.
Any questions? Please leave a comment.
Thank you.
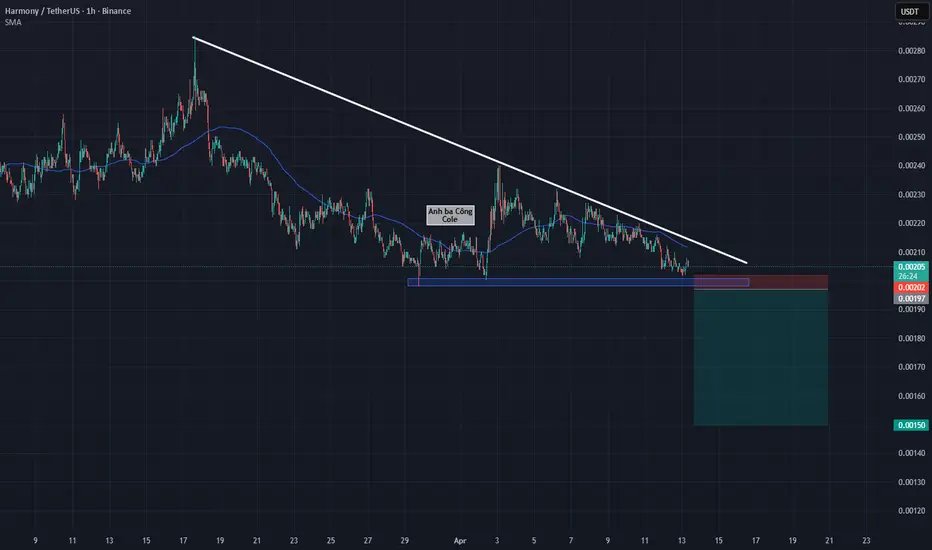
Harmony (ONE): The Descending Triangle CompressionHarmony (ONE) is entering a phase of extreme "liquidity compression" as it moves closer to the apex of its descending triangle pattern. From a strategic perspective, this is a sensitive moment that demands patience and iron discipline from investors. Observing the technical reality in 2026, it is evident that lower highs are consistently forming, proving that sellers are ramping up pressure and current buying power is insufficient to spark any significant impulsive recovery around the pivotal $0.002 support zone.
The reason for caution right now lies in the visible exhaustion of demand at this critical "floor." Rather than rushing to predict a bottom, the most professional trading strategy is to wait for a decisive market confirmation. When a price candle closes below the $0.002 boundary, it will act as the trigger for a sharp decline toward the next target at $0.0015. Establishing a Short position immediately upon the support breach offers a highly attractive Risk-to-Reward (RR) ratio. Placing a stop-loss just above the newly broken barrier—which has now flipped into a heavy psychological resistance wall—will help protect your capital optimally. Keep a cool head and wait for this technical barrier to be completely neutralized before taking action as momentum shifts.
this is not investment advice, DYOR
#ONE/USDT – The Final Shakeout Before Reversal?#ONE
The price is moving within a descending channel on the hourly timeframe. It has reached the upper boundary and is heading towards breaking it. A retest of this boundary is expected.
The Relative Strength Index (RSI) is showing an upward trend, as it has approached the upper boundary. A bearish reversal is expected.
There is a key support zone in green at 0.00250. The price has bounced from this zone several times and is expected to bounce again.
A consolidation trend is observed above the 100-period moving average, which we are approaching. This trend supports a decline towards this level.
Entry Price: 0.00263
Target 1: 0.00271
Target 2: 0.00282
Target 3: 0.00294
Stop Loss: Above the green support zone.
Remember this simple thing: Money management.
For any questions, please leave a comment.
Thank you.
#ONE/USDT – The Final Shakeout Before Reversal?#ONE
The price is moving within a descending channel on the hourly timeframe. It has reached the lower boundary and is heading towards a breakout, with a retest of the upper boundary expected.
The Relative Strength Index (RSI) is showing a downward trend, approaching the lower boundary, and an upward bounce is anticipated.
There is a key support zone in green at 0.00340. The price has bounced from this level several times and is expected to bounce again.
The RSI is showing a trend towards consolidation above the 100-period moving average, which we are approaching, supporting the upward move.
Entry Price: 0.00352
Target 1: 0.00363
Target 2: 0.00374
Target 3: 0.00386
Stop Loss: Below the green support zone.
Remember this simple thing: Money management.
For any questions, please leave a comment.
Thank you.
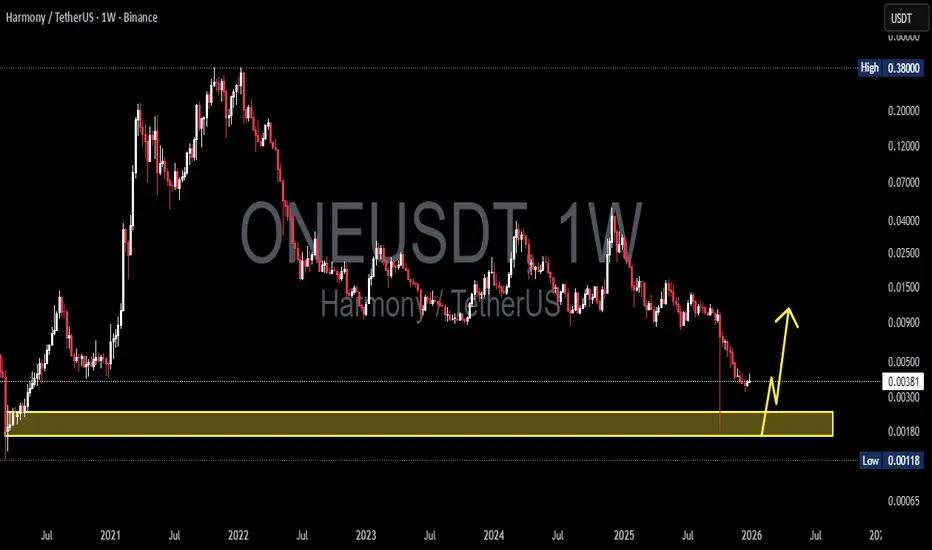
ONE/USDT at Edge: Bounce or Breakdown from Major Demand Zone?The ONE/USDT on the 1W (Weekly) timeframe shows a clear long-term bearish trend since the all-time high in 2021. Price has consistently formed lower highs and lower lows, confirming strong seller dominance over the past few years.
Currently, price is approaching a major historical demand zone, highlighted by the yellow block between 0.0024 – 0.0017, an area that previously triggered a strong bullish impulse.
---
Pattern & Price Structure
1. Long-Term Downtrend
Market structure remains bearish on a macro scale.
Every upward move has been a relief rally, failing to create a higher high.
2. Descending Structure Breakdown
Price has lost multiple minor supports, indicating progressive weakness.
Strong rejections from the mid-range supply area (around 0.01 – 0.02) accelerated the decline.
3. Major Historical Demand Zone
The 0.0024 – 0.0017 zone represents:
Previous accumulation area
Weekly historical support
Origin of a strong bullish move in the past
Price is now retesting this critical zone.
---
Key Levels
Major Resistance:
0.0050 – 0.0060
0.0090 – 0.0105
Major Support / Demand Zone:
0.0024 – 0.0017
Historical Extreme Low:
0.00118
---
Bullish Scenario
The bullish scenario is only valid if strong buying reactions appear inside the yellow zone:
Formation of:
Long lower wicks on weekly candles
Or a sideways accumulation base
No strong weekly close below 0.0017
Potential upside targets:
Short-term: 0.0050
Mid-term: 0.0090
Maximum relief rally: 0.015 – 0.02
➡️ This scenario represents a speculative bounce, not a confirmed trend reversal.
---
Bearish Scenario
The bearish scenario is confirmed if:
A strong weekly close below 0.0017
Failure of the historical demand zone
Increased selling pressure and breakdown momentum
Consequences:
Price may enter new low price discovery
No clear historical support below this level
High risk of continued downside
➡️ A breakdown here would signal market capitulation.
---
Conclusion
ONE/USDT is currently at a critical make-or-break technical level.
The 0.0024 – 0.0017 zone represents the last major weekly demand zone.
Aggressive buys are suitable only for high-risk traders
Conservative traders should wait for weekly confirmation
As long as price remains below key resistance levels, the primary trend stays bearish
---
#ONEUSDT #HarmonyONE #CryptoAnalysis #WeeklyChart #DemandZone #SupportResistance #BearishTrend #PotentialBounce #AltcoinAnalysis
FireHoseReel | ONE Compression Below 0.0037 Signals Expansion🔥 Welcome To FireHoseReel !
Let’s dive into Harmony (ONE) analysis.
⛳️ ONE Fundamental Overview
Harmony (ONE) is a layer-1 blockchain focused on fast, low-fee transactions and sharding scalability. ONE is currently ranked around #330 on CoinMarketCap and is used for fees, staking, and governance.
👀 ONE 4H Overview
ONE has been trading inside a 4H range and is now testing the top of the range and its key resistance at $0.0037. A breakout above this level could trigger a bullish leg, potentially retracing part of the previous downside move.
📊 Volume Analysis
During the recent declines, ONE showed strong selling pressure. Now, as price trades just below resistance, the move toward this level has been supported by rising buy volume, which increases the probability of a breakout.
✍️ ONE Trading Scenarios
🟢 Long Scenario:
A breakout above $0.0037, with sustained buying volume and active buyer participation, along with RSI breaking above 60.1, could provide a solid long setup.
🔴 Short Scenario:
A breakdown below $0.00347, combined with increasing sell volume, a strong rejection from the current resistance, and RSI dropping below 45.85, could activate a short trigger.
🧠 Protect your capital first. No setup is worth blowing your account. If risk isn’t controlled, profit means nothing. Trade with rules, not emotions.
#ONE/USDT – The Final Shakeout Before Reversal?#ONE
The price is moving within a descending channel on the 1-hour frame, adhering well to it, and is heading for a strong breakout and retest.
We have a bearish trend on the RSI indicator that is about to be broken and retested, which supports the upward breakout.
There is a major support area in green at 0.00652, representing a strong support point.
We are heading for consolidation above the 100 moving average.
Entry price: 0.00691
First target: 0.00706
Second target: 0.00721
Third target: 0.00739
Don't forget a simple matter: capital management.
When you reach the first target, save some money and then change your stop-loss order to an entry order.
For inquiries, please leave a comment.
Thank you.
ONE/USDT – The Final Shakeout Before Reversal?The weekly chart of ONE/USDT tells the story of a full crypto market cycle:
from the euphoric highs of 2021 to a prolonged downtrend that has now brought price back into the historical accumulation zone between 0.0055 – 0.0042 — the same area that preceded ONE’s previous bull run.
The breakdown below 0.00915 triggered a wave of panic selling and swept deep liquidity, forming a massive lower wick that pierced the yellow demand zone.
Such movements often mark the capitulation phase, where retail traders capitulate and smart money begins accumulating silently beneath the surface.
---
Structure & Technical Overview
Macro trend: Strong multi-year downtrend with consistent lower highs and lower lows since 2021.
Key demand zone: The yellow block (0.0055 – 0.0042) acts as the last major demand zone and potential base for a new market cycle.
Candle behavior: The large wick suggests a liquidity grab — a common signal that downside exhaustion may be near if confirmed by a strong weekly close above the zone.
Major resistance levels: 0.0130 → 0.01625 → 0.0200 → 0.0240 → 0.0355 — these levels could serve as potential retest or breakout targets if a trend reversal occurs.
---
Bullish Scenario
Main condition: A weekly close back above 0.00915 would signal a key reclaim and potential structural reversal.
Confirmation signals: Rising buy volume and the formation of a higher low above the yellow zone.
Upside targets:
1. 0.0130 – first technical rebound level
2. 0.01625 – 0.0200 – mid-range supply zone
3. 0.0355 – macro target if reversal sustains
Bullish narrative:
“Smart money accumulates when fear dominates. The quiet phase of accumulation might already be underway.”
---
Bearish Scenario
Bearish confirmation: A weekly close below 0.0042 would confirm a full structural breakdown.
Next target: A continuation lower toward the psychological area of 0.0023, entering a deep undervaluation phase.
Bearish narrative:
“If the yellow zone fails, ONE could enter the final leg of its downcycle — a phase only the most patient investors endure.”
---
Strategy & Opportunity
Short-term traders: Wait for a confirmed reclaim above 0.00915 before considering long entries.
Long-term investors: The 0.0055 – 0.0042 range remains a potential accumulation area — but only with disciplined risk management below support.
Core principle:
“True reversals are not born from optimism, but from despair.”
---
Conclusion
ONE stands at a critical multi-year inflection point.
The 0.0055 – 0.0042 range represents the final battleground between capitulation and rebirth.
If the zone holds and price reclaims 0.00915, a new cycle could begin.
If it breaks lower, expect deeper undervaluation before the next accumulation phase forms.
The market is testing patience — separating believers from trend followers.
---
#ONEUSDT #HarmonyONE #CryptoAnalysis #AltcoinReversal #PriceAction #CryptoCapitulation #MarketCycle #TechnicalAnalysis #CryptoMarket #SupportResistance