In-depth trading ideas
ONGUSDT – Market Brain View | H4 Bottom CycleONGUSDT – Market Brain View | H4 Bottom Cycle
Market Brain Perspective
ONGUSDT is entering a potential reaction zone after a sustained H4 decline.
The market is approaching a structural support area where a short-term bottom may form.
Cycle Structure
Distribution → Decline → Support Reaction → Potential H4 Bottom Cycle.
Trade Plan
Entry Zone: 0.073 – 0.075
Risk Control
Stop Loss: 0.067
Profit Map
Close 30% at +5%
Close 30% at +10%
Close remaining position at +30% if bullish momentum expands.
Key Idea
The goal is not to predict the market.
The goal is to act when the **Market Brain shows a reaction at structure**.
If buyers defend the support zone, ONGUSDT may begin a new H4 rebound cycle.
Rainbowsniper Logic
Find the Bottom to Buy.
Find the Peak to Sell.
Disclaimer
This analysis is for educational and informational purposes only.
Always manage risk and make your own trading decisions.
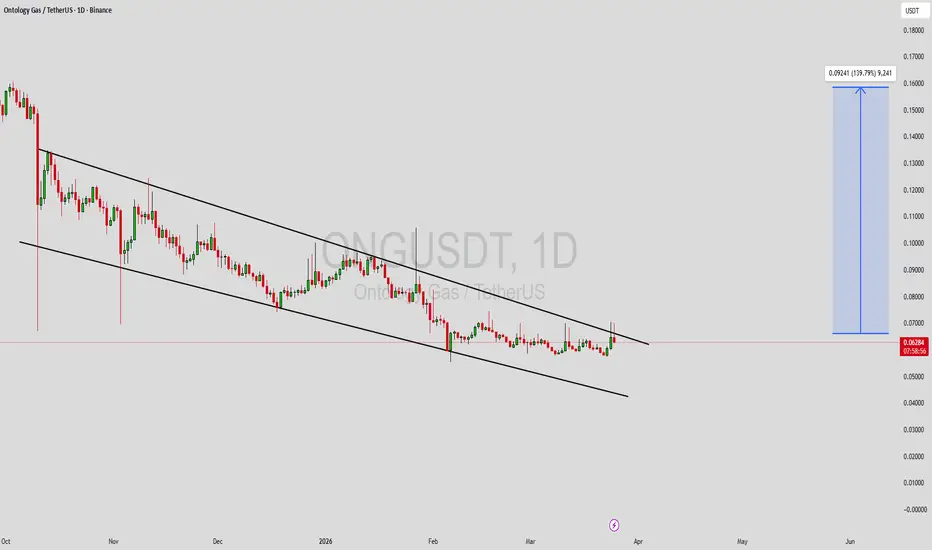
ONGUSDT Forming Falling WedgeONGUSDT is forming a clear falling wedge pattern, a classic bullish reversal signal that often indicates an upcoming breakout. The price has been consolidating within a narrowing range, suggesting that selling pressure is weakening while buyers are beginning to regain control. With consistent volume confirming accumulation at lower levels, the setup hints at a potential bullish breakout soon. The projected move could lead to an impressive gain of around 90% to 100% once the price breaks above the wedge resistance.
This falling wedge pattern is typically seen at the end of downtrends or corrective phases, and it represents a potential shift in market sentiment from bearish to bullish. Traders closely watching ONGUSDT are noting the strengthening momentum as it nears a breakout zone. The good trading volume adds confidence to this pattern, showing that market participants are positioning early in anticipation of a reversal.
Investors’ growing interest in ONGUSDT reflects rising confidence in the project’s long-term fundamentals and current technical strength. If the breakout confirms with sustained volume, this could mark the start of a fresh bullish leg. Traders might find this a valuable setup for medium-term gains, especially as the wedge pattern completes and buying momentum accelerates.
✅ Show your support by hitting the like button and
✅ Leaving a comment below! (What is your opinion about this Coin?)
Your feedback and engagement keep me inspired to share more insightful market analysis with you!
Ontology Gas ·Time Sensitive Opportunity ·685% Profits PotentialWe are tracking the down-move since December 2024, but it started even earlier. ONGUSDT.
Notice how there is a pause last year, April 2025, and notice the difference with the current pause.
In 2026, the bottom produces high-volume before and after. In 2025, there is no such signal.
Also, to spot a true bottom and reversal potential, we can access the MACD & RSI. These oscillators are likely to show long-term bullish divergence.
Let me show you an example, here is ONG's daily MACD:
Notice how the bottom happened December 2024 and it has been rising since. While ONGUSDT hit bottom February 2026, a huge difference. This is a very strong divergence and reveals an upcoming change of trend.
Also notice how the MACD is about to enter the bullish zone (when it moves above zero).
The RSI hit bottom April 2025, almost a year ago and has been rising since. The reading is now 56, bullish, and ONGUSDT is trading at bottom prices. When the RSI has a strong reading at bottom prices it reveals bullish potential.
Thus, this is a time sensitive opportunity. The bottom has been in the making for months and the reversal for years. This also reveals that the next move will be a strong one.
Easy targets on the charts.
Namaste.
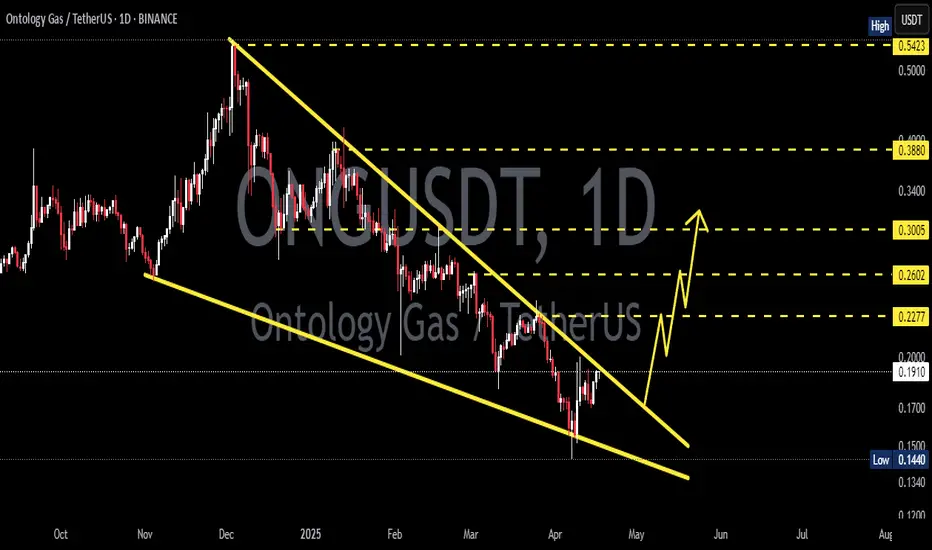
ONGUSDT Forming Falling WedgeONGUSDT is forming a clear falling wedge pattern, a classic bullish reversal signal that often indicates an upcoming breakout. The price has been consolidating within a narrowing range, suggesting that selling pressure is weakening while buyers are beginning to regain control. With consistent volume confirming accumulation at lower levels, the setup hints at a potential bullish breakout soon. The projected move could lead to an impressive gain of around 90% to 100% once the price breaks above the wedge resistance.
This falling wedge pattern is typically seen at the end of downtrends or corrective phases, and it represents a potential shift in market sentiment from bearish to bullish. Traders closely watching ONGUSDT are noting the strengthening momentum as it nears a breakout zone. The good trading volume adds confidence to this pattern, showing that market participants are positioning early in anticipation of a reversal.
Investors’ growing interest in ONGUSDT reflects rising confidence in the project’s long-term fundamentals and current technical strength. If the breakout confirms with sustained volume, this could mark the start of a fresh bullish leg. Traders might find this a valuable setup for medium-term gains, especially as the wedge pattern completes and buying momentum accelerates.
✅ Show your support by hitting the like button and
✅ Leaving a comment below! (What is your opinion about this Coin?)
Your feedback and engagement keep me inspired to share more insightful market analysis with you!
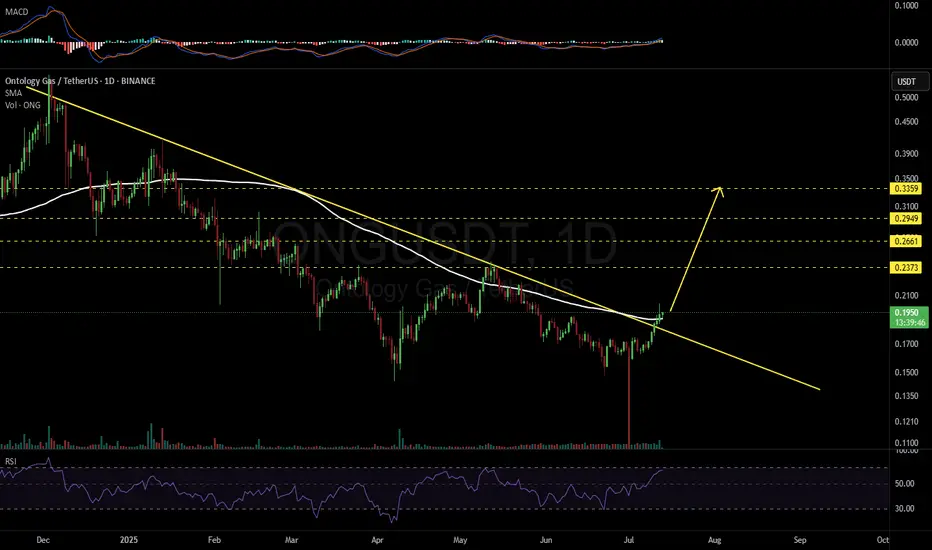
ONGUSDT 1D#ONG has broken above the descending resistance and the SMA100 on the daily chart. The price is holding well above the SMA100, indicating strength. We expect some upward movement from here.
Targets:
🎯 $0.2373
🎯 $0.2661
🎯 $0.2949
🎯 $0.3359
⚠️ As always, use a tight stop-loss and apply proper risk management.
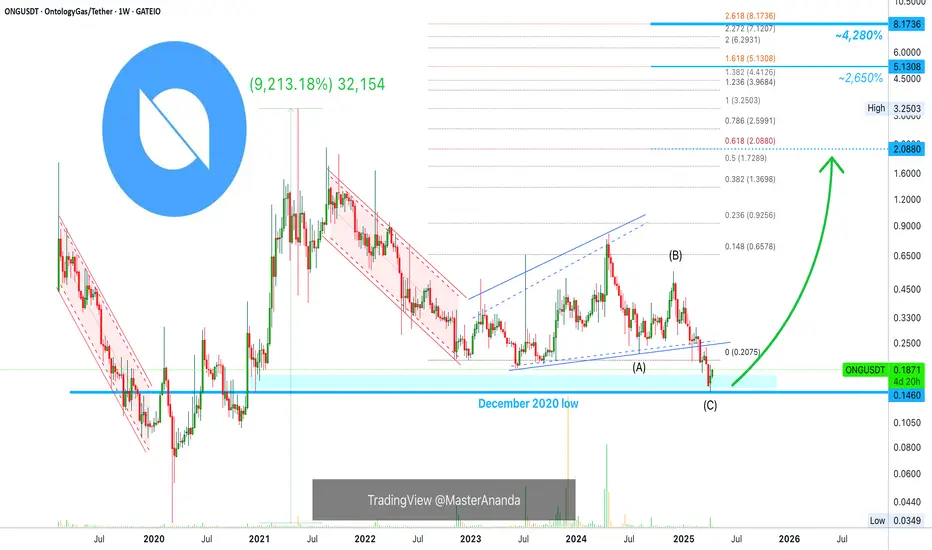
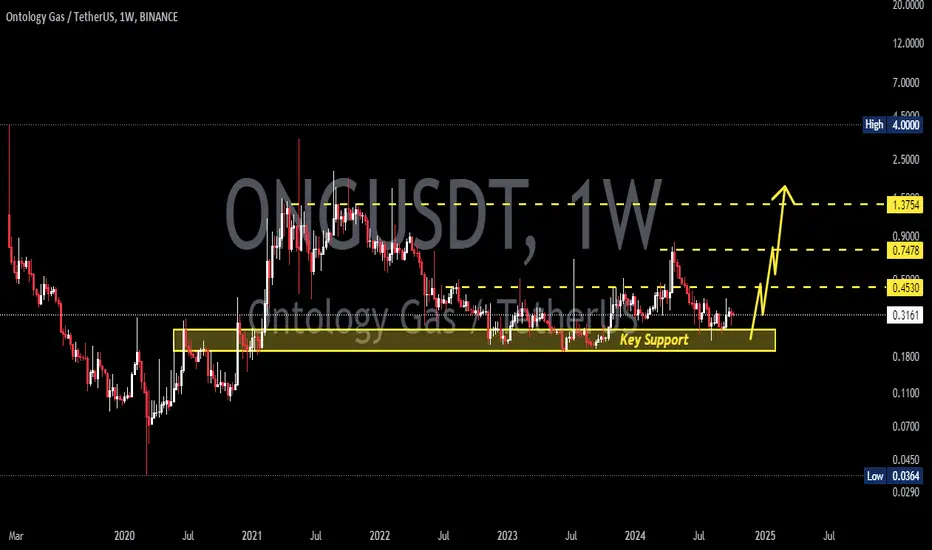
OntologyGas —Praying For A Long-Term Bull Market (4,000%+ Pot)Another interesting chart. Just a slight increase in trading volume last week but this increase is the highest volume since April 2024.
Last week, OntologyGas (ONGUSDT) activated a support level from December 2020. This same low back in December 2020 was followed by a 2,000% advance. From bottom to top, in the 2021 bull market, ONGUSDT grew an incredible 9,000%+. We have a long long-term higher low. On the medium term and normal long-term, there has been a breach of all support.
The August 2024 low and support was taken out easily and even the 2023 support zone was broken. ONGUSDT only bottomed after going as far back as December 2020 and this is good and I will explain why.
It is good news because we know the low is in. That's the only reason. Oh wait, another reason; because we can buy and hold easily and enjoy maximum growth. That's the best part.
The more than four years strong low has no bearish volume, instead, a green reversal candle and the next candle which is the current active candle is full green and going up. This means the reversal signal is in and confirmed. This means OntologyGas is set to grow.
» Once we hit bottom... Hit follow!
434 days lasted the last bullish cycle. The period we are seeing now, 2023, 2024 is nothing compared to the conditions the market was in pre-2021. The market was good to us pre-2025.
Pre-2021, the market was brutal and a major crash happened, we all know about it, before the bullish phase. Pre-2025, the market was quite friendly, sideways we a stable base and some bullish waves. Now, in 2025, we are seeing a strong correction before the major bull market run. But this correction is nothing compared to what happened before 2021. So conditions are much better now.
The market is holding better. Fundamentals are better and everything continues to improve on the side of Crypto. We can assume that the bull market will be better, growth will be better and hopefully extended but that's me trying to impose my believe on the market; anything goes.
The low for ONGUSDT is not like DGBUSDT. The low happened last week. Just a year, 365 days of growth, would put a new All-Time High in April 2026. Six months you ask? That would be November 2025.
I don't even want to think about it. I don't want to see a rush run develop in six months. I want a full flown bull market lasting 2 years or 3 years or more.
We want money and for this to be possible we need to adapt, to develop and to grow. If things move to fast, it will be another "it happened; it is over; back to boring again." No, let's hold these Cryptocurrencies long-term.
Namaste.
TradeCityPro | ONG: Daily Momentum and 4H Futures Triggers👋 Welcome to TradeCityPro!
In this analysis, I will examine the ONG coin, a key project within the Ontology ecosystem and a foundation for other projects within this ecosystem.
📅 Daily Timeframe: Loss of Momentum After a 100% Rally
In the daily timeframe, we observe an accumulation box from $0.2504 to $0.3551. After the last rebound from the $0.2504 support, the price experienced a 100% growth to the resistance at $0.5392.
🔽 After reaching this area, the market momentum completely shifted, and the price fell first to $0.3551 and is now at $0.3002. We can now say that the bullish momentum has dissipated, and for the price to increase again, it needs to build a new structure.
🔍 If further declines occur, breaking $0.3002 would be a suitable trigger. For confirmation of bullish trends, breaking $0.3551 is appropriate, but I will discuss these triggers more in the 4-hour analysis.
📊 The volume for this coin is generally low, which, as you can see, creates many shadows making futures trading challenging. Currently, the volume is also gradually decreasing.
🔼 If $0.3551 breaks and the RSI surpasses 50, the price could move higher. The targets for this move are $0.5392 and $0.7393.
📉 If $0.3002 breaks, the next supports are $0.2504 and $0.2170.
⏳4-Hour Timeframe: Futures Triggers
In the 4-hour timeframe, we can see price behavior in more detail.
✨ After the second bearish leg from $0.4071 to $0.3002 and a fake break of this support, the price formed a range box and we can also observe a descending trend line.
🔽 For a short position, if $0.3002 breaks, consider opening a short position. The target for this position is $0.2602. However, a floor above this zone at $0.3100 presents a riskier trigger, and if this area breaks, you could open an early short position. A break of 41.06 aids the entry of more bearish momentum and further market decline.
📈 For a long position, first wait for the descending trend line to break. In this case, you can use the trend break trigger or wait for a break of $0.3564. The target for this movement is $0.4071. The next trigger for a long position is a fake break of the $0.3002 support, which has already happened once and managed to keep the price above it. In case of another fake break, you could open a position with an engulfing candle or another pattern trigger.
📝 Final Thoughts
This analysis reflects our opinions and is not financial advice.
Share your thoughts in the comments, and don’t forget to share this analysis with your friends! ❤️
Breakout Imminent? ONG Bulls Challenge Key Resistance for a Big Ontology Gas (ONG) has been consolidating since July 2024, fluctuating within a range between the support zone in Green$0.2418 - $0.2512 and the resistance level at $0.3500. This prolonged period of sideways movement suggests a lack of decisive momentum from either the bulls or the bears, as the price has bounced between support and resistance within this range. The sideways action has been mostly uneventful until September when a clear shift in momentum became apparent.
Since early September, ONG has begun to show signs of a bullish trend, consistently making higher lows and higher highs. This suggests that buying interest has been increasing, and market sentiment is shifting in favor of the bulls. However, despite this uptrend, the token has faced significant resistance at the $0.3300 level. Multiple attempts to break above this resistance have been unsuccessful, with the price falling back each time it approaches or slightly breaches this zone.
Currently, ONG is trading below its 200-day Exponential Moving Average (EMA), a critical indicator for gauging long-term trend strength. The EMA 200 is sitting just above the $0.3300 resistance, which strengthens the importance of this level as a significant barrier for price progression. While the overall setup appears bullish, with a strong uptrend in place, the inability to break and hold above the $0.3300 resistance creates a key challenge for further bullish continuation.
SasanSeifi|Is a Breakout Looming? Watch the 0.35 Resistance!Hey there, ✌ In the daily timeframe, as you can see, the price has entered a consolidation phase between 0.25 and 0.35 cents after a downward trend, maintaining the 0.25 cent level for nearly five months.
Currently, the price is trading around the descending trend line at 0.31 cents. If we see demand and a breakout above the significant resistance level of 0.35 cents, and it holds, we can expect the price to rise towards the target of 0.40 to 0.42 cents. To understand the continuation of the trend, we should monitor how the price reacts at the first target.
We may observe a pullback and then a renewed rise towards the supply area of the second target at 0.47 to 0.50 cents.
The crucial support level remains at 0.25 cents. If the price does not behave as expected and breaks below 0.25 cents, the likelihood of further correction will increase.
This analysis is my personal viewpoint and not financial advice. If you found this helpful, please like and comment – I’d love to hear your thoughts! Happy trading! ✌😊
LONG #ONGUSDT 1h TF. Globally, the instrument is in an upward movement structure, more locally we observe after a strong impulse growth of several days of sideways movement, the price formed an excellent level for the continuation of longs with two smooth touches at $ 0.33190, the breakdown of which I will consider, we have a gradual compression, trading volumes have fallen noticeably, I expect to see an impulse in the breakdown of the marked level, after which consolidation prices and further growth to potential (Take Profit) at $0.38500
Strategic Buy Opportunity in Ontology Gas (ONG)Description:
Unlock the potential of Ontology Gas (ONG) with a strategic buy trade informed by essential fundamental insights. This guide equips you with key knowledge to navigate the dynamic world of cryptocurrency trading on TradingView.
Fundamentals Overview:
1. **Utility and Demand**: ONG serves as the utility token within the Ontology ecosystem, used for staking, governance, and transaction fees. As the adoption of the Ontology blockchain increases, the demand for ONG may rise, potentially driving up its value.
2. **Ecosystem Growth**: Monitor developments within the Ontology network, including partnerships, dApp launches, and integrations with other blockchain platforms. Positive growth and adoption can enhance the value proposition of ONG.
3. **Market Sentiment**: Cryptocurrency markets are highly sensitive to news and market sentiment. Keep track of broader market trends, regulatory news, and investor sentiment towards blockchain technology, which can all influence ONG's price movements.
4. **Supply Dynamics**: Understand the supply mechanisms of ONG, including its issuance rate and any potential changes in its tokenomics. A limited or decreasing supply can contribute to price appreciation if demand remains strong.
Disclaimer:
Trading cryptocurrencies, including Ontology Gas (ONG), involves substantial risk and may not be suitable for all investors. The volatile nature of cryptocurrency markets can lead to significant price fluctuations and potential losses. It is crucial to carefully consider your investment objectives, risk tolerance, and financial situation before entering the market. Past performance is not a guarantee of future results. Seek advice from a financial professional if you are uncertain about your investment strategy.
---
Use this guide to refine your trading approach for ONG, ensuring that your decisions are informed by a solid understanding of the underlying fundamentals. Stay ahead with real-time market updates and make well-considered buy trades in this innovative cryptocurrency.
Ontology — Bullish MACD Crossover, 18% Potential (Once It BreaksONG flashed a bullish MACD crossover signal on the daily chart. The signal is usually considered to be reliable on higher timeframes.
Moreover, the signal flashed at almost exactly the same price level it did a month ago. At that time, ONG rallied almost 30% before reversing.
However, currently, ONG trades below its crucial resistance of 0.30. Although the token has been trying for a couple of days, it hasn't broken through the resistance yet.
Therefore, it is essential to wait for ONG to pump above 0.30 and confirm it BEFORE entering a trade. Once broken and confirmed, the profit target is 0.36, resulting in ~18% gains.
The stop loss should be placed tightly below 0.30.
ONGUSDTHM signal v5.0 (High momentum) spotted. Looking good with previous wave up with increasing volume and momentum.
- Heathy retracement and support well at good level @ 0.3300 - 0.3500
- Trending slow and steady if able to hold above the support zone
It is at extremely good reward to risk level now if able to hold above the support level.