ONG/USDT (4h) Consolidating Inside a Large Symmetrical TriangleONG/USDT is consolidating inside a large symmetrical triangle on the 4H chart, with lower highs forming beneath descending resistance and higher lows developing along the rising support.
Price is currently around $0.0848, still trading inside the structure. A confirmed 4H breakout and hold above the upper trendline around $0.087–$0.089 could validate the bullish setup and open the way toward the $0.163 measured target area.
A breakdown below the rising support around $0.079–$0.081 would weaken t
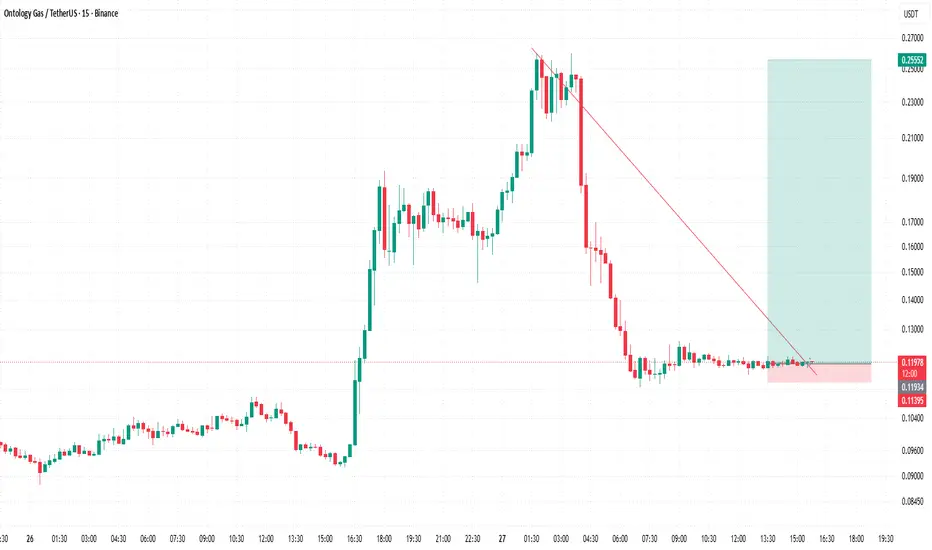
Ontology Gas / TetherUS
No trades
No trades
In-depth trading ideas
ONG/USDT (4h) Approaching a Breakout From a Symmetrical TriangleONG/USDT is consolidating inside a large symmetrical triangle on the 4H chart after the previous high-volatility move. Price continues to form lower highs beneath the descending resistance while gradually maintaining higher lows along the rising support, with the structure now becoming very tight near the apex.
Price is currently trading around $0.094, directly inside the breakout zone. A confirmed breakout above the upper trendline could trigger a bullish expansion toward the $0.134–$0.140 tar
ONG Mainnet Upgrade Triggers SurgeCBOE:ONG The Ontology MainNet completed its v3.1.2 upgrade and hard fork at block 20,800,000. The update integrated four key Ethereum opcodes (PUSH0, BASEFEE, MCOPY, and transient storage) into the Ontology EVM, aiming to reduce contract size and lower development friction for porting projects from Ethereum. Major exchanges like Binance and Upbit paused deposits and withdrawals to support the upgrade. This is bullish for ONG because core protocol improvements enhance developer appeal and long-t
ONGUSDT Forming Bullish Momentum ONGUSDT is forming a clear bullish momentum pattern, a classic bullish reversal signal that often indicates an upcoming breakout. The price has been consolidating within a narrowing range, suggesting that selling pressure is weakening while buyers are beginning to regain control. With consistent volume confirming accumulation at lower levels, the setup hints at a potential bullish breakout soon. The projected move could lead to an impressive gain of around 60% to 70% once the price breaks above
ONGUSDT 1D#ONG has broken above the descending resistance on the daily timeframe with strong volume. It is currently testing the 50-day SMA, which we expect it to break above soon as well. A confirmed breakout above the SMA50 could trigger a bullish move toward the following upside targets:
🎯 $0.04855
🎯 $0.05352
🎯 $0.05754
🎯 $0.06155
🎯 $0.06727
🎯 $0.07456
⚠️ Always use a tight stop-loss and apply proper risk management.
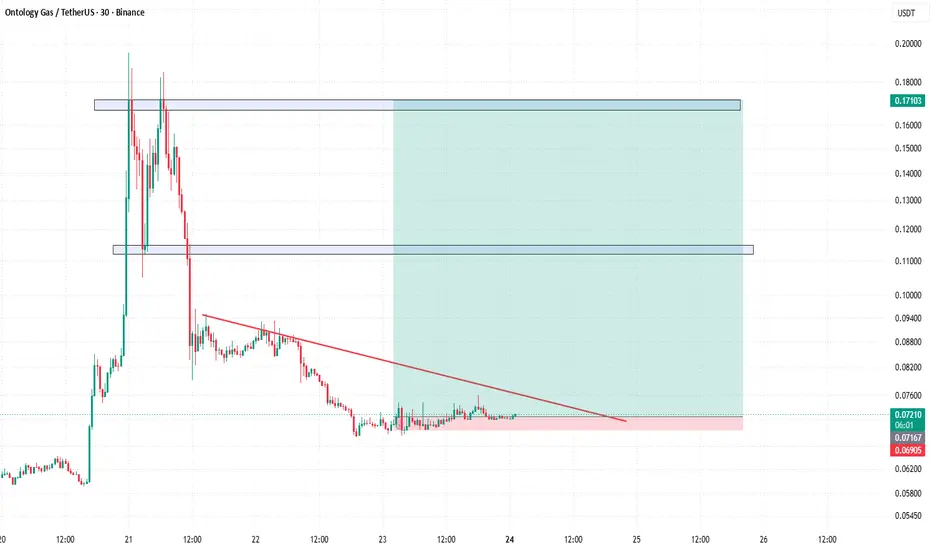
ONGUSDT – Market Brain View | H4 Bottom CycleONGUSDT – Market Brain View | H4 Bottom Cycle
Market Brain Perspective
ONGUSDT is entering a potential reaction zone after a sustained H4 decline.
The market is approaching a structural support area where a short-term bottom may form.
Cycle Structure
Distribution → Decline → Support Reaction → Potential H4 Bottom Cycle.
Trade Plan
Entry Zone: 0.073 – 0.075
Risk Control
Stop Loss: 0.067
Profit Map
Close 30% at +5%
Close 30% at +10%
Close remaining position at +30% if bullish momentum expands
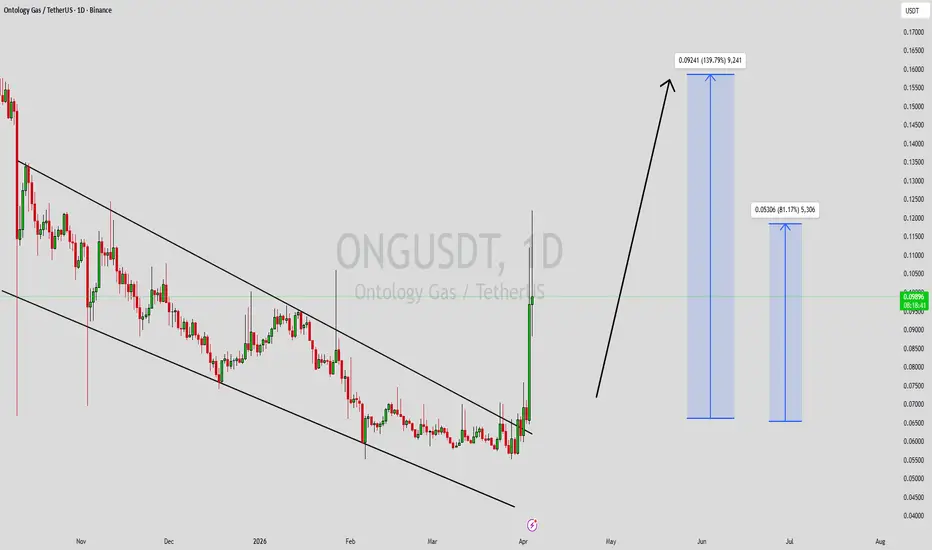
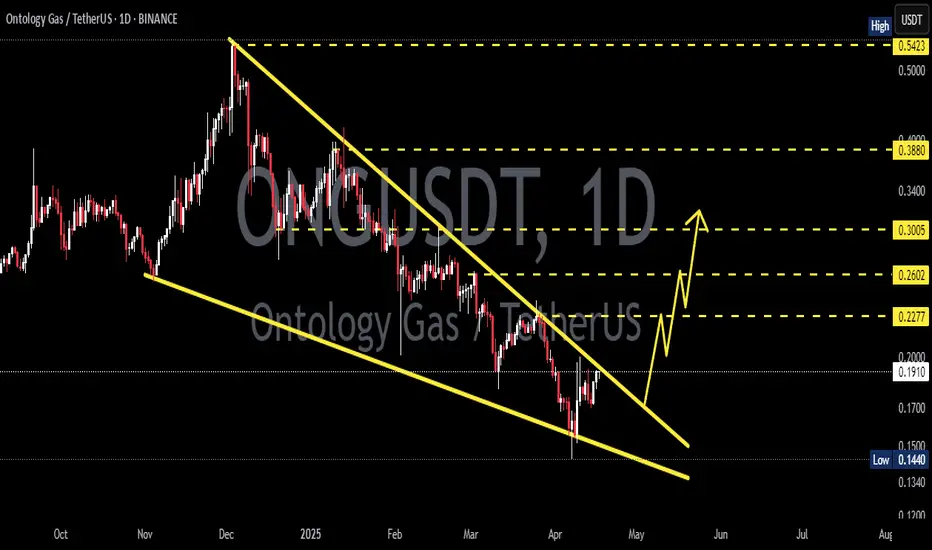
ONGUSDT Forming Falling WedgeONGUSDT is forming a clear falling wedge pattern, a classic bullish reversal signal that often indicates an upcoming breakout. The price has been consolidating within a narrowing range, suggesting that selling pressure is weakening while buyers are beginning to regain control. With consistent volume confirming accumulation at lower levels, the setup hints at a potential bullish breakout soon. The projected move could lead to an impressive gain of around 90% to 100% once the price breaks above th
Ontology Gas ·Time Sensitive Opportunity ·685% Profits PotentialWe are tracking the down-move since December 2024, but it started even earlier. ONGUSDT.
Notice how there is a pause last year, April 2025, and notice the difference with the current pause.
In 2026, the bottom produces high-volume before and after. In 2025, there is no such signal.
Also, to spot a true bottom and reversal potential, we can access the MACD & RSI. These oscillators are likely to show long-term bullish divergence.
Let me show you an example, here is ONG's daily MACD:
Notice h
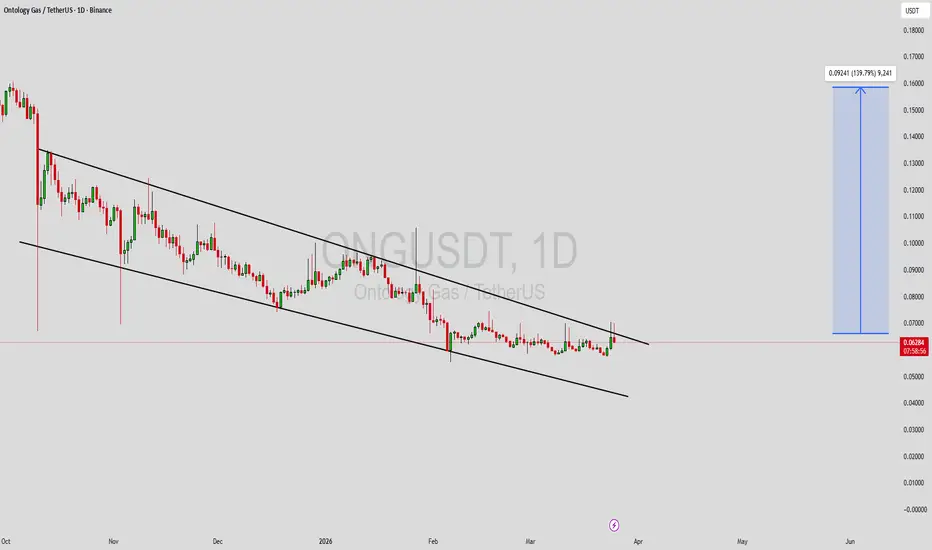
ONGUSDT Forming Falling WedgeONGUSDT is forming a clear falling wedge pattern, a classic bullish reversal signal that often indicates an upcoming breakout. The price has been consolidating within a narrowing range, suggesting that selling pressure is weakening while buyers are beginning to regain control. With consistent volume confirming accumulation at lower levels, the setup hints at a potential bullish breakout soon. The projected move could lead to an impressive gain of around 90% to 100% once the price breaks above th
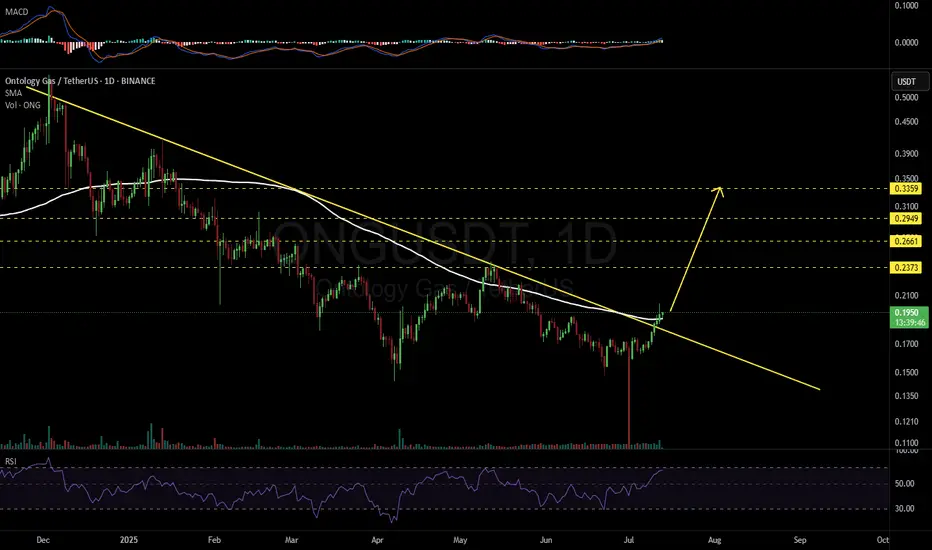
ONGUSDT 1D#ONG has broken above the descending resistance and the SMA100 on the daily chart. The price is holding well above the SMA100, indicating strength. We expect some upward movement from here.
Targets:
🎯 $0.2373
🎯 $0.2661
🎯 $0.2949
🎯 $0.3359
⚠️ As always, use a tight stop-loss and apply proper risk management.
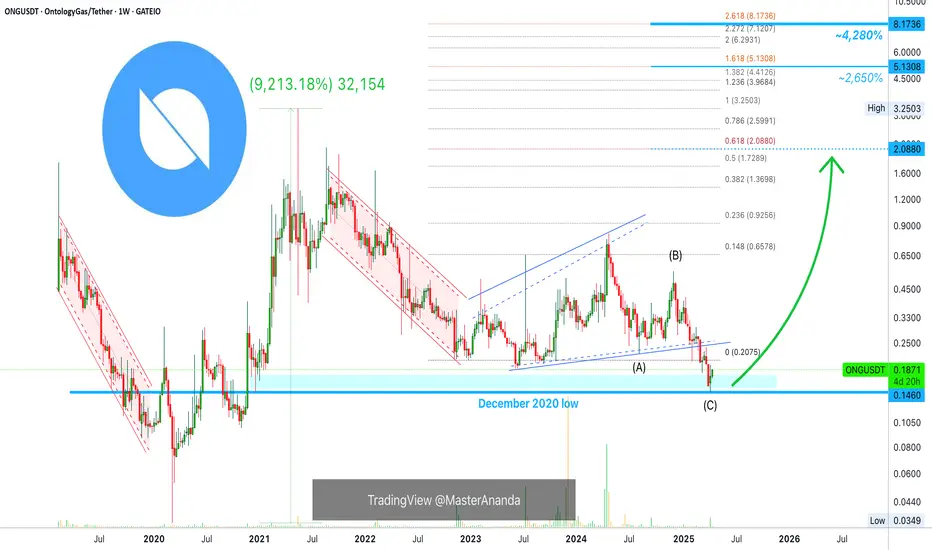
OntologyGas —Praying For A Long-Term Bull Market (4,000%+ Pot)Another interesting chart. Just a slight increase in trading volume last week but this increase is the highest volume since April 2024.
Last week, OntologyGas (ONGUSDT) activated a support level from December 2020. This same low back in December 2020 was followed by a 2,000% advance. From bottom to top, in the 2021 bull market, ONGUSDT grew an incredible 9,000%+. We have a long long-term higher low. On the medium term and normal long-term, there has been a breach of all support.
The August 20
TradeCityPro | ONG: Daily Momentum and 4H Futures Triggers👋 Welcome to TradeCityPro!
In this analysis, I will examine the ONG coin, a key project within the Ontology ecosystem and a foundation for other projects within this ecosystem.
📅 Daily Timeframe: Loss of Momentum After a 100% Rally
In the daily timeframe, we observe an accumulation box from $0.2504 to $0.3551. After the last rebound from the $0.2504 support, the price experienced a 100% growth to the resistance at $0.5392.
🔽 After reaching this area, the market momentum completely shifted, an
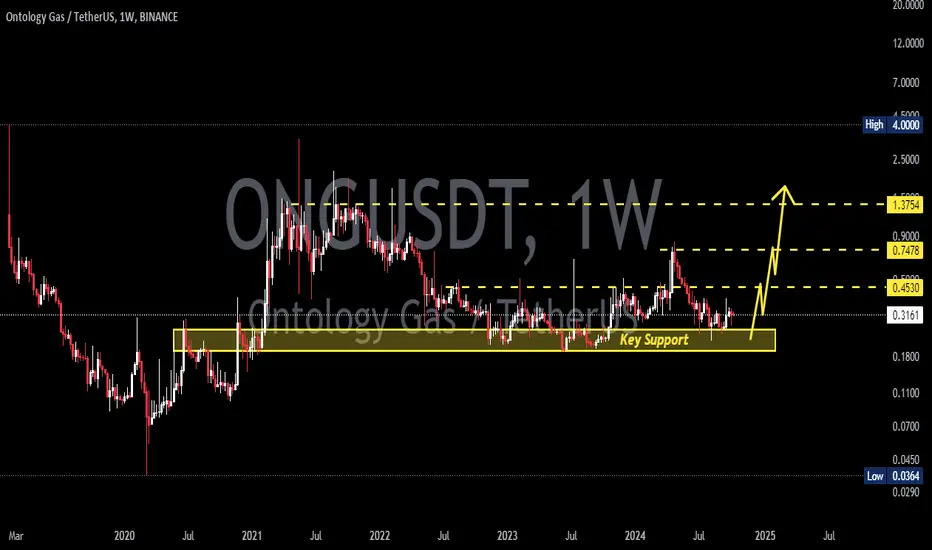
Breakout Imminent? ONG Bulls Challenge Key Resistance for a Big Ontology Gas (ONG) has been consolidating since July 2024, fluctuating within a range between the support zone in Green$0.2418 - $0.2512 and the resistance level at $0.3500. This prolonged period of sideways movement suggests a lack of decisive momentum from either the bulls or the bears, as the price has bounced between support and resistance within this range. The sideways action has been mostly uneventful until September when a clear shift in momentum became apparent.
Since early September,
SasanSeifi|Is a Breakout Looming? Watch the 0.35 Resistance!Hey there, ✌ In the daily timeframe, as you can see, the price has entered a consolidation phase between 0.25 and 0.35 cents after a downward trend, maintaining the 0.25 cent level for nearly five months.
Currently, the price is trading around the descending trend line at 0.31 cents. If we see demand and a breakout above the significant resistance level of 0.35 cents, and it holds, we can expect the price to rise towards the target of 0.40 to 0.42 cents. To understand the continuation of the t