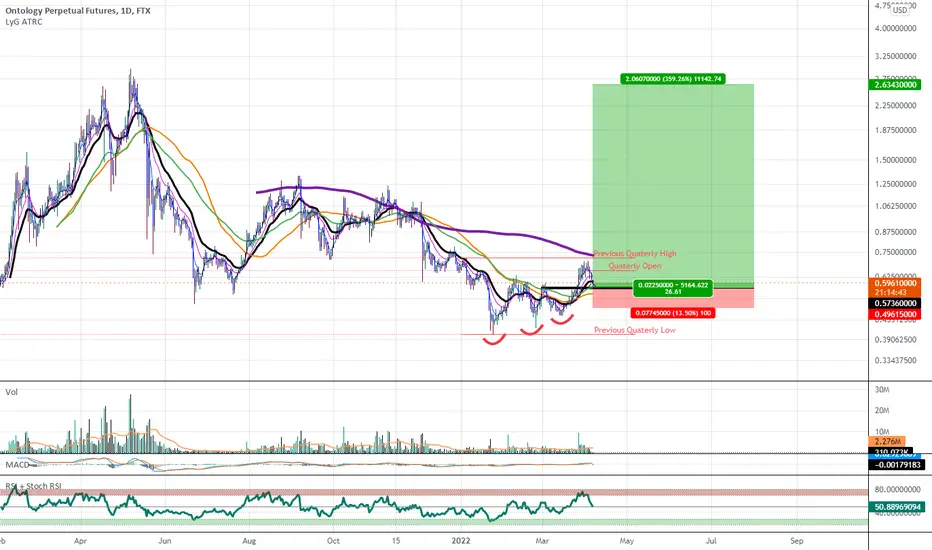
ONT | Day chart | 2026
** T.A explained **
Basics:
Ranges = two or more consecutive color candles.
There are two types of ranges - accumulation and distribution.
A single candle is a range on a lower timeframe. We only look at the first and last candle in each range.
DISTRIBUTION RANGES DEFINED: BackSide (BS) Candle - F
ONTOLOGY testing its 1W MA200 for the first time!Ontology (ONTUSD) is testing its 1W MA200 (orange trend-line) for the first time ever following a very impressive rally since the June 05 2023 market bottom. The 1W RSI was on a Higher Lows bullish divergence before the bottom, signalling the reversal to come. THe 1W MA50 (blue trend-line) has turne
ONTUSD D2: 650%+ gains THE BEST Level to BUY/HOLD (SL/TP)(NEW)Why get subbed to me on Tradingview?
-TOP author on TradingView
-2000+ ideas published
-15+ years experience in markets
-Professional chart break downs
-Supply/Demand Zones
-TD9 counts / combo review
-Key S/R levels
-No junk on my charts
-Frequent updates
-Covering FX/crypto/US stocks
-before/after
See all ideas
Summarizing what the indicators are suggesting.
Oscillators
Neutral
Oscillators
Neutral
Summary
Neutral
Summary
Neutral
Summary
Neutral
Moving Averages
Neutral
Moving Averages
Neutral
Displays a symbol's price movements over previous years to identify recurring trends.