In-depth trading ideas
ONT/USDT (1h) Compressing Inside a Symmetrical TriangleONT/USDT is consolidating inside a symmetrical triangle on the 1H chart after a strong bullish impulse. Price continues to respect the rising support trendline while forming lower highs beneath descending resistance, creating increasingly tight compression near the apex of the structure.
A confirmed breakout above the upper trendline could trigger another bullish expansion, with the previous resistance area around $0.070–$0.071 acting as the main upside target. Holding the rising support keeps
$ONT is looking interesting here. Price is sitting right aroundNYSE:ONT is looking interesting here.
Price is sitting right around the $0.06 accumulation zone + trendline. As long as we hold this area, I’m still bullish.
First upside targets: $0.07–$0.073
Then $0.11 becomes the next level to watch.
If ONT can reclaim both EMAs, the bigger move could open up — $0.53 is possible in the larger picture. 📈
#ONTUSDT Could switch sides soon. Be ready#ONT
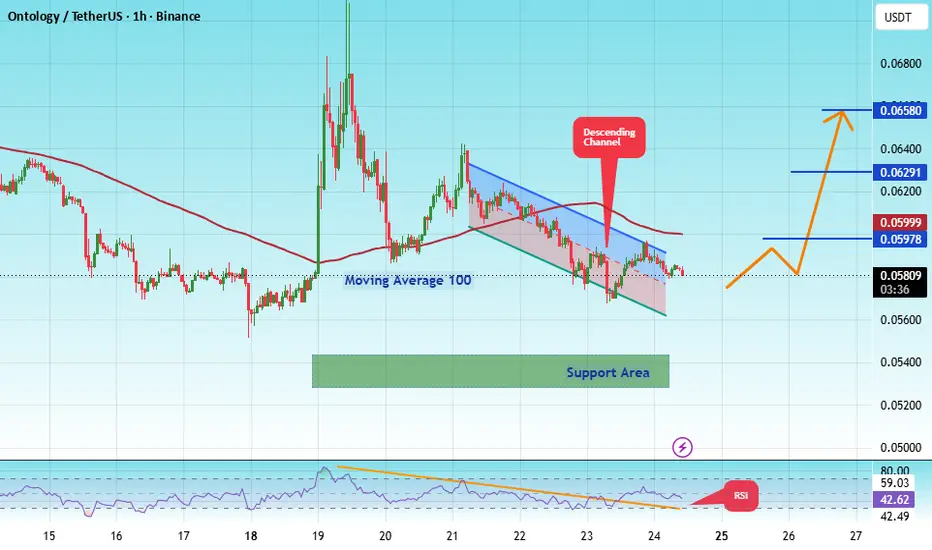
The price is moving within a descending channel on the 1-hour timeframe and has reached the lower boundary. It is now poised for a bounce and is expected to retest this boundary.
The Relative Strength Index (RSI) indicates a downward trend, which is likely to continue given the overbought conditions.
There is a key support zone in green at 0.05300. The price has bounced off this zone several times, making it a strong support level.
The price is trending towards the 100-period moving ave
#ONTUSDT Could switch sides soon. Be ready#ONT
The price is moving within a descending channel on the 1-hour timeframe and has reached the lower boundary. It is now poised for a bounce and is expected to retest this boundary.
The Relative Strength Index (RSI) indicates a downward trend, which is likely to continue given the overbought conditions.
There is a key support zone in green at 0.04580. The price has bounced off this zone several times, making it a strong support level.
The price is trending towards the 100-period moving ave
ONT at a Critical Support — Breakout or Breakdown Next?🔎 Market Structure
ONT/USDT remains in a clearly bearish structure from the previous high around $0.11–$0.12. Price continues to form Lower Highs (LH) and Lower Lows (LL), while the descending trendline acts as dynamic resistance.
Currently, price is trading around a very important area, facing the $0.0395–$0.0370 support/demand zone. ⚠️
🟨 KEY SUPPORT / DEMAND ZONE
💰 $0.0395 – $0.0370
This yellow zone is an area to watch closely because price has reacted around this region multiple times.
📌
ONTUSDT 1D#ONT has broken above the falling wedge resistance with good volume. However, it is now facing the 50-day SMA. A successful retest of the broken wedge followed by a confirmed breakout above the SMA50 could trigger a bullish move toward the following upside targets:
🎯 $0.04367
🎯 $0.04901
🎯 $0.05333
🎯 $0.05764
🎯 $0.06379
🎯 $0.07162
⚠️ Always use a tight stop-loss and apply proper risk management.
#ONTUSDT Could switch sides soon. Be ready#ONT
The price is moving within a descending channel on the 1-hour timeframe and has reached the lower boundary. It is now poised for a bounce and is expected to retest this boundary.
The Relative Strength Index (RSI) indicates a downward trend, which is likely to continue given the overbought conditions.
There is a key support zone in green at 0.03500, and the price has bounced off this zone several times, making it a strong support level.
The price is trending towards the 100-period moving
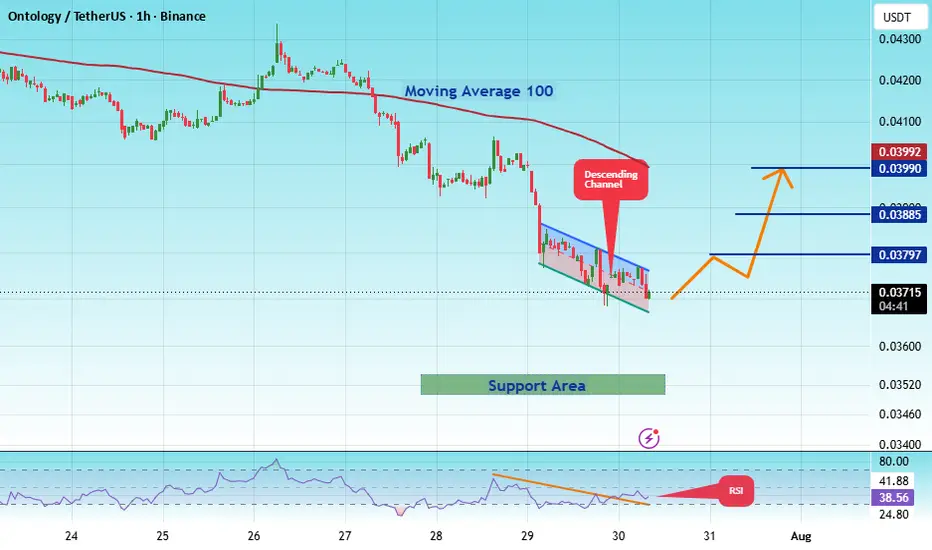
#ONTUSDT Could switch sides soon. Be ready#ONT
The price is moving within a descending channel on the 1-hour timeframe and has reached the lower boundary. It is now poised for a bounce and is expected to retest this boundary.
The Relative Strength Index (RSI) indicates a downward trend, which is likely to continue given the overbought conditions.
There is a key support zone (in green) at 0.03900. The price has bounced off this zone several times, making it a strong support level.
The price is trending towards the 100-period moving a
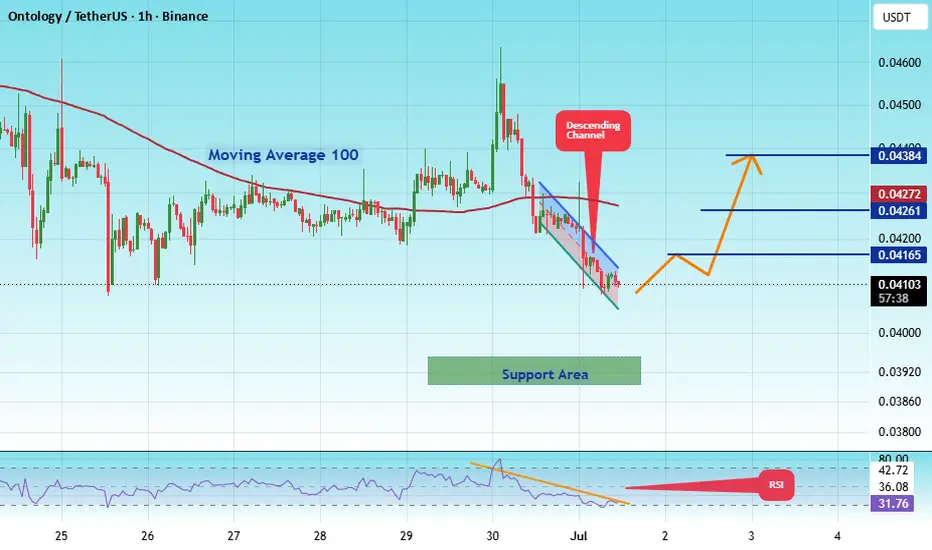
#ONTUSDT Could switch sides soon. Be ready#ONT
The price is moving within a descending channel on the 1-hour timeframe and has reached the lower boundary. It is now poised for a bounce and is expected to retest this boundary.
The Relative Strength Index (RSI) indicates a downward trend, which is likely to continue given the overbought conditions.
There is a key support zone in green at 0.03988. The price has bounced off this zone several times, making it a strong support level.
The price is trending towards the 100-period moving ave
ONT is approaching the buy zone!The bullish wave that formed the SW High showed strong momentum and significant buying pressure. It also broke a previous high, creating a BOS (Break of Structure).
The origin of such waves is important to us because a large number of buy orders are typically concentrated at their source.
Price is currently moving downward within a diagonal channel.
We have identified two entry zones where positions should be scaled in using a DCA approach.
The targets are marked on the chart.
A daily candl
ONT USDT long at bullish order block — [Quantum Algo]Identifying a bullish order block at the 0.05700–0.05860 demand zone on the 2H chart, with price retracing into the zone after a strong bullish displacement leg and forming a base for continuation. Multi-timeframe context: 2H structure shifted bullish after the impulsive break above 0.05900 resistance from 0.05650 to 0.06700, with the prior downtrend invalidated by a clear change of character. Setup posted transparently — entry, stop, and targets are defined before publication; outcome will be t
ONTUSDT Forming Falling WedgeONTUSDT is forming a clear falling wedge pattern, a classic bullish wave signal that often indicates an upcoming breakout. The price has been consolidating within a narrowing range, suggesting that selling pressure is weakening while buyers are beginning to regain control. With consistent volume confirming accumulation at lower levels, the setup hints at a potential bullish breakout soon. The projected move could lead to an impressive gain of around 90% to 100% once the price breaks above the we
ONTUSDT UPDATE
NYSE:ONT Technical Setup
Pattern: Falling Wedge Breakout
Current Price: $0.06570
Target Price: $0.09800
Target % Gain: 60.67%
Technical Analysis: ONT is showing a bullish falling wedge breakout on the 1D timeframe after a prolonged downtrend. Price has bounced strongly from the wedge support with a sharp bullish candle, indicating increasing buying momentum. A sustained move above the breakout zone could push ONT toward the $0.098 target area in the coming days.
Ontology (ONT): The Cryptocurrency market will continue growing Notice the similarities between this one and all other trading pairs. The initial crash that ends early February. The bottom process and very strong bullish breakout. The bullish breakout is coupled with really high volume helping us predict additional growth. Now we get a retrace and higher low then comes a new bullish wave.
ONTUSDT (Ontology) moved before many projects. Many projects are in this same situation but lacking the first and very strong bullish breakout. Many projects produced an i
#ONTUSDT Could switch sides soon. Be ready#ONT
The price is moving within a descending channel on the 1-hour timeframe and has reached the lower boundary. It is now poised for a bounce and is expected to retest this boundary.
The Relative Strength Index (RSI) indicates a downward trend, which is likely to continue given the overbought conditions.
There is a key support zone (in green) at 0.06600. The price has bounced off this zone several times, making it a strong support level.
The price is trending towards the 100-period moving a
#ONTUSDT Could switch sides soon. Be ready#ONT
The price is moving within a descending channel on the 1-hour timeframe and has reached the lower boundary. It is now poised for a bounce and is expected to retest this boundary.
The Relative Strength Index (RSI) indicates a downward trend, which is likely to continue given the overbought conditions.
There is a key support zone in green at 0.06920. The price has bounced off this zone several times, making it a strong support level.
The price is trending towards the 100-period moving ave
#ONTUSDT Could switch sides soon. Be ready#ONT
The price is moving within a descending channel on the hourly timeframe. It has reached the lower boundary and is trending towards a bounce. A retest of this boundary is expected.
The Relative Strength Index (RSI) indicates a downward trend, and this trend is likely to continue due to the overbought condition.
A key support zone (in green) was found at 0.07078, and the price has bounced off this zone several times, making it a strong support level.
The price is trending towards the 100-
ONT Reclaim & Retest Setup – Strong Reversal in PlayONT has printed a strong impulsive move from the lows, breaking structure and shifting momentum back to buyers.
Price is now pulling back into a key demand zone aligned with fib levels, forming a healthy retest after breakout. This zone acts as a decision area where buyers are expected to step in again.
If this demand holds, the structure favors continuation toward higher resistance levels around 0.09 and 0.13, with potential expansion toward the major supply above.
As long as the retest is r
Ontology turns bullish, together with the rest of the altcoins This is basically the same chart as QTUMUSDT. The main move is a bearish wave lasting 165 days followed by a neutral period, sideways action. The accumulation phase. The time to buy at bottom prices.
ONTUSDT is showing high volume today, a volume breakout, coupled with a strong-bullish RSI as well as a MACD that has been rising for months. All the same classic bullish signals.
This pair is still trading at bottom prices, which is great. This opens up the opportunity to buy before a major rise.
ONTUSDT — Near Short LiqsSpot volume printed 244.85M against 3.01B on the futures side, with spot dollar at 25.44M versus 312.4M futures — a 12.22x High leverage ratio trending up. Unlike the prior setups screaming at price extremes, ONT sits at 58.7% Mid range with leverage percentile at 41.1% Lower. Spot:Futures reads Confirmed, meaning both sides are participating with neither running away from the other. This is the cleanest structural backdrop of the four charts reviewed today.
Signal count reads 34 green to 21 re