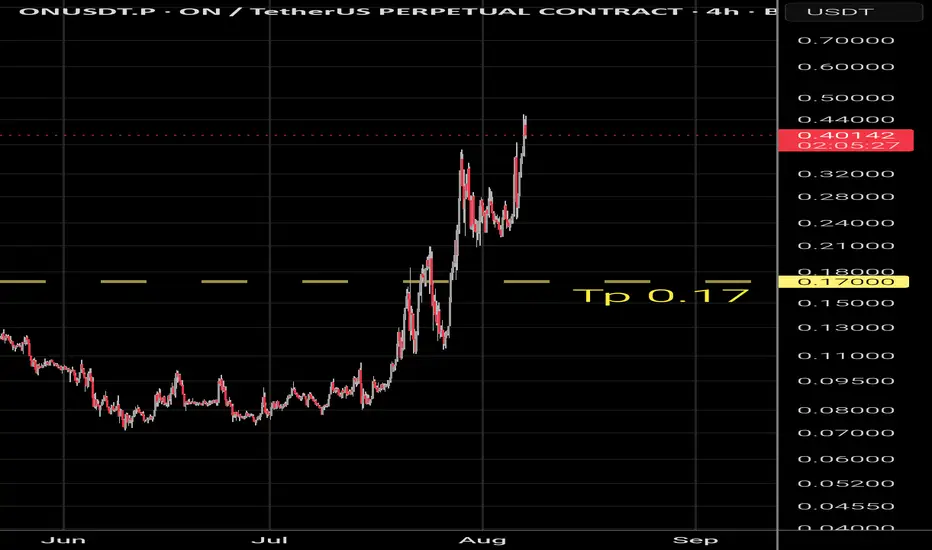
Its ONJob 18:5 — “Yea, the light of the wicked shall be put out, and the spark of his fire shall not shine.”
ON hath burned too brightly, too quickly.
From the depths it rose like a flame without measure, and now the multitude believeth the light can never be extinguished.
But every lamp hath its appointed oil, and every fire meeteth the hour of darkness.
The switch shall be turned. The flame shall weaken. And 0.17 shall receive what remaineth when ON is made OFF.
For that which was kindled in haste shall not shine forever.
Orochi Network / USDT
No trades
No trades
In-depth trading ideas
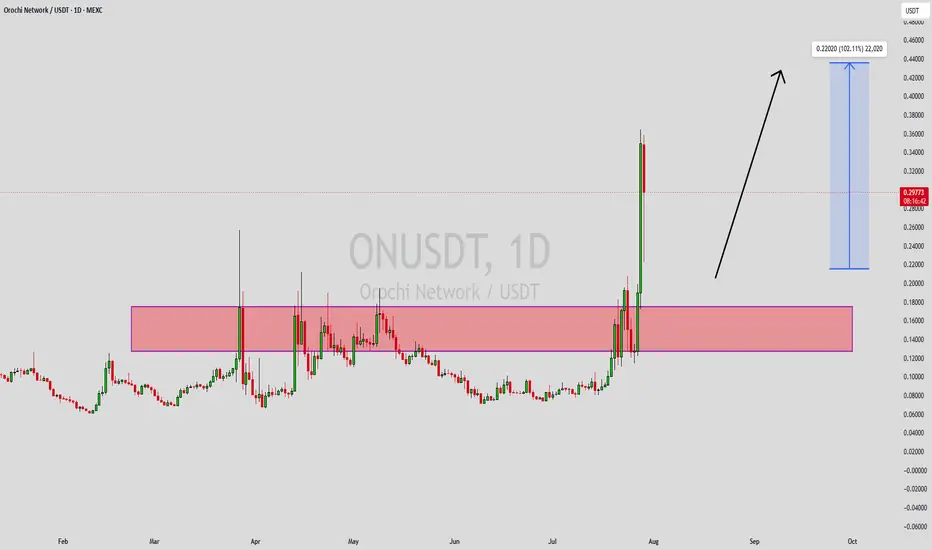
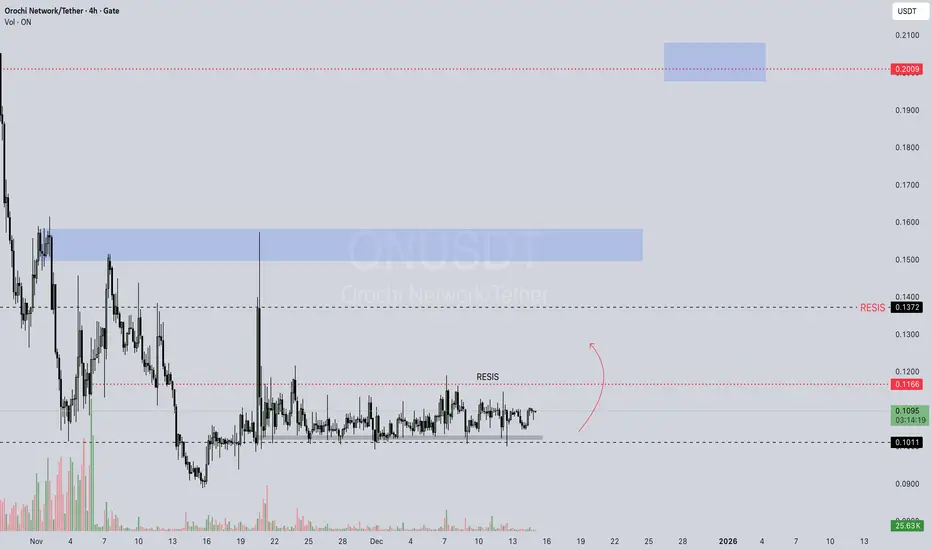
ONUSDT Forming Bullish MomentumONUSDT is forming a clear bullish momentum pattern, a classic bullish wave signal that often indicates an upcoming breakout. The price has been consolidating within a narrowing range, suggesting that selling pressure is weakening while buyers are beginning to regain control. With consistent volume confirming accumulation at lower levels, the setup hints at a potential bullish breakout soon. The projected move could lead to an impressive gain of around 90% to 100% once the price breaks above the wedge resistance.
This bullish momentum pattern is typically seen at the end of downtrends or corrective phases, and it represents a potential shift in market sentiment from bearish to bullish. Traders closely watching ONUSDT are noting the strengthening momentum as it nears a breakout zone. The healthy trading volume adds confidence to this pattern, showing that market participants are positioning early in anticipation of a reversal.
Investors' growing interest in ONUSDT reflects rising confidence in the project's long-term fundamentals and current technical strength. If the breakout confirms with sustained buying volume, this could mark the start of a fresh bullish leg. Traders might find this a valuable setup for medium-term gains, especially as the momentum pattern completes and buying pressure continues to accelerate.
✅ Show your support by hitting the like button and
✅ Leaving a comment below! (What is You opinion about this Coin)
Your feedback and engagement keep me inspired to share more insightful market analysis with you!
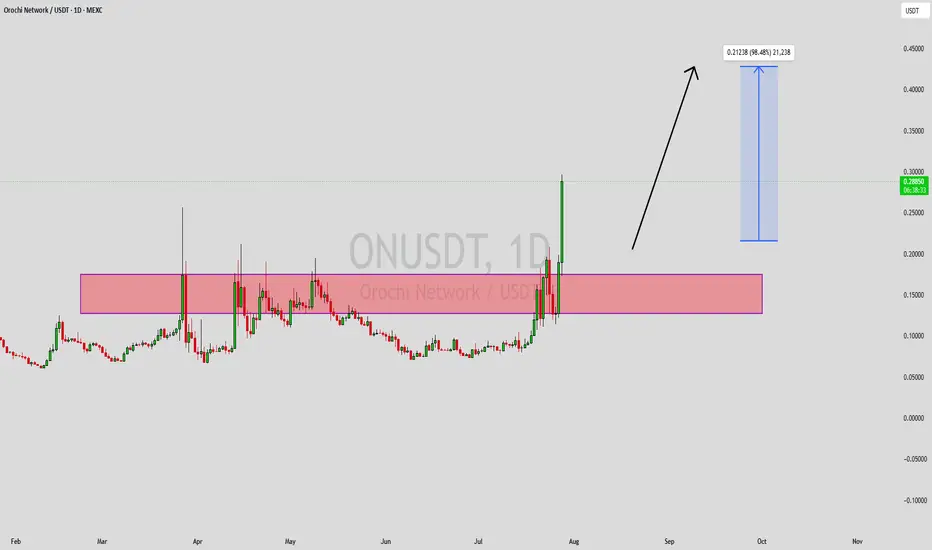
ONUSDT Forming Bullish MomentumONUSDT is forming a clear bullish momentum pattern, a classic bullish wave signal that often indicates an upcoming breakout. The price has been consolidating within a narrowing range, suggesting that selling pressure is weakening while buyers are beginning to regain control. With consistent volume confirming accumulation at lower levels, the setup hints at a potential bullish breakout soon. The projected move could lead to an impressive gain of around 90% to 100% once the price breaks above the key resistance zone. This bullish momentum pattern is typically seen at the end of downtrends or corrective phases, representing a potential shift in market sentiment from bearish to bullish.
Traders closely watching ONUSDT are noting the strengthening momentum as it approaches a critical breakout area. The healthy trading volume adds confidence to this setup, showing that market participants are positioning early in anticipation of a strong upward move. Investors' growing interest in ONUSDT reflects increasing confidence in the project's long-term fundamentals and improving technical outlook. If the breakout is confirmed with sustained buying volume, it could mark the beginning of a fresh bullish rally. Traders may find this an attractive opportunity for medium-term gains as momentum continues to build and buying pressure accelerates.
✅ Show your support by hitting the like button.
✅ Leaving a comment below! (What is You opinion about this Coin)
Your feedback and engagement keep me inspired to share more insightful market analysis with you!
ON / ONUSDT Long Setup | Breaker Block ReclaimMARKET ANALYSIS
ON is currently reacting from a key technical area highlighted on the chart.
As long as the protected support zone remains intact, the bullish market structure remains valid and higher liquidity targets may continue to attract price action.
A breakdown below the invalidation level would weaken the current bullish scenario and require a reassessment of market conditions.
📍 Entry, Stop Loss and Take Profit levels are marked directly on the chart.
━━━━━━━━━━━━━━
⚠️ DISCLAIMER
This publication is provided solely for educational and market observation purposes.
Nothing contained in this analysis should be considered financial advice, investment advice, or a recommendation to buy or sell any financial instrument.
All trading and investment decisions remain solely the responsibility of the individual trader.
Always conduct your own research and apply proper risk management before entering any position.
━━━━━━━━━━━━━━
🎯 PARALOG
▪️Crypto Market Analysis
▪️BTC Futures Signals
▪️Bitcoin & Altcoin Market Analysis
Precision • Momentum • Timing
━━━━━━━━━━━━━━
Exchange: #MEXC Futures
#bitcoin #btc #crypto #futures #technicalanalysis
ON .15i think il sit on this one guys
Orochi Network is a Verifiable Data Infrastructure designed to ensure data integrity and privacy through advanced cryptographic techniques. Orochi Network provides a secure infrastructure for processing and proving data without compromising confidentiality. This combination of cutting-edge cryptographic primitives (Zero-Knowledge Proofs, Proof Carrying Data, Fully Homomorphic Encryption) allows users to trust the system’s outputs while keeping sensitive information protected, making it a powerful solution for users requiring both transparency and privacy.
ON/USDT – Liquidity Grab Into Sell Zone Before Potential ReversaMarket Context
ON/USDT has been trading inside a broad corrective structure after an aggressive expansion. The recent downside move left multiple inefficiencies and unmitigated zones above current price, suggesting that liquidity may still be engineered to the upside before any sustained bearish continuation.
Key Levels
Sell Zone: 0.14500 – 0.16000
This area aligns with a cluster of equal highs, previous displacement origin, and unmitigated supply.
Liquidity Pools:
Buy‑side liquidity above recent swing highs
Sell‑side liquidity resting below 0.09500
Price Behavior
The current structure suggests a classic liquidity sweep → premium mitigation → displacement sequence. Price may push into the Sell Zone to collect buy‑side liquidity before a potential rejection. This aligns with typical smart‑money behavior during distribution phases.
Bearish Scenario
If ON/USDT taps into the Sell Zone and shows signs of rejection (wicks, displacement, BOS), a move back toward the 0.09500 liquidity pool becomes likely. This would complete the liquidity cycle and offer high‑probability short setups.
Bullish Invalidations
A clean break and acceptance above 0.16000 would invalidate the bearish thesis and open the door for a continuation toward higher inefficiencies.
Trading Insight
This setup is ideal for traders who focus on liquidity, SMC, and precision entries. The key is waiting for confirmation inside the Sell Zone rather than anticipating the reversal too early.
On / UsdtGATE:ONUSDT
(ON/USDT) **
🔴 **Key Resistance** marked near recent highs (price struggling to break higher).
📉 **Downtrend** visible – price making lower highs.
⚡ **Critical:** Lacks clear support levels in this snippet – risk remains high.
**⚠️ Disclaimer:**
This is **not financial advice**. Always do your own research (DYOR), confirm levels on a full chart, and manage risk. Markets change fast!
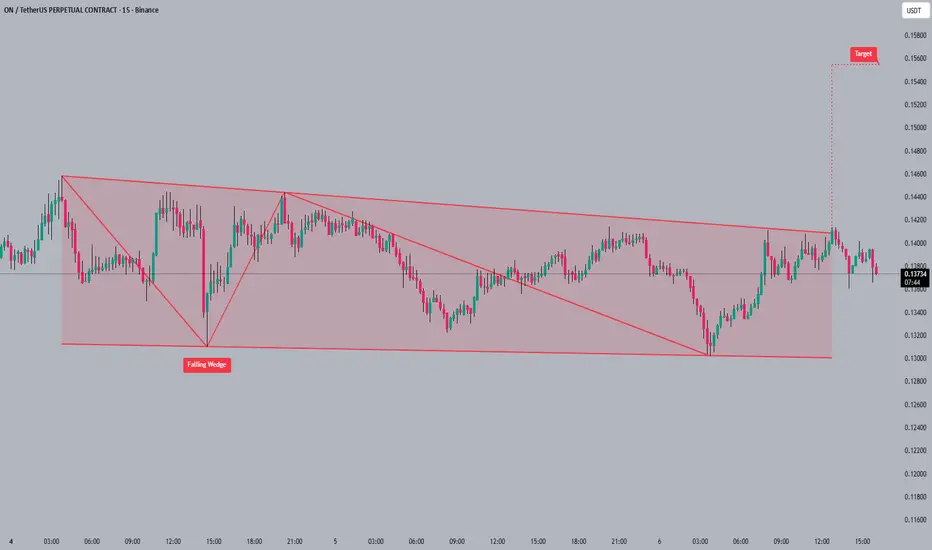
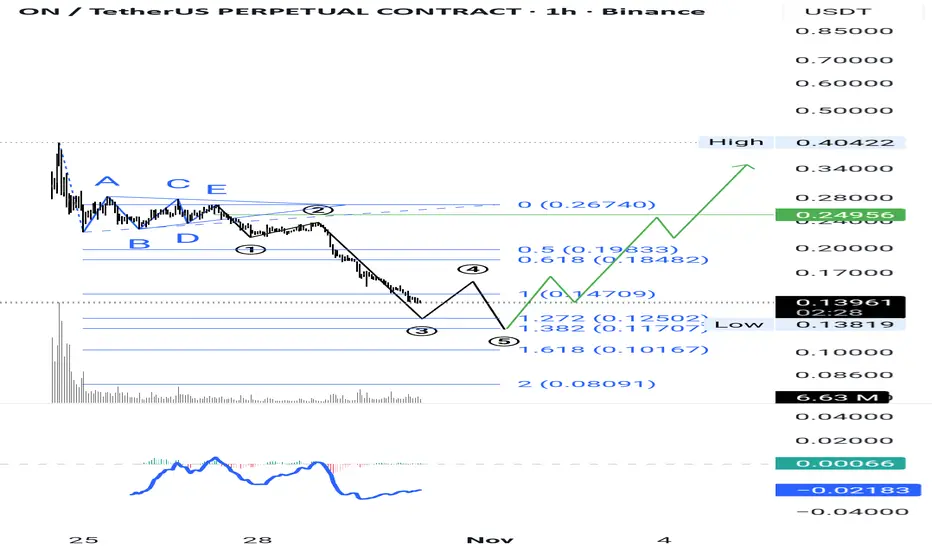
#ONUSDT.PThe currency is showing a strong downward trend. Based on initial data, we are currently in a 5-wave pattern. We have two scenarios: either we are in wave 5 of a larger structure, or we are currently in zone C of the WXYXZ correction. We are monitoring the data, and if there is a price reaction below, we will enter a buy position after a breakout of wave 4 of the current pattern.