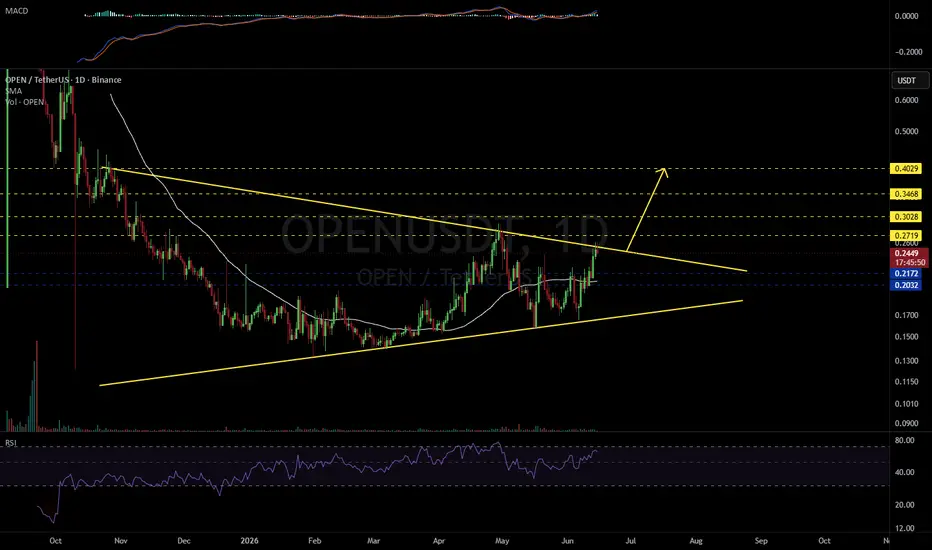
OPENUSDT 1D#OPEN is currently trading within a triangle pattern on the daily chart.
Consider accumulating a small position at current levels and near the following support zones:
📍 $0.2172
📍 $0.2032
In case of a breakout above the triangle resistance, the following upside targets could come into play:
🎯 $0
OPENUSDT Forming Bullish MomentumOPENUSDT is forming a clear bullish momentum pattern, a classic bullish wave signal that often indicates an upcoming breakout. The price has been consolidating within a narrowing range, suggesting that selling pressure is weakening while buyers are beginning to regain control. With consistent volume
OPENUSDT Forming Bullish MomentumOPENUSDT is forming a clear bullish momentum pattern, a classic bullish wave signal that often indicates an upcoming breakout. The price has been consolidating within a tightening range, suggesting that selling pressure is gradually weakening while buyers are beginning to regain control. With steady
OpenLedger (OPENUSDT): Classic Higher Low Retrace & 1,000% PPHere we have the classic retrace followed by a higher low.
OPENUSDT. It all started with the rounded bottom and consolidation period. The first move is the initial bullish breakout and after some bullish action there is always a retrace. This retrace ending in a higher low is what confirms a bullis
OPENSDT Forming Bullish MomentumOPENUSDT is forming a clear bullish momentum pattern, a classic bullish continuation signal that often points toward a strong breakout in the near future. The price has been consolidating within a tightening range, suggesting that selling pressure is gradually weakening while buyers continue to rega
OPENUSDT Forming Bullish WaveOPENUSDT is currently forming a clear bullish wave pattern, a classic structure that often signals an upcoming breakout. The price has been consolidating within a narrowing range, indicating that selling pressure is gradually weakening while buyers are beginning to regain control. With consistent vo
#OPEN/USDT Bulls are back on $OPEN#OPEN
The price is moving in a descending channel on the 1-hour timeframe. It has reached the lower boundary and is heading towards breaking above it, with a retest of the upper boundary expected.
We have a downtrend on the RSI indicator, which has reached near the lower boundary, and an upward re
OpenLedger (OPEN) can grow 1,000% mid-term —Hyper-bullishOpenLedger (OPENUSDT) has huge growth potential. The black line on the chart marks the October 2025 low. Below this line OPENUSDT produced a rounded bottom and the action is now back above it, signaling the start of a new market phase.
1,000% is only a portion of what is possible on this trading pa
OPEN/USDT — bullish structure, but resistance is closeOPEN is holding a constructive 4H structure after reclaiming the 0.1743 zone and pushing back into the upper part of the range.
At the moment, price is trading near 0.1829, which keeps the bullish idea valid, but also puts the market close to local resistance. That means the setup still favors upsi
OPENUSDT Forming Bullish MomentumOPENUSDT is forming a clear bullish momentum pattern, a classic bullish reversal signal that often indicates an upcoming breakout. The price has been consolidating within a narrowing range, suggesting that selling pressure is weakening while buyers are beginning to regain control. With consistent vo
See all ideas
Summarizing what the indicators are suggesting.
Oscillators
Neutral
SellBuy
Strong sellStrong buy
Strong sellSellNeutralBuyStrong buy
Oscillators
Neutral
SellBuy
Strong sellStrong buy
Strong sellSellNeutralBuyStrong buy
Summary
Neutral
SellBuy
Strong sellStrong buy
Strong sellSellNeutralBuyStrong buy
Summary
Neutral
SellBuy
Strong sellStrong buy
Strong sellSellNeutralBuyStrong buy
Summary
Neutral
SellBuy
Strong sellStrong buy
Strong sellSellNeutralBuyStrong buy
Moving Averages
Neutral
SellBuy
Strong sellStrong buy
Strong sellSellNeutralBuyStrong buy
Moving Averages
Neutral
SellBuy
Strong sellStrong buy
Strong sellSellNeutralBuyStrong buy
Displays a symbol's price movements over previous years to identify recurring trends.