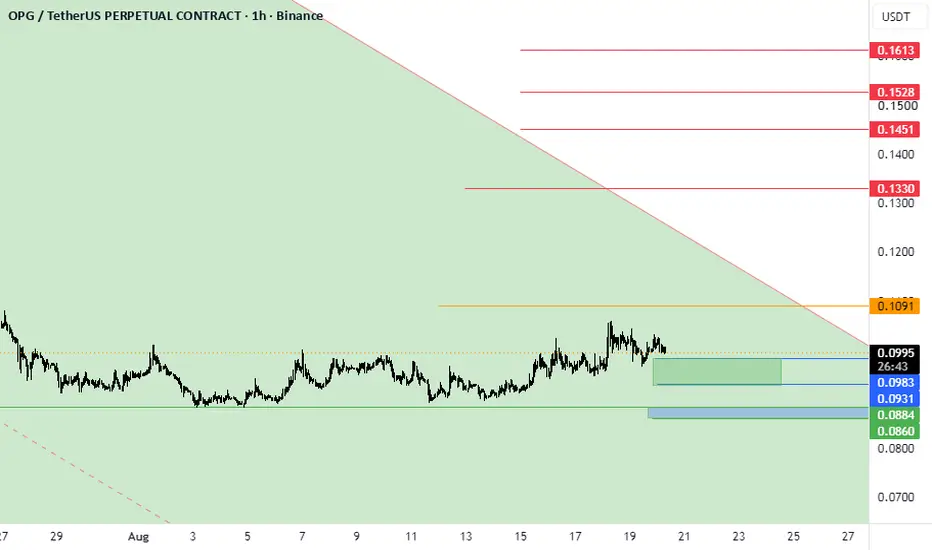
OpenGradient/USD Tether Perpetual Contract
No trades
No trades
In-depth trading ideas
The key is whether it can rise to the 0.16 and find support
Hello.
Nice to meet you, fellow traders.
If you "follow" me, you can always get new information quickly.
Have a great day.
------------------------------------
Since the chart was created recently, the role of the support and resistance points marked on the chart is weak, so caution is required when trading.
The point where you can start trading is the 0.1600 level, where the HA-Low indicator is formed.
Therefore, you should look for a buying opportunity when the price shows signs of support around the 0.1600 to 0.1756 range.
If the price rises above 0.1814, there is a possibility of a sharp upward trend, but since selling pressure could be equally strong, a quick response is required.
Once the rise begins:
1st: 0.2120
2nd: 0.2428
3rd: 0.2783
You must check for support around the 1st to 3rd levels above and consider a response strategy accordingly.
-
If you look at the 15m chart for day trading, it is as follows:
1. Since the M-Signal indicator on the 1D chart is passing near 0.1390, buying is possible when the price shows signs of support in this area.
2. If the price falls below 0.1390, you must check whether it finds support around 0.1243.
3. If the price rises, you should focus on finding a selling timing when it climbs to the HA-High ~ DOM(60) zone, specifically the 0.1665 ~ 0.1719 range.
-
Thank you for reading to the end.
I wish you a successful trade.
--------------------------------------------------
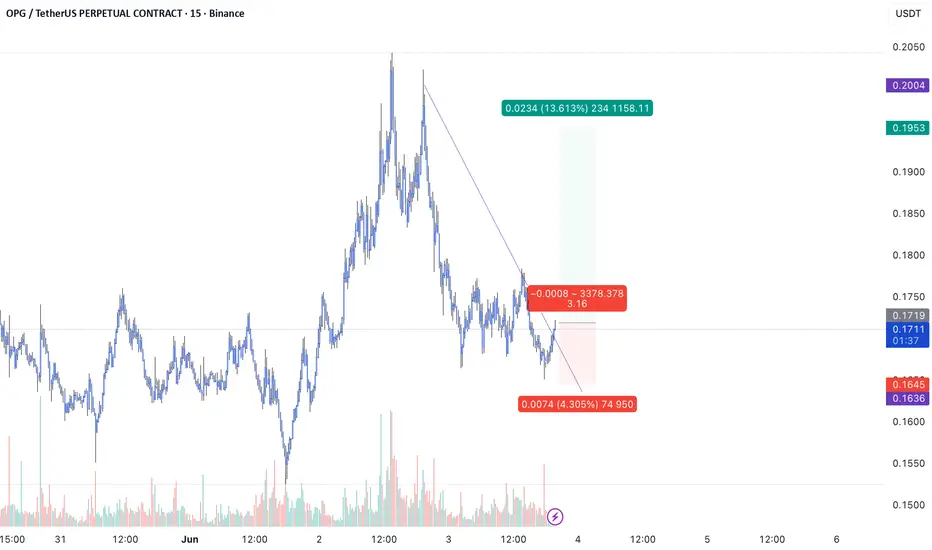
OPG -Break outHi My friends,
I've discovered a pretty interesting trading setup.
1. Breakout Above the Downtrend Line
Price had been forming lower highs along the descending trendline (purple line).
The latest move has broken above the trendline, suggesting that short-term selling pressure is weakening.
This is often an early signal of a reversal or at least a relief rally.
2. Formation of Higher Lows
The support area around 0.166–0.167 has held successfully.
Price is now beginning to form higher lows, which is one of the first signs of a potential bullish structure.
3. Volume Supports the Move
Near the recent lows, several volume spikes appeared above average levels.
This suggests that buyers may be absorbing selling pressure and stepping into the market.
4. Attractive Risk-to-Reward Ratio
Based on your setup:
Entry: ~0.1718
Stop Loss: ~0.1645
Take Profit: ~0.1953
Risk-to-Reward Ratio ≈ 3.16:1