OPUSDT: Breakout Retest Could Fuel the Next RallyOPUSDT has reclaimed a key resistance zone and is now holding above the breakout level, signaling improving bullish momentum. The recent higher lows suggest buyers remain in control.
As long as 0.09597 holds as support, the bullish setup remains valid. A continuation above the current range could drive the price toward 0.09993, while a break below support would invalidate the setup.
Trade Setup
Entry: 0.09685
Target: 0.09993
Stop Loss: 0.09597
I'll wait for sustained buying volume and a confirmed hold above the breakout zone before expecting the next move higher.
In-depth trading ideas
#OPUSDT may continue its trend after correction#OP
The price is moving within a descending channel on the 1-hour timeframe and has reached the lower boundary. It is now poised for a bounce and is expected to retest this boundary.
The Relative Strength Index (RSI) indicates a downward trend, which is likely to continue given the overbought conditions.
There is a key support zone (in green) at 0.0875. The price has bounced off this zone several times, making it a strong support level.
The price is trending towards the 100-period moving average, which we are approaching. This trend supports an upward move.
Entry Price: 0.0977
Target 1: 0.1011
Target 2: 0.1052
Target 3: 0.1100
Stop Loss: At the resistance zone (in green)
Remember this simple rule: Money management.
Any questions? Please leave a comment.
Thank you.
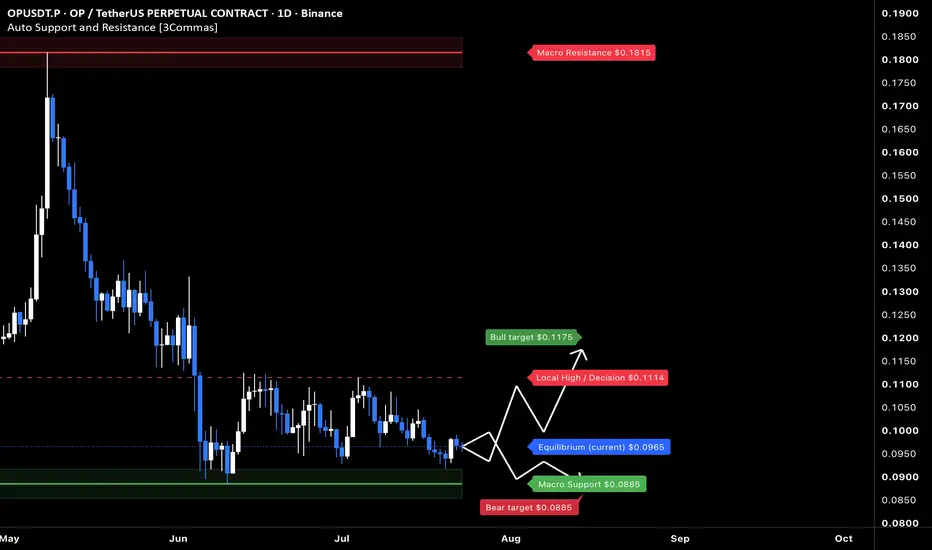
OP at macro floor: base recovery toward $0.1175The Macro Picture 🗺️
OP unwound from the $0.1815 macro ceiling all the way down and has flattened into a base just above the $0.0885 floor, now at $0.0965. The steep selling has given way to a sideways grind — exhaustion rather than continuation.
The Setup ⚙️
The Accumulation Zone 🟢
$0.0885–0.0965 is where the selling has dried up. Macro Support has held on retest, and this is the demand shelf a recovery would build from.
The Decision Point 🔴
$0.1114 (Local High) is the structural gate. Before it, the $0.1175 measured-move target is the first objective — reclaiming it proves buyers are stepping back in.
The Roadmap 🛣️
Hold the $0.0885 floor → recover toward $0.1114 → then push $0.1175. Invalidation is a clean daily close below $0.0885 — that voids the accumulation thesis.
This is a textbook DCA Accumulation Zone setup: scale in across the $0.0885–0.0965 band and let the base do the work.
More setups in profile.
#OP #Optimism #crypto #trading #TA #3Commas #DCA
OPUSDT - Bear Flag, Bearish Continuation Approaching?📊 Technical Analysis
💵 Coin: TSE:OP #OPUSDT
⏳ Time Frame: 1D
📐 Pattern: 🚩 Bear Flag (Bearish Continuation Pattern)
📉 OPUSDT is currently forming a 🚩 Bear Flag after experiencing a strong bearish decline (Flagpole). The price is now moving in an upward consolidation phase, forming the Flag, but it has yet to change the overall market structure to bullish.
⚠️ As long as the price remains inside the Bear Flag, the probability of a continuation to the downside remains higher.
---
🔍 Pattern Overview
🚩 A Bear Flag is a bearish continuation pattern that forms after a strong downward move (Flagpole), followed by a temporary upward consolidation that creates the Flag.
📊 This pattern indicates that the recent upward movement is likely just a temporary correction, while selling pressure continues to dominate the market.
⚠️ If the price successfully breaks down below the pattern's support, it could confirm the continuation of the existing downtrend.
---
🐻 Bearish Scenario (Higher Probability)
🔴 A breakdown below the Bear Flag support, confirmed by a strong daily candle and increasing volume, would validate the bearish continuation.
🎯 The first downside target is around the 0.0885 support level.
📉 If selling pressure continues to increase, OPUSDT could extend its decline toward lower support zones based on the Bear Flag projection.
🚨 As long as the price remains below the Bear Flag resistance, the overall market structure stays bearish.
---
🐂 Bullish Scenario
🟢 A bullish scenario becomes possible only if the price holds above the Bear Flag support and rebounds with increasing buying volume.
✅ A stronger bullish confirmation would occur if the price breaks out above the Bear Flag resistance and successfully flips it into support.
📈 If the breakout is sustained, bullish momentum could strengthen, allowing the price to test the next resistance levels.
---
🎯 Conclusion
📌 Overall, the OPUSDT market structure remains bearish, as the price is forming a 🚩 Bear Flag following a strong bearish impulse.
👀 The Bear Flag support is the key level to watch.
🔻 A breakdown would confirm the continuation of the downtrend.
🔺 A breakout above the Bear Flag resistance would be the primary signal to invalidate the bearish outlook.
⚠️ Always wait for candle confirmation and volume confirmation before making any trading decisions.
---
> ⚠️ Disclaimer: This analysis is for educational purposes only and should not be considered financial advice. Always Do Your Own Research (DYOR) and practice proper risk management.
#OPUSDT #OP #Crypto #CryptoTrading #TechnicalAnalysis #PriceAction #ChartAnalysis #TradingView #Altcoins #Binance #BearFlag #Bearish #BearishContinuation #Support #Resistance #Breakdown #CryptoSignals #SwingTrading #MarketAnalysis #DYOR
OPUSDT: Key Imbalance Established | Multi-Stage Partial Take-ProMarket Context & Order Flow
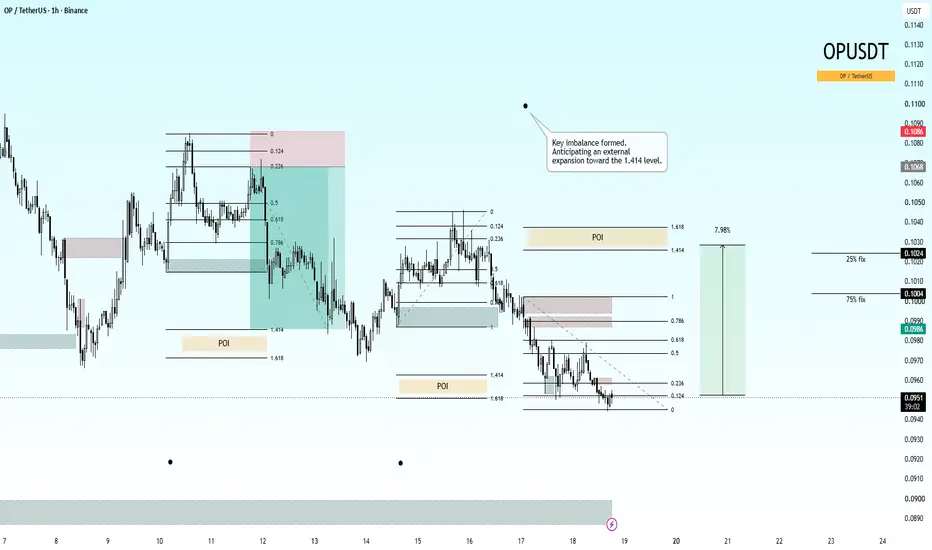
On the 1-hour timeframe, OP has generated a clean structural setup after tapping into a deep discount zone. A key imbalance has been formed, signaling institutional interest and an immediate bullish shift in local Order Flow.
Technical Highlights:
Imbalance & POI Confluence: The aggressive impulse confirmed a local Point of Interest (POI). The upcoming expansion is aimed directly at clearing the overhead liquidity pools up to the 1.414 external Fibonacci expansion level.
Target Metrics: The setup projects a potential ~7.98% move from the current structural accumulation low.
Trade Management (Locking in Percentages):
To secure risk efficiently, we are implementing a strict multi-stage partial take-profit strategy to lock in final percentages as follows:
First Target (75% fix): $0.1004 (Locking in the vast majority of the position upon taking out local structural liquidity).
Final Target (25% fix): $0.1024 (Fully closing the remaining volume at the 1.414 Fibonacci expansion / premium POI).
🚀 Boost this idea if you agree with the analysis, and feel free to share your thoughts in the comments below!
#OPUSDT may continue its trend after correction#OP
The price is moving within a descending channel on the 1-hour timeframe and has reached the lower boundary. It is now poised for a bounce and is expected to retest this boundary.
The Relative Strength Index (RSI) indicates a downward trend, which is likely to continue given the overbought conditions.
There is a key support zone in green at 0.0907. The price has bounced off this zone several times, making it a strong support level.
The price is trending towards the 100-period moving average, which we are approaching. This trend supports an upward move.
Entry Price: 0.0990
Target 1: 0.1025
Target 2: 0.1069
Target 3: 0.1120
Stop Loss: At the resistance zone in green
Remember this simple rule: Money management.
Any questions? Please leave a comment.
Thank you.
OP: basing above $0.089 toward the $0.115 capThe Macro Picture 🗺️
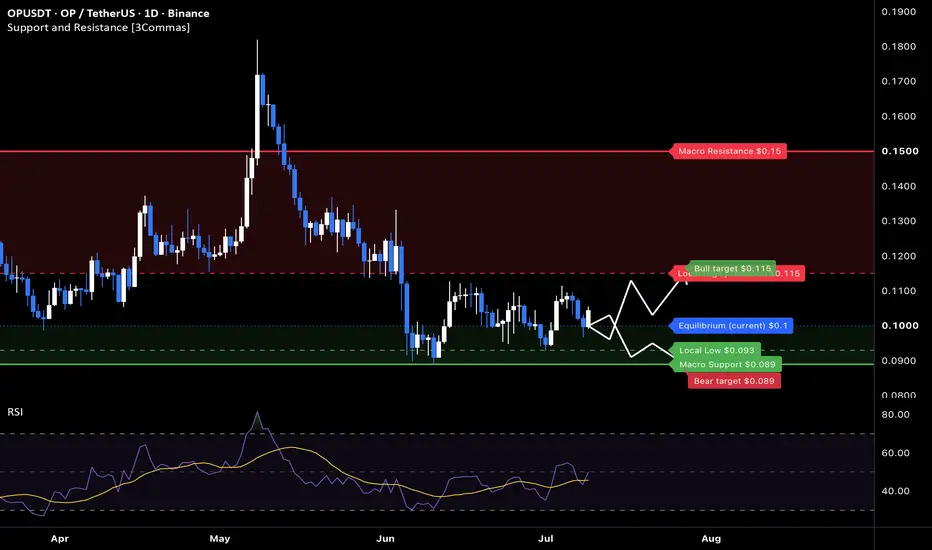
OP spiked to $0.18 in May before that move fully unwound, bleeding back down into a $0.089 June low. Since then the selling has dried up: price has settled into a range between the $0.089 macro floor and the $0.115 local cap, rotating around the $0.10 equilibrium. RSI hovers near neutral, confirming the post-spike hangover has given way to balance. This kind of low-volatility base above a defended floor is where accumulation quietly builds — the move has reset, and the next expansion waits on a break of either edge.
The Setup ⚙️
The Floor: The $0.089 macro support (solid green) has held every retest since June, stacking with the $0.093 local low to form a high-confluence demand shelf. This is the line bulls must keep defending to preserve the base.
The Ceiling: The $0.115 local decision (red dashed) caps the range. A decisive daily close above it would break the coil and put the heavier $0.15 supply band back in view.
The Range Play: The $0.093–$0.10 band creates a structural playground for grid-based accumulation — mechanical entries stacked across the range while price coils, no directional call required until the break confirms.
The Roadmap: Primary target sits at $0.115 — the green roadmap points toward a rotation to the range ceiling as buyers hold the floor. Invalidation: a sustained 1D close below $0.089 would break the base and reopen the downtrend toward fresh lows.
More setups in profile.
OPUSDT 4H High Probability Long Setup
Trade Bias: Bullish (Buy Limit)
After a strong impulsive rally, OPUSDT s currently pulling back into a potential demand zone. This correction appears healthy and could provide an attractive risk-to-reward opportunity if buyers defend the support area.
Trade Plan
Entry: 0.1029
Stop Loss: 0.0990
Take Profit 1: 0.1069
Take Profit 2: 0.1096
Technical Analysis
✅ Strong bullish impulse indicating buyers are in control.
✅ Current decline looks like a pullback rather than a trend reversal.
✅ Entry is positioned near a previous support/demand zone where buying interest may return.
✅ Risk-to-reward ratio is favorable, offering disciplined trade management.
Trade Management
Wait for price to react positively around the entry zone before confirming the long position.
Consider securing partial profits at TP1 and moving the stop loss to breakeven.
Hold the remaining position for TP2 if bullish momentum continues.
Invalidation
A decisive 4H candle close below 0.0990 would invalidate the bullish setup and suggest further downside.
This analysis is based on price action and risk management principles. Always manage your risk and never risk more than you can afford to lose.
**#OPUSDT #Crypto #TradingView #PriceAction #TechnicalAnalysis #Altcoins #RiskManagement #SwingTrading #CryptoTrading
#OPUSDT may continue its trend after correction#OP
The price is moving within a descending channel on the 1-hour timeframe and has reached the lower boundary. It is now poised for a bounce and is expected to retest this boundary.
The Relative Strength Index (RSI) indicates a downward trend, which is likely to continue given the overbought conditions.
There is a key support zone in green at 0.0884. The price has bounced off this zone several times, making it a strong support level.
The price is trending towards the 100-period moving average, which we are approaching. This trend supports an upward move.
Entry Price: 0.0942
Target 1: 0.0962
Target 2: 0.0996
Target 3: 0.1043
Stop Loss: At the resistance zone in green
Remember this simple rule: Money management.
Any questions? Please leave a comment.
Thank you.
OPUSDT Clean Long Setup — Reclaim + Compression Under ResistanceOP is setting up clean here, but the key word is setting up.
This is not about predicting. It’s about reading structure.
HTF Context 🔭
On the daily, OP is trying to recover after a heavy breakdown and reclaim back into the prior range. The bigger picture is still not fully bullish yet because price is sitting below major daily resistance around the 0.11250–0.11340 zone, but the structure has improved off the lows.
We had the flush lower, the response, and now price is trying to build acceptance back above short-term EMAs. That makes this a reclaim / continuation watch, not a full HTF trend reversal yet.
The daily still needs confirmation through the overhead resistance zone before I’d call this a clean bullish expansion.
LTF Structure 🧱
The 1H and 15m are where the setup gets interesting.
OP has been putting in higher lows, reclaiming short-term EMA structure, and compressing directly underneath local resistance. Price is tightening while the EMAs curl up underneath, which is exactly what I want to see before a breakout attempt.
This is the core idea:
Location → Compression → Confirmation
Location is decent because price is above the local reclaim area and holding structure.
Compression is building under resistance.
Confirmation has not fully triggered yet.
The setup gets cleaner if OP can break and accept above the local resistance around 0.1065–0.1070, then start working toward the prior high / liquidity area near 0.1084–0.1093.
Cycle Position ♻️
This looks like a possible crossback into base-n-break continuation.
The move off the lows gave the impulse.
The pullbacks are holding better structure.
Now price is compressing near the top of the range instead of rejecting hard.
That is constructive.
But the breakout still needs participation. A weak push into resistance with no acceptance is not enough.
Relative Strength
OP/BTC is breaking higher, looking very much like a wyckoff accumulation
Continuation Scenario 🟢
The bullish setup confirms if OP can:
Break above 0.1065–0.1070
Hold above the breakout area
Show impulse / volume participation
Continue building higher lows above the short-term EMA stack
If that confirms, the next areas I’d be watching are:
0.1084 / 0.1093 first, then the larger daily resistance zone near 0.1125–0.1134.
That daily zone is where the trade context changes from “LTF long setup” into a bigger reclaim attempt.
Failure Scenario 🔴
This idea fails if OP rejects the breakout area and accepts back below the compression base.
The first warning would be losing the 15m/1H EMA structure.
The cleaner invalidation is a breakdown back below the local higher-low structure near 0.1040–0.1032.
If price loses that area, this becomes another failed reclaim instead of a continuation setup.
Execution Mindset 🎯
This is a clean watchlist setup, but the trade is not live until confirmation.
A+ setups do not need to be forced.
Let price prove it can expand through resistance, then manage against the structure it creates.
Not financial advice. Not a signal. Just how I’m reading structure and participation.
OPUSDT - Bear Flag, Breakdown or Reversal?🔍 On the 8H timeframe, OPUSDT continues to trade within a well-defined Bear Flag pattern following a strong impulsive decline. This pattern is widely recognized as a bearish continuation formation, suggesting that the current consolidation may simply be a temporary pause before the next leg lower.
📈 Price is currently moving inside an ascending channel, forming higher lows while repeatedly failing to achieve a convincing breakout above the upper trendline.
📉 Meanwhile, the broader market structure remains bearish, as lower highs on the higher timeframe continue to dominate the trend.
⚠️ As long as the price remains confined within this Bear Flag, sellers continue to maintain the technical advantage.
---
🐻📉 Bear Flag Pattern Explained
A Bear Flag consists of two key components:
📍 📉 Flagpole
- A sharp and impulsive decline that reflects strong selling pressure.
📍 📈 Flag
- An upward-sloping consolidation channel where buyers temporarily push prices higher, but bullish momentum gradually weakens.
💡 This structure often indicates that the market is preparing for another bearish continuation once key support levels are broken.
✅ The current Bear Flag remains valid because:
✔️ The consolidation channel continues to slope upward.
✔️ Price has not broken above the upper resistance trendline.
✔️ The overall higher-timeframe trend remains bearish.
---
🟢🚀 Bullish Scenario
The bearish outlook would begin to weaken if buyers are able to:
✅ Break and close above the upper yellow trendline.
✅ Sustain strong buying volume during the breakout.
✅ Successfully retest the broken resistance as new support.
✅ Form a higher high, thereby invalidating the current Bear Flag.
🚀 If these conditions are met, OPUSDT could initiate a stronger recovery toward the next resistance zones.
⚠️ However, confirmation remains essential, as false breakouts frequently occur within Bear Flag formations.
---
🔴📉 Bearish Scenario
The primary bias remains bearish.
❌ If the price fails to hold above the ascending lower trendline (red support) and breaks below the 0.0907 support level, selling pressure could intensify rapidly.
A confirmed breakdown would:
📉 Complete the Bear Flag pattern.
📉 Confirm a continuation of the previous downtrend.
📉 Increase the probability of a decline toward the 0.0885 support level and potentially even lower if bearish momentum continues to build.
🎯 This support zone should be closely monitored as the key confirmation area.
---
🎯 Key Levels
🟢 Bullish Confirmation
✅ Breakout above the upper yellow resistance.
✅ Strong candle close supported by increasing trading volume.
---
🔴 Bearish Confirmation
❌ Breakdown below the red ascending support.
❌ Loss of the 0.0907 support level.
❌ Potential continuation toward 0.0885 and lower.
---
💡📌 Conclusion
📊 OPUSDT continues to trade within a classic Bear Flag while the overall market structure remains bearish.
🐻 Until buyers invalidate this pattern with a confirmed breakout above the channel, the technical outlook continues to favor further downside.
⏳ The next significant move will likely occur once the price breaks out of this consolidation range.
📌 Traders are advised to wait for confirmation rather than anticipating the direction of the breakout.
---
#OPUSDT #OP #Crypto #Cryptocurrency #TechnicalAnalysis #TradingView #BearFlag #BearishContinuation #PriceAction #Support #Resistance #Trendline #CryptoTrading #Binance #Altcoins #ChartAnalysis
OP could become one of the most bullish altcoins in the market !On the chart, we can see several candles at the bottom with long lower wicks and small bodies. These are essentially long-legged doji candles, which indicate strong buying pressure.
Following these candles, a large bullish candle reclaimed a key level, reinforcing the bullish case.
We can also see a large bearish candle near the lows. This appears to have been a fear candle designed to shake out retail traders and force them out of their positions at the bottom.
Based on these signals, it is reasonable to expect that smart money may step into OP with significant buying pressure and potentially drive the price toward the targets marked on the chart.
If a pullback to the key level occurs, it will serve as our entry zone.
A daily candle close below the invalidation level will invalidate this outlook.
If you would like us to analyze a coin or altcoin for you, first like this post, then comment the name of your altcoin below.
What is your opinion about OP?
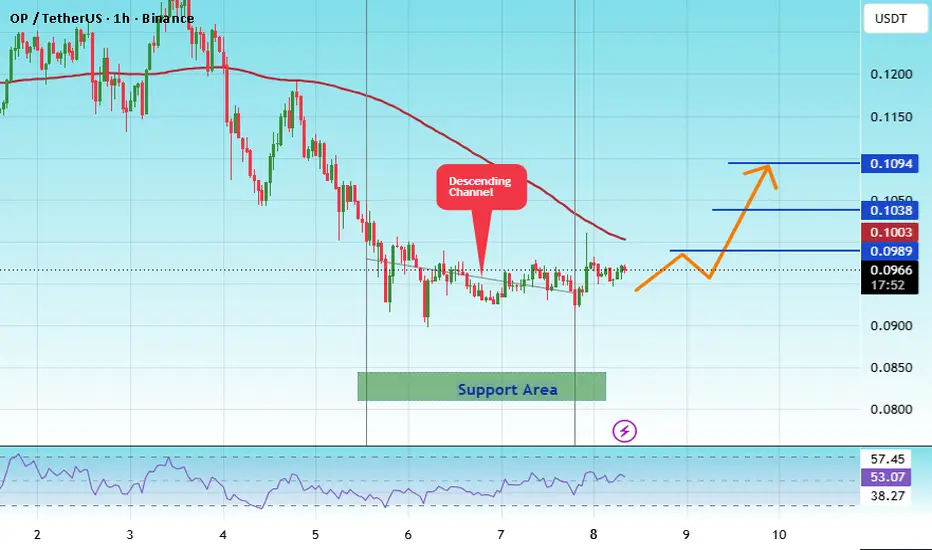
#OPUSDT may continue its trend after correction#OP
The price is moving within a descending channel on the 1-hour timeframe and has reached the lower boundary. It is now poised for a bounce and is expected to retest this boundary.
The Relative Strength Index (RSI) indicates a downward trend, which is likely to continue given the overbought conditions.
There is a key support zone (in green) at 0.0817. The price has bounced off this zone several times, making it a strong support level.
The price is trending towards the 100-period moving average, which we are approaching. This trend supports an upward move.
Entry Price: 0.0960
Target 1: 0.0989
Target 2: 0.1038
Target 3: 0.1094
Stop Loss: At the resistance zone (in green)
Remember this simple rule: Money management.
Any questions? Please leave a comment.
Thank you.
3500% trade in OPusdtHello Traders!
This could be one of the biggest opportunities of the month. A strong pump may happen soon, and the target is large enough that a 50x leveraged position could potentially deliver 3500%+ profit.
There is a strong reversal sign and market is about to take off and OPusdt will touch 0.16+ soon.
Our entry is 0.1
Stoploss 0.0758(-23.5%)
Target 0.1664(+67.7%)
My goal is to be recognized as one of the highest win-rate traders in the TradingView community. :)
Trade Analysis Based on
> Fibonacci Tool (A1000x Way) – Custom Fibonacci approach for precise market analysis
> Candlestick Patterns – Strong price action confirmation through key candle formations
> A1000x Breakout Strategy – Identifying and trading high-probability breakout setups
> HH, HL & LH, LL Strategy – Market structure analysis for clear trend direction
> Swing Points – Tracking key highs and lows for accurate price movement insight
> A1000x Stoploss Strategy – Strategic stoploss placement for effective risk control
> A1000x Target Strategy – Structured target setting based on price action
We trade using carefully developed strategies and disciplined market analysis, always seeking the best possible accuracy while remembering that ultimate success comes only by the will of Allah.
In some trades, you may notice a relatively larger stop loss or a risk-to-reward ratio that may appear unusual at first glance. However, every trade is taken with proper planning and calculated analysis, not random entries.
Before entering any position, we perform detailed calculations and market evaluation. Based on this analysis, we carefully determine our stop loss and target levels.
I personally apply one of my specialized stop-loss and target strategies, designed to place the stop loss at a logical market level where price is less likely to reach before moving toward the intended target — InshaAllah.
Trading always involves risk, but with discipline, patience, and proper strategy, we aim for consistent and responsible decision-making.
Feel free to share your thoughts, leave a comment, or contact me.
#OPUSDT may continue its trend after correction#OP
The price is moving within an ascending channel on the hourly timeframe. It has reached the lower boundary and is heading towards a breakout. A retest of this boundary is expected.
The Relative Strength Index (RSI) indicates a downward trend, and this trend is likely to continue due to the overbought condition.
There is a key resistance zone in green at 0.1100, which the price has bounced off several times, making it a strong support level.
A consolidation trend is observed below the 100-period moving average, which we are approaching. This trend supports a decline towards this level.
Entry Price: 0.1025
Target 1: 0.1000
Target 2: 0.0982
Target 3: 0.0961
Stop Loss: At the resistance zone in green.
Remember this simple rule: Manage your money wisely.
For any questions, please leave a comment.
Thank you.
Optimism sustained recovery from all-time low (6,000% new ATH) June 2026 is starting as a great month for the altcoins market, as many projects start to recover.
OPUSDT (Optimism) hit an all-time low in March and now starts to turn green again after a higher low. Here we have a very strong chart setup.
This project went through a brutal bear market starting March 2024, it lasted two years and now everything is changing.
Many of the altcoins that produced a strong bearish cycle between 2024 and 2026 are now looking great. Many are moving forward and some, like OPUSDT, are just now starting to recover—endless opportunity this market has to offer.
Here we are looking at the extreme opportunity buy-zone. Current prices are likely to be available for several weeks at most. There was already one bullish jump followed by a classic retrace, the next move will produce an advance that will maintain most of the gains. Think of TON, NEAR, HYPE, INJ, RIF and so on.
Once the uptrend gets started, there is no going back, we will experience long-term growth. This is the final call. OPUSDT has huge potential for growth, more than 2,222% in 1-2 years, more than 6,000% to a new ath.
Thank you for reading.
Namaste.
OP/USDT: QM Pattern Forms on Daily Chart#OPUSDT Daily Chart Analysis
Is Optimism about to pump? While the higher timeframe trend remains bearish, we are currently spotting a Quasimodo (QM) bullish pattern forming on the daily chart.
Here is the tactical game plan:
The Entry Strategy: If the price retraces into the designated Green Zone (our QM level) and prints a valid, high-probability lower-timeframe confirmation, we can execute a long position based on the charted setup.
Risk Management: This trade is highly risky as it runs counter to the major trend. Therefore, keeping the leverage at a maximum of 10x with low risk per trade is heavily advised. Do not enter without proper confirmation.
Chart Setup: All specific Take Profit targets and the Stop Loss level are fully mapped out on the chart.
We are keeping a close eye on the price action to see if this QM setup plays out.
What is your take on this OP setup? Drop your thoughts in the comments below.
#OPUSDT Ready to launch upwards#OP
The price is moving within a descending channel on the 1-hour timeframe and has reached the lower boundary. It is now poised for a bounce and is expected to retest this boundary.
The Relative Strength Index (RSI) indicates a downward trend, which is likely to continue given the overbought conditions.
There is a key support zone in green at 1140. The price has bounced off this zone several times, making it a strong support level.
The price is trending towards the 100-period moving average, which we are approaching. This trend supports an upward move.
Entry Price: 0.1250
First Target: 0.1291
Second Target: 0.1348
Third Target: 0.1400
You can stop at the first and second targets and close the price, or continue towards the third target. Stop Loss: At the resistance zone in green.
Remember this simple rule: Money Management.
Any questions? Please leave a comment.
Thank you.
#OPUSDT Ready to launch upwards#OP
The price is moving within a descending channel on the hourly timeframe. It has reached the lower boundary and is trending towards a bounce. A retest of this boundary is expected.
The Relative Strength Index (RSI) indicates a downward trend, and this trend is likely to continue due to the overbought condition.
A key support zone (in green) has been found at 0.1160. The price has bounced off this zone several times, making it a strong support level.
The price is trending towards the 100-period moving average, which we are approaching. This trend supports an upward move.
Entry Price: 0.1220
First Target: 0.1241
Second Target: 0.1275
Third Target: 0.1311
You can close at the second target or wait for the third target to be reached. The choice is yours.
Stop Loss: At the resistance zone (in green).
Remember this simple rule: Money Management.
Any questions? Please leave a comment.
Thank you.
#OPUSDT Ready to launch upwards#OP
The price is moving within a descending channel on the 1-hour timeframe and has reached the lower boundary. It is now poised for a bounce and is expected to retest this boundary.
The Relative Strength Index (RSI) indicates a downward trend, which is likely to continue given the overbought conditions.
There is a key support zone (in green) at 0.1178, and the price has bounced off this zone several times, making it a strong support level.
The price is trending towards the 100-period moving average, which we are approaching. This trend supports an upward move.
Entry Price: 0.1267
First Target: 0.1292
Second Target: 0.1321
Third Target: 0.1356
You can stop at the first and second targets and close below them, or continue towards the third target. Stop Loss: At the resistance zone (in green).
Remember this simple rule: Money Management.
Any questions? Please leave a comment.
Thank you.