OPUSDT: Breakout Retest Could Fuel the Next RallyOPUSDT has reclaimed a key resistance zone and is now holding above the breakout level, signaling improving bullish momentum. The recent higher lows suggest buyers remain in control.
As long as 0.09597 holds as support, the bullish setup remains valid. A continuation above the current range could d
Compare with OPU/SDT
#OPUSDT may continue its trend after correction#OP
The price is moving within a descending channel on the 1-hour timeframe and has reached the lower boundary. It is now poised for a bounce and is expected to retest this boundary.
The Relative Strength Index (RSI) indicates a downward trend, which is likely to continue given the overbought cond
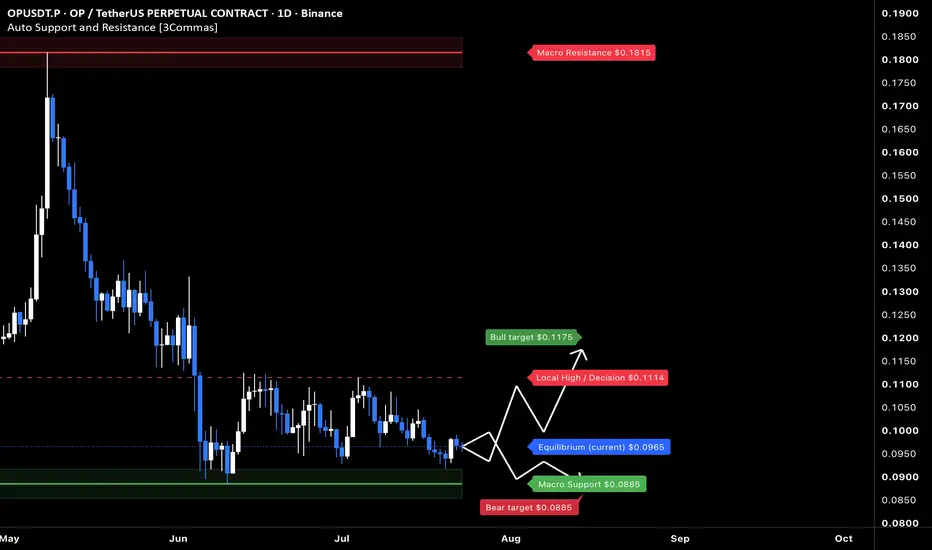
OP at macro floor: base recovery toward $0.1175The Macro Picture 🗺️
OP unwound from the $0.1815 macro ceiling all the way down and has flattened into a base just above the $0.0885 floor, now at $0.0965. The steep selling has given way to a sideways grind — exhaustion rather than continuation.
The Setup ⚙️
The Accumulation Zone 🟢
$0.0885–0.096
OPUSDT - Bear Flag, Bearish Continuation Approaching?📊 Technical Analysis
💵 Coin: TSE:OP #OPUSDT
⏳ Time Frame: 1D
📐 Pattern: 🚩 Bear Flag (Bearish Continuation Pattern)
📉 OPUSDT is currently forming a 🚩 Bear Flag after experiencing a strong bearish decline (Flagpole). The price is now moving in an upward consolidation phase, forming the Flag, but i
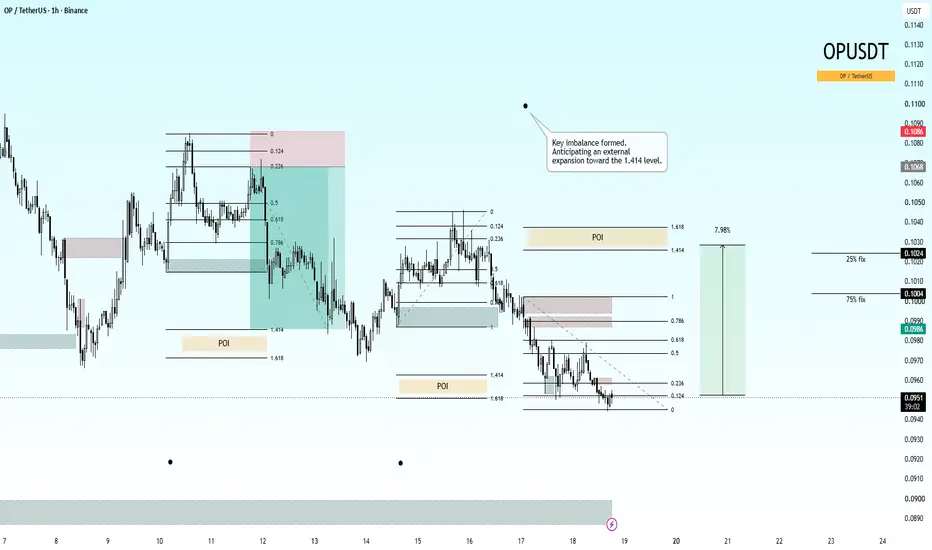
OPUSDT: Key Imbalance Established | Multi-Stage Partial Take-ProMarket Context & Order Flow
On the 1-hour timeframe, OP has generated a clean structural setup after tapping into a deep discount zone. A key imbalance has been formed, signaling institutional interest and an immediate bullish shift in local Order Flow.
Technical Highlights:
Imbalance & POI Conflu
#OPUSDT may continue its trend after correction#OP
The price is moving within a descending channel on the 1-hour timeframe and has reached the lower boundary. It is now poised for a bounce and is expected to retest this boundary.
The Relative Strength Index (RSI) indicates a downward trend, which is likely to continue given the overbought cond
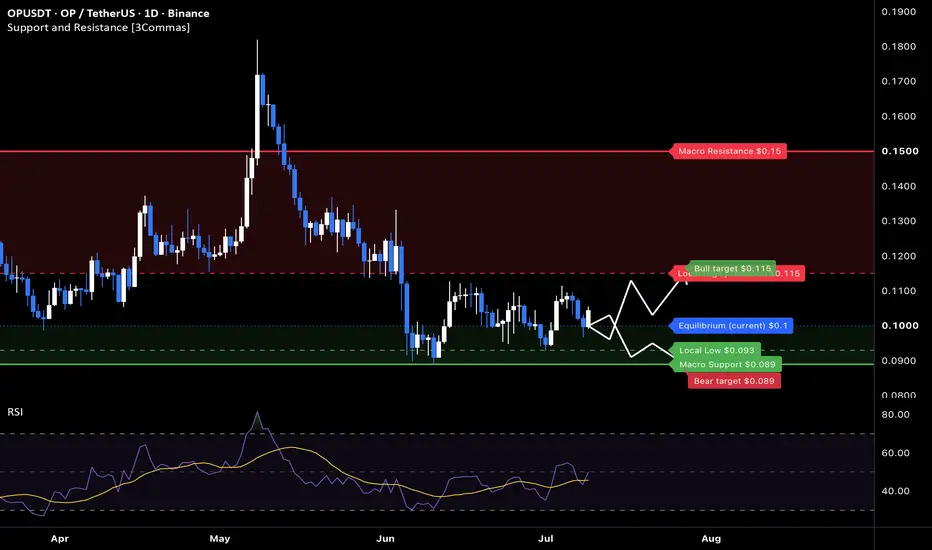
OP: basing above $0.089 toward the $0.115 capThe Macro Picture 🗺️
OP spiked to $0.18 in May before that move fully unwound, bleeding back down into a $0.089 June low. Since then the selling has dried up: price has settled into a range between the $0.089 macro floor and the $0.115 local cap, rotating around the $0.10 equilibrium. RSI hovers n
OPUSDT 4H High Probability Long Setup
Trade Bias: Bullish (Buy Limit)
After a strong impulsive rally, OPUSDT s currently pulling back into a potential demand zone. This correction appears healthy and could provide an attractive risk-to-reward opportunity if buyers defend the support area.
Trade Plan
Entry: 0.1029
Stop Loss: 0.09
#OPUSDT may continue its trend after correction#OP
The price is moving within a descending channel on the 1-hour timeframe and has reached the lower boundary. It is now poised for a bounce and is expected to retest this boundary.
The Relative Strength Index (RSI) indicates a downward trend, which is likely to continue given the overbought cond
See all ideas
Summarizing what the indicators are suggesting.
Oscillators
Neutral
SellBuy
Strong sellStrong buy
Strong sellSellNeutralBuyStrong buy
Oscillators
Neutral
SellBuy
Strong sellStrong buy
Strong sellSellNeutralBuyStrong buy
Summary
Neutral
SellBuy
Strong sellStrong buy
Strong sellSellNeutralBuyStrong buy
Summary
Neutral
SellBuy
Strong sellStrong buy
Strong sellSellNeutralBuyStrong buy
Summary
Neutral
SellBuy
Strong sellStrong buy
Strong sellSellNeutralBuyStrong buy
Moving Averages
Neutral
SellBuy
Strong sellStrong buy
Strong sellSellNeutralBuyStrong buy
Moving Averages
Neutral
SellBuy
Strong sellStrong buy
Strong sellSellNeutralBuyStrong buy
Displays a symbol's price movements over previous years to identify recurring trends.
Frequently asked questions
The current price of Optimism / USDT (OP) is 0.16170 USDT — it hasn't changed in the past 24 hours. Try placing this info into the context by checking out what coins are also gaining and losing at the moment and seeing OP price chart.
Optimism / USDT price has fallen by −0.12% over the last week, its month performance shows a −22.18% decrease, and as for the last year, Optimism / USDT has decreased by −82.02%. See more dynamics on OP price chart.
Keep track of coins' changes with our Crypto Coins Heatmap.
Optimism / USDT (OP) reached its highest price on Jul 28, 2025 — it amounted to 0.89910 USDT. Find more insights on the OP price chart.
See the list of crypto gainers and choose what best fits your strategy.
Optimism / USDT (OP) reached the lowest price of 0.09472 USDT on Jul 10, 2026. View more Optimism / USDT dynamics on the price chart.
See the list of crypto losers to find unexpected opportunities.
The safest choice when buying OP is to go to a well-known crypto exchange. Some of the popular names are Binance, Coinbase, Kraken. But you'll have to find a reliable broker and create an account first. You can trade OP right from TradingView charts — just choose a broker and connect to your account.
Crypto markets are famous for their volatility, so one should study all the available stats before adding crypto assets to their portfolio. Very often it's technical analysis that comes in handy. We prepared technical ratings for Optimism / USDT (OP): today its technical analysis shows the sell signal, and according to the 1 week rating OP shows the sell signal. And you'd better dig deeper and study 1 month rating too — it's neutral. Find inspiration in Optimism / USDT trading ideas and keep track of what's moving crypto markets with our crypto news feed.
You can discuss Optimism / USDT (OP) with other users in our public chats, Minds or in the comments to Ideas.