ORDI: Retesting Lower Boundary of Ascending TriangleORDI: Retesting Lower Boundary of Ascending Triangle – Dual Strategic Long Execution Framework
ORDI is coiling tightly within an ascending accumulation triangle, officially establishing its 4th touchpoint right at the lower support baseline. From a technical perspective, a price rejection and bounce off the lower boundary of a horizontal consolidation structure provides a textbook signal to initiate Long positions ahead of a potential trend expansion wave.
Based on the visual data from the daily chart , although the price action has mostly remained suppressed beneath the dynamic MA100 trendline during this compression phase, current levels receive powerful structural backing from the $2.30–$2.50 macro support floor. This zone serves as a key strategic base, functioning as the launchpad that triggered a massive 4x rally back in April. Complete seller depletion near this floor confirms that buyers are regaining control over the market framework.
This technical environment delivers two attractive Long execution scenarios:
Scenario 1: Proactively enter a Long position right at the current lower triangle boundary to optimize for a tight stop-loss placement directly beneath the pattern floor.
Scenario 2: Patiently await a deeper pullback to retest the strong $2.30–$2.50 support cushion (a less likely scenario).
Disclaimer: This is not financial advice, DYOR.
In-depth trading ideas
ORDI: Ascending Triangle Compression Reaches ApexORDI: Ascending Triangle Compression Reaches Apex – Dual Strategic Long Setups for Expansion Wave
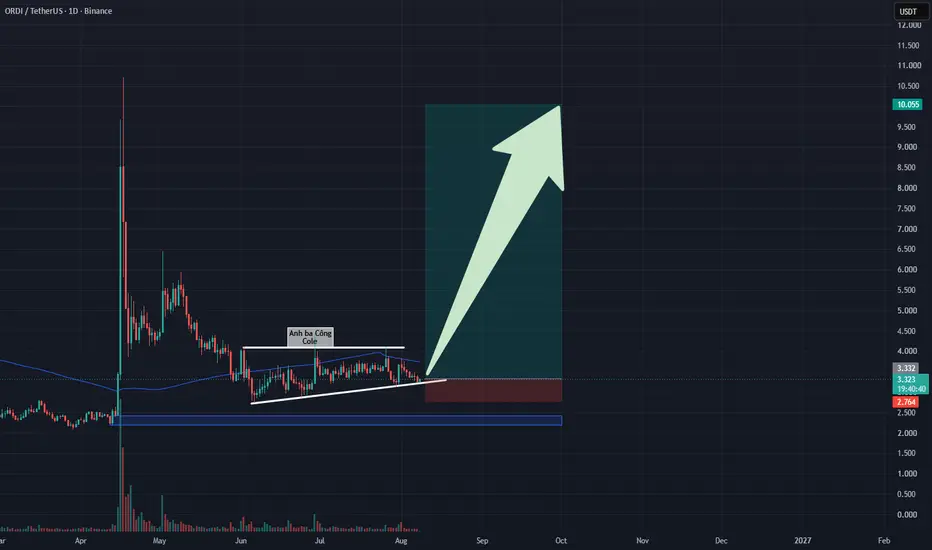
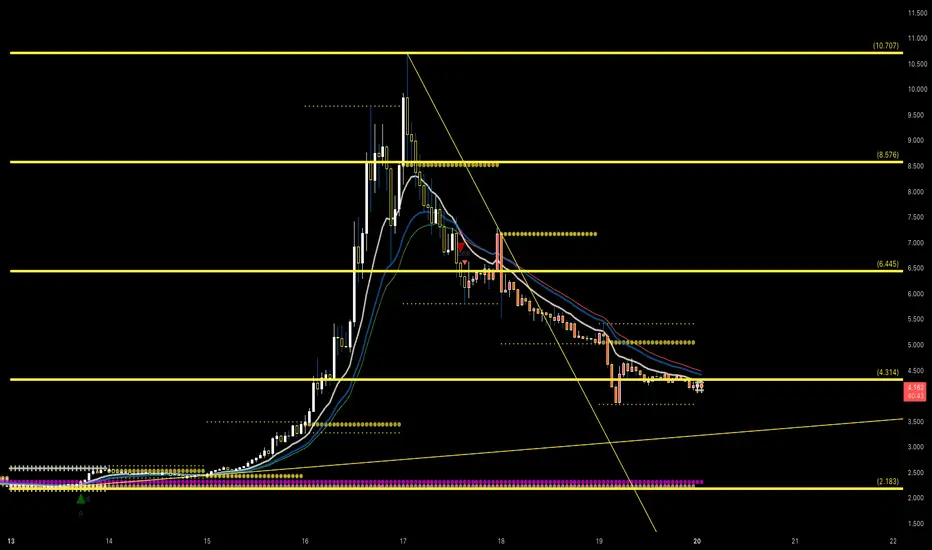
ORDI is fast approaching an explosive momentum trigger following an extended period of tight range compression. After its rapid surge from $2.20 to $10.70 in mid-April, the price action entered a healthy technical cooling-off phase, carving out a local swing low at $2.75 in early June. Since then, the asset has been consolidating inside a classic ascending triangle structure, facing a major resistance ceiling at $4.15–$4.20.
Based on the visual data from the daily chart , the price action has reached the apex of the pattern, registering a textbook sequence of 3 touches at the upper resistance and 3 touches along the ascending support floor. The complete absence of selling power to drive prices down toward the deep $2.20 support cushion, combined with sequentially higher lows, confirms that buying demand is steadily building and seizing structural control.
This environment presents two highly proactive Long trading scenarios. The primary preferred setup is to wait for a daily candle to close decisively above the $4.15–$4.20 resistance ceiling to trigger a trend-following Long entry targeting the $10.00 zone. The secondary setup involves waiting for a liquidity sweep back into the $2.20 baseline to trigger a bottom-fishing Long entry targeting the $4.10 triangle ceiling.
Disclaimer: This is not financial advice, DYOR.
ORD USDT LONG SIGNAL#133. ORD/USDT – Trade Setup (LONG)
📈 Position Type: LONG
🕒 Timeframe: 1H
📊 Market: Futures
💰 Entry Zone:
3.600
🛑 Stop-Loss:
3.450
🎯 Take-Profit Targets:
• TP1: 3.715
• TP2: 3.848
• TP3: 3.985
• TP4: 4.133
⚙️ Leverage:
5*10
▫️ After TP1, move SL to Entry + 0.2%.
▪️ Exit Plan:
• 40% at TP1
• 20% at TP2
• 20% at TP3
20%. at. TP4
📌 Risk Management:
Risk only 1–2% of your capital per trade.
⚠️ Always check and confirm the setup on your chart before entering the trade.
ORD USDT SHORT SIGNAL#88 ORD/USDT – Trade Setup (SHORT)
📈 Position Type: SHORT
🕒 Timeframe: 1H
📊 Market: Futures
💰 Entry Zone:
3.617
🛑 Stop-Loss:
3.728
🎯 Take-Profit Targets:
• TP1: 3.546
• TP2: 3.462
• TP3: 3.367
• TP4: 3.269
⚙️ Leverage:
5 *10
▫️ After TP1, move SL to Entry + 0.2%.
▪️ Exit Plan:
• 40% at TP1
• 20% at TP2
• 20% at TP3
20% at. TP4
📌 Risk Management:
Risk only 1–2% of your capital per trade.
⚠️ Always check and confirm the setup on your chart before entering the trade.
⚠️
ORDI USDT SHORT SIGNAL#90. ORDI/USDT – Trade Setup (SHORT)
📈 Position Type: short
🕒 Timeframe: 1 H
📊 Market: Futures
💰 Entry Zone:
3.507
🛑 Stop-Loss:
3.648
🎯 Take-Profit Targets:
• TP1: 3.446
• TP2: 3.371
• TP3: 3.301
• TP4: 3.226
TP5: 3.150
TP6:
⚙️ Leverage:
5- 10
⚠️ After reaching TP1, move Stop-Loss to Entry Price.
📌 Risk Management:
Risk only 1–2% of your capital per trade.
Always confirm the setup on your chart before entry
$ORDI 4H TF ANALYSISCRYPTOCAP:ORDI is currently trading below an important 4H resistance zone around $3.61–$3.66.
My plan is simple if CRYPTOCAP:ORDI breaks above this red box, gives a 4H candle close above it, and price sustains above the zone, I’ll look for a LONG setup. 👀🔥
No breakout = No trade. I’ll wait for confirmation instead of chasing the price.
Follow @HamzaTheInsider for more learning-based market analysis. ❤️
#ORDI #Crypto #Altcoins #CryptoTrading #PriceAction #TechnicalAnalysis #HamzaTheInsider
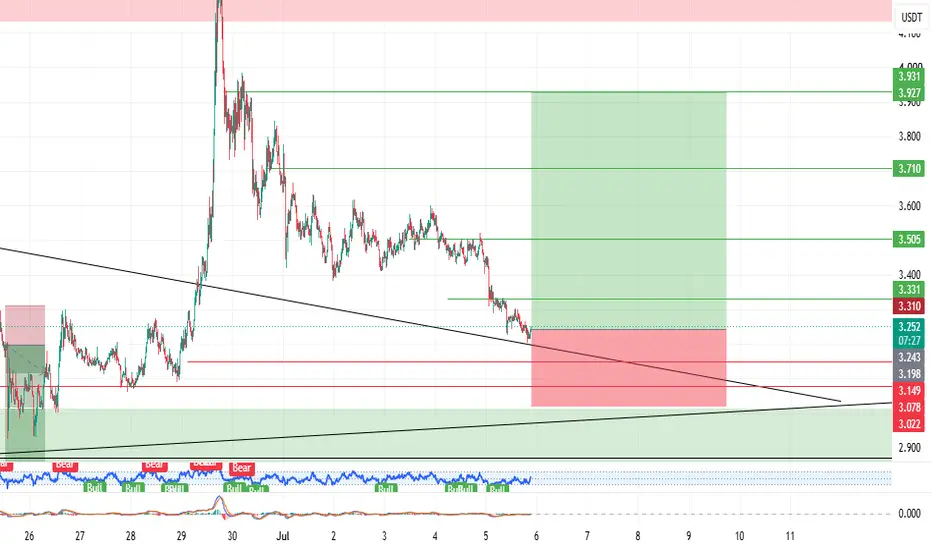
#ORDI Possible Scenario Medium-Term: The chart shows a broader corrective downtrend from July 1st to July 6th, where price actions printed lower highs and lower lows, bottoming out just above the 3.200 level.
Short-Term: A sharp, aggressive bullish reversal began on July 6th. The price has surged back up, breaking through minor previous resistance structures and shifting market structure to a short-term uptrend.
ORDI USDT LONG SIGNAL#16 ORDI/USDT – Trade Setup (LONG)
📈 Position Type: LONG
🕒 Timeframe: 1 H
📊 Market: Futures
💰 Entry Zone:
3.244
3.078
🛑 Stop-Loss:
3.019
🎯 Take-Profit Targets:
• TP1: 3.330
• TP2: 3.505
• TP3: 3.710
• TP4: 3.926
TP5:
TP6:
⚙️ Leverage:
5- 3
⚠️ After reaching TP1, move Stop-Loss to Entry Price.
📌 Risk Management:
Risk only 1–2% of your capital per trade.
Always confirm the setup on your chart before entry
ORDI USDT LONG SIGNALORDI/USDT – Trade Setup (LONG)
📈 Position Type: LONG
🕒 Timeframe: 1 H
📊 Market: Futures
💰 Entry Zone:
3.205
3.10
🛑 Stop-Loss:
3.030
🎯 Take-Profit Targets:
• TP1: 3.390
• TP2: 3.567
• TP3: 3.757
• TP4: 3.966
TP5:
TP6:
⚙️ Leverage:
5- 3
⚠️ After reaching TP1, move Stop-Loss to Entry Price.
📌 Risk Management:
Risk only 1–2% of your capital per trade.
Always confirm the setup on your chart before entry
ORDIUSDT Forming Bullish MomentumORDIUSDT is forming a clear bullish momentum pattern, a classic bullish wave signal that often indicates an upcoming breakout. The price has been consolidating within a narrowing range, suggesting that selling pressure is weakening while buyers are beginning to regain control. With consistent volume confirming accumulation at lower levels, the setup hints at a potential bullish breakout soon. The projected move could lead to an impressive gain of around 140% to 150% once the price breaks above the wedge resistance.
This bullish momentum pattern is typically seen at the end of downtrends or corrective phases, and it represents a potential shift in market sentiment from bearish to bullish. Traders closely watching ORDIUSDT are noting the strengthening momentum as it nears a breakout zone. Strong trading volume adds confidence to this pattern, showing that market participants are positioning early in anticipation of a reversal.
Investors’ growing interest in ORDIUSDT reflects rising confidence in the project's long-term fundamentals and current technical strength. If the breakout confirms with sustained volume, this could mark the start of a fresh bullish leg. The current consolidation phase suggests that buyers are steadily accumulating positions while selling pressure continues to fade.
Traders might find this a valuable setup for medium-term gains, especially as the bullish momentum pattern approaches completion and buying pressure continues to build. A confirmed breakout above resistance could attract additional market participation and potentially drive the price toward its projected upside target over the coming weeks.
✅ Show your support by hitting the like button!
✅ Leave a comment below! (What is your opinion about this coin?)
Your feedback and engagement keep me inspired to share more insightful market analysis with you!
ORD USDT LONG SIGNALORD/USDT – Trade Setup (LONG)
📈 Position Type: LONG
🕒 Timeframe: 1 H
📊 Market: Futures
💰 Entry Zone:
3.457
3.387
🛑 Stop-Loss:
3.293
🎯 Take-Profit Targets:
• TP1: 3.555
• TP2: 3.672
• TP3: 3.774
• TP4: 3.90
TP5:
TP6:
⚙️ Leverage:
5-
⚠️ After reaching TP1, move Stop-Loss to Entry Price.
📌 Risk Management:
Risk only 1–2% of your capital per trade.
Always confirm the setup on your chart before entry
Ordinals: Trading volume & bullish action (new All-Time High)I will keep this one very short and simple just that we can enjoy the beauty of technical analysis.
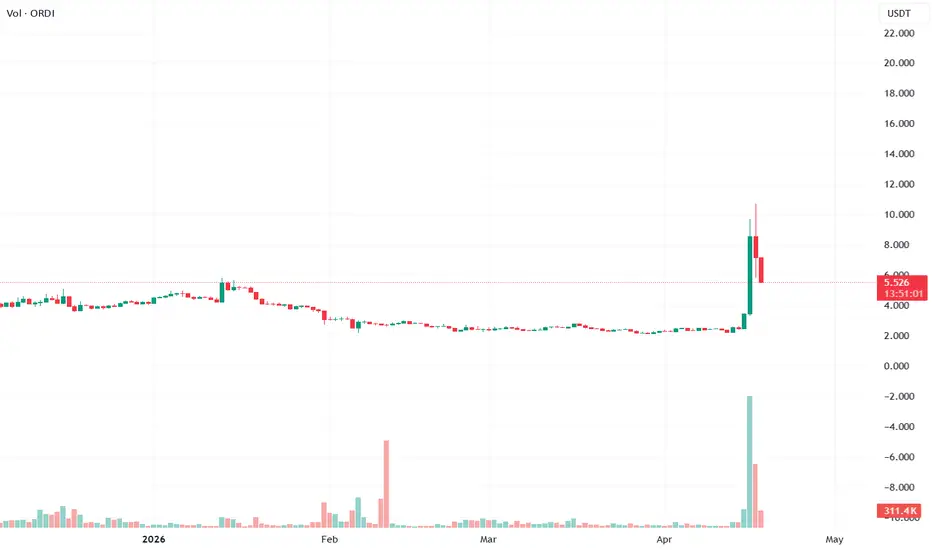
» In November 2023, ORDIUSDT printed a session with the highest volume ever and right after we saw months of sustained growth, a bullish wave reaching an incredible 3,333%.
» In April 2026, ORDIUSDT printed a new session with the highest volume ever and this signal tends to appear in anticipation of maximum growth. Just as before, we can see a bull market develop.
» A new all-time high is possible in the coming years, can be mid to late 2027 or 2028. It is unlikely that it will happen in 2026 but still a possibility, since a bullish cycle can unfold in several months. This isn't our main view though. We get some bullish action in 2026 but the market heats up in 2027 and beyond.
Thank you for reading.
Namaste.
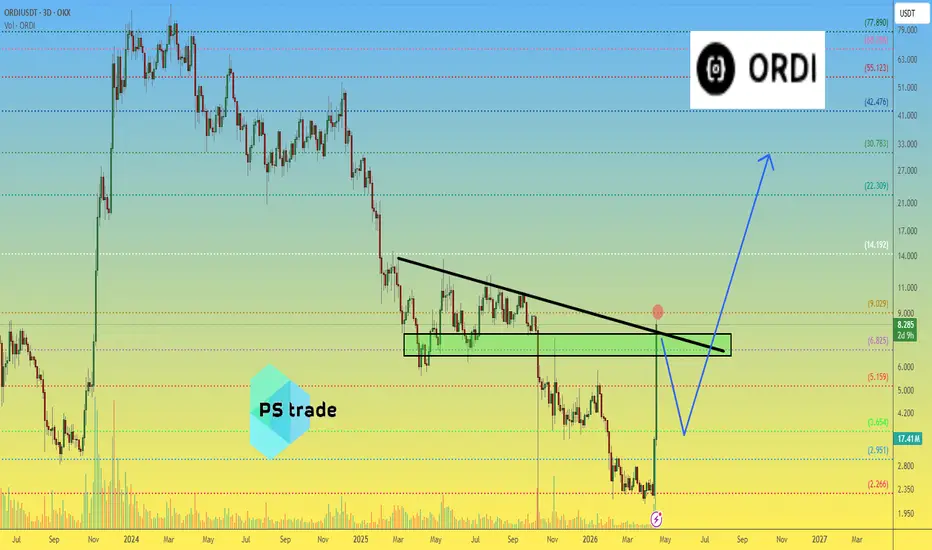
Ordinals: Another higher low & bullish resumption (PP: 888%)Here is another project that is clearly bullish and set to produce a new wave of growth, a higher high compared to April which means a price in the next three months between $21 and $33.3.
ORDIUSDT (Ordinals) hit bottom between February & March 2026. In April we saw a massive flash jump. This move confirms the end of the bear market and the start of a new market phase.
The initial jump was corrected as it usually happens and support was found right above the "opportunity buy zone." This is the same chart I shared in mid-April with the first target being hit perfectly, now we are aiming for the second target.
By looking at this project, and those others I shared recently, we can see how some altcoins are going down while others grow. Some produce lower lows while others are doing very strong bullish breakouts. This is why it is important to take your time to choose, choose wisely, the market always offers a second chance.
If you go through the charts over and over, again and again, the one that is good for you will stand out and then you can take the jump. There is no need to rush.
This is another good chart setup, confirmed bullish, with the highest volume ever showing up just two months ago. This signal predicts a new bullish cycle, a long-term process of growth. There are just too many signals in support of a bullish market, there is no room for bearish doubts. Crypto is going up.
Namaste.
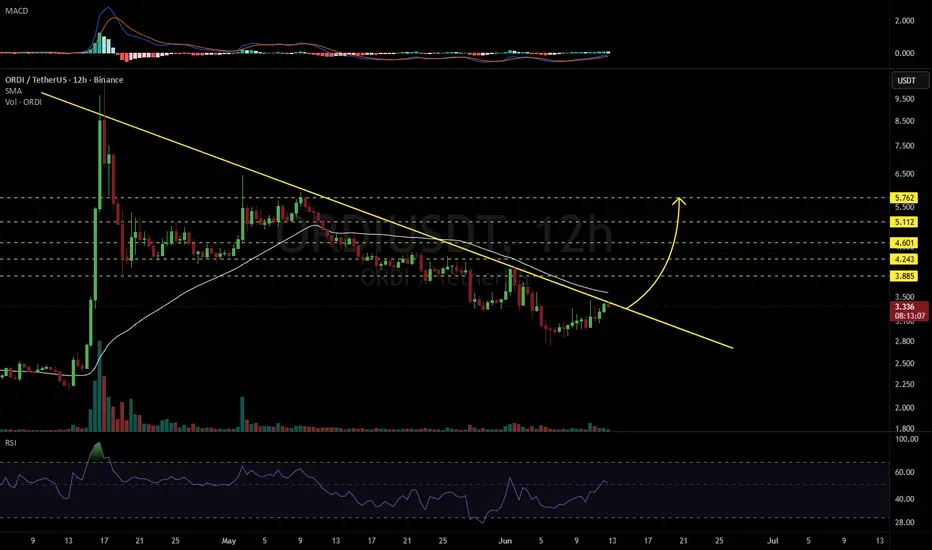
ORDIUSDT 12H#ORDI is currently testing the descending resistance on the 12-hour timeframe.
Avoid entering this coin until a confirmed breakout with strong volume occurs above both the descending resistance and the 12H SMA50. If such a breakout takes place, the following upside targets could come into play:
🎯 $3.885
🎯 $4.243
🎯 $4.601
🎯 $5.112
🎯 $5.762
⚠️ Always remember to use a tight stop-loss and maintain proper risk management.
ORDIUSDT Forming Bullish MomentumORDIUSDT is forming a clear bullish momentum pattern, a classic bullish wave signal that often indicates an upcoming breakout. The price has been consolidating within a narrowing range, suggesting that selling pressure is weakening while buyers are beginning to regain control. With consistent volume confirming accumulation at lower levels, the setup hints at a potential bullish breakout soon. The projected move could lead to an impressive gain of around 90% to 100% once the price breaks above the wedge resistance.
This bullish momentum pattern is typically seen at the end of downtrends or corrective phases, and it represents a potential shift in market sentiment from bearish to bullish. Traders closely watching ORDIUSDT are noting the strengthening momentum as it nears a breakout zone. The good trading volume adds confidence to this pattern, showing that market participants are positioning early in anticipation of a reversal.
Investors’ growing interest in ORDIUSDT reflects rising confidence in the project’s long-term fundamentals and current technical strength. If the breakout confirms with sustained volume, this could mark the start of a fresh bullish leg. Traders might find this a valuable setup for medium-term gains, especially as the wedge pattern completes and buying momentum accelerates.
✅ Show your support by hitting the like button and
✅ Leaving a comment below! (What is your opinion about this coin?)
Your feedback and engagement keep me inspired to share more insightful market analysis with you!
ORDI price analysisCRYPTOCAP:ORDI appears to be replicating a similar price structure recently observed in CRYPTOCAP:ENJ , where a strong upward movement was followed by entry into a high-liquidity zone and subsequent signs of correction.
Currently, OKX:ORDIUSDT is trading within a region where market participants are more likely to consider profit-taking rather than initiating new long positions.
📈 Bullish scenario:
– short-term squeeze toward the $9 level
– driven by momentum and late-entry participants
📉 Base scenario:
– corrective move toward the $3.40–3.60 range
– structural reset before potential continuation of the uptrend
Such behavior aligns with typical post-impulse market dynamics, where liquidity zones act as distribution areas
______________
◆ Follow us ❤️ for daily crypto insights & updates!
🚀 Don’t miss out on important market moves
🧠 DYOR | This is not financial advice, just thinking out loud
ORDILiked ORDI short over weekend from around mid of last week's range citing inefficiencies below. First quarter is now line in sand; if below then continues to retrace last week's move. Still has inefficiencies below to support ongoing retrace to $2, but a shorter term bounce (especially if BTC pushes to 77) also possible.
ORDIUSDT Bear Dom + MeanZ Drop Post... -Spike Rollover Setup
ORDIUSDT prints 5.550 spot against 5.517 futures with F/S ratio 28.22x↑ at 10.7% percentile V.High tag — leverage unwound to Floor band. Volumes pair 11.64M spot / 64.59M USDT versus 330.15M futures / 1.83M USDT — premium -0.59% Xtreme Backwardation at Z -3.7σ, yield Bull -651% APY at -3.7σ.
Signal board stacks 17 bull to 42 bear out of 112 — bear-dominant reading Moderate BEAR 26.35% at 1.72x edge. C>T 0:14 pure bear, Engulf 2:9, Candle 2:12, DD/SS 2:6 all bear-weighted. EMA 5:1 and Ichi TK 7:4 only bull positives. Spread 26.4% Mod. Squeeze FIRED with BW 221.53% in Explosion. Momentum Bull↑ but S.Mom Exp↓ at 857.9% Explosion — momentum rolling over. MeanZ ↓↓ at -1.63σ Drop — mean has genuinely shifted downward.
Volume reads active — Spot Z 1.29 Elevated, Fut Z 1.26 Elevated, F+S Z 1.26 Elevated. SpotZ sequence 1.29:0.25:1.05 Accel▼▼ (acceleration flagged but direction is down on structure). Spot:Fut Confirmed. Bull:Bear Z -0.19:2.6 prints Bear Dom — bear side at 2.6σ, bull suppressed.
OBV Z sequence -0.26:-0.1 0.64 reads Strong↑ with OBV Divergence and Sprd Div both firing. Liq Clear. Whale None.
Price sits 46.6% Lower in 10.734/1.025 range — mid-range, not extreme either way. Retrace -48.3% Deep tagged BO at 3.3x bounce. AT Max 235.04x was 840 bars back.
The honest read: ORDI spiked vertically then dropped hard — classic pump-and-dump aftermath. Current structure is bear-dominant but not capitulation: Bear Dom at 2.6σ is strong but not exhaustion, C>T 0:14 total bear domination, MeanZ Drop at -1.63σ confirms genuine mean shift down, Squeeze Explosion already fired, S.Mom Exp↓ in Explosion downward. OBV Strong↑ with divergence is the only conflicting signal — some quiet bid underneath. Xtreme Backwardation at -3.7σ is nuclear spot-premium-over-futures (extreme short-squeeze fuel) but it's been there across the whole dump without triggering reversal, meaning spot holders are genuinely selling into futures-short cover rather than futures shorts capitulating. Leverage at 10.7% V.High tag despite Floor percentile = just wiped from 235x max — fresh wipe, fresh shorts loading. Biggest risk on this chart is shorts chasing into exhaustion: Bear Dom at 2.6σ without capitulation printing Bear Nuke (5+) means the move has further to go bear, but the -3.7σ backwardation is a landmine for late shorts. This is not a clean entry — trend is bearish, but any spot-driven reversal will detonate violently. Patient traders wait for OBV Flood confirmation at a lower low, or for signal board to rebalance below 35 bear before committing. Scalpers can short rallies to 5.8 with tight stops.
Is That Crypto Pump Real? Data Says No. Here's Why.
Stop Losing Money to Fake Volume. Find Real Moves Now.
Trade the REAL Crypto Volume. Stop Getting Faked Out.
ORDIUSDT Forming Falling WedgeORDIUSDT is forming a clear falling wedge pattern, a classic bullish reversal signal that often indicates an upcoming breakout. The price has been consolidating within a narrowing range, suggesting that selling pressure is weakening while buyers are beginning to regain control. With consistent volume confirming accumulation at lower levels, the setup hints at a potential bullish breakout soon. The projected move could lead to an impressive gain of around 90% to 100% once the price breaks above the wedge resistance.
This falling wedge pattern is typically seen at the end of downtrends or corrective phases, and it represents a potential shift in market sentiment from bearish to bullish. Traders closely watching ORDIUSDT are noting the strengthening momentum as it nears a breakout zone. The good trading volume adds confidence to this pattern, showing that market participants are positioning early in anticipation of a reversal.
Investors’ growing interest in ORDIUSDT reflects rising confidence in the project’s long-term fundamentals and current technical strength. If the breakout confirms with sustained volume, this could mark the start of a fresh bullish leg. Traders might find this a valuable setup for medium-term gains, especially as the wedge pattern completes and buying momentum accelerates.
✅ Show your support by hitting the like button and
✅ Leaving a comment below! (What is your opinion about this Coin?)
Your feedback and engagement keep me inspired to share more insightful market analysis with you!
$ORDIUSDT NEXT 100X MOVE???Alright, this one’s interesting… BINANCE:ORDIUSDT is setting up after a sharp move and pullback 🔥
After a strong impulsive rally, BINANCE:ORDIUSDT faced rejection from higher levels and is now pulling back into a key demand zone ($6.926 – $6.250).
This zone previously triggered a strong bounce — and now price is retesting it again, which is where smart money watches closely 👀
Trade Setup
Entry: $6.935
Target 1: $9.076
Target 2: $11.935
Stop Loss: $5.935
High RR setup — downside protected, upside wide open 📈
If buyers defend this area again… expect expansion ⚡
👀 Watch the reaction carefully — this move could expand fast either way.
ORDIUSDT Forming Falling WedgeORDIUSDT is forming a clear falling wedge pattern, a classic bullish reversal signal that often indicates an upcoming breakout. The price has been consolidating within a narrowing range, suggesting that selling pressure is weakening while buyers are beginning to regain control. With consistent volume confirming accumulation at lower levels, the setup hints at a potential bullish breakout soon. The projected move could lead to an impressive gain of around 140% to 150% once the price breaks above the wedge resistance.
This falling wedge pattern is typically seen at the end of downtrends or corrective phases, and it represents a potential shift in market sentiment from bearish to bullish. Traders closely watching ORDIUSDT are noting the strengthening momentum as it nears a breakout zone. The good trading volume adds confidence to this pattern, showing that market participants are positioning early in anticipation of a reversal.
Investors’ growing interest in ORDIUSDT reflects rising confidence in the project’s long-term fundamentals and current technical strength. If the breakout confirms with sustained volume, this could mark the start of a fresh bullish leg. Traders might find this a valuable setup for medium-term gains, especially as the wedge pattern completes and buying momentum accelerates.
✅ Show your support by hitting the like button and
✅ Leaving a comment below! (What is your opinion about this Coin?)
Your feedback and engagement keep me inspired to share more insightful market analysis with you!
Ordinals (ORDI) Beyond 7,000% PP New All-Time HighOrdinals (ORDI) can hit a new all-time high in late 2026 or Q1-Q2 2027. Growth can happen for years. Just as we had an extended bear market we can also have an extended bull market.
ORDIUSDT already grew once more than 3,000% in less than four months so it wouldn't be hard to see it grow more than 5,000% or even 7,000% in several years... Let me show you this chart.
First, the opportunity buy-zone is active. This is a price range between the September 2023 and March 2026 lows—highlighted green on the chart.
The September 2023 low launched a major 3,300%+ bullish cycle, the entire move unfolded in just 4 months. Wow! The same can repeat but better.
Strong growth always calls for a strong correction. A bull market is followed by a bear market.
ORDIUSDT went through a brutal bear market but this is over, it ended late last month. The bear market lasted two years, March 2024 through March 2026. The previous bull market lasted some six months. The meat of the move happened in four months. Notice the huge difference.
Now a new cycle is starting and a new all-time high is high probability long-term. It can happen in 2027 or 2028. Can happen sooner but I don't know. Right now all that is certain is that the bottom is in and growth is starting right away. After the bottom is gone, the best possible entry prices, it will be gone forever. The time to take action is now. Opportunities in this market are endless.
Thank you for reading.
Namaste.