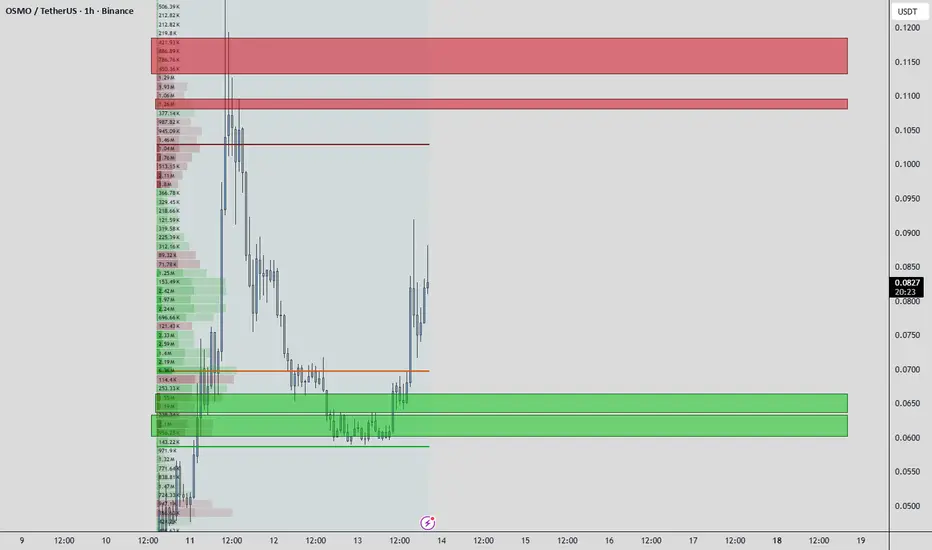
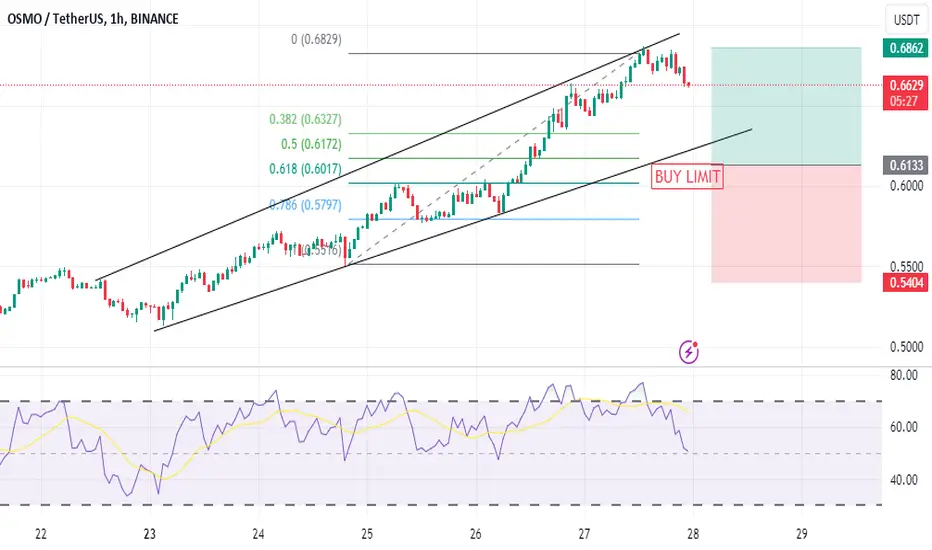
OSMO/USDT: +345% Macro Expansion SetupOsmosis ( CRYPTOCAP:OSMO ) is displaying strong macro accumulation characteristics as price action consolidates inside a rounding base structure above the **$0.040 – $0.045** primary demand block. Following seller volume exhaustion and steady DEX liquidity metrics across Cosmos ecosystems, market structure points toward heavy bottom-level absorption. A confirmed H4/Daily close above the primary breakout pivot clears dynamic overhead resistance, triggering a multi-leg rally toward macro supply ta
OSMO / TetherUS
No trades
No trades
In-depth trading ideas
OSMO — Major Breakout or Another Bearish Rejection?OSMO/USDT remains in a long-term bearish trend, characterized by a series of *lower highs* and *lower lows* since reaching its peak near $2.56 in early 2024.
The price has continued to trade beneath a dynamic resistance line known as the Descending Trendline, which has consistently pressured price action over the past several years.
Currently, OSMO is trading around $0.0525, with price action approaching an important area where the descending trendline may be tested again.
⚠️ Although a poten
$OSMO is finally waking upCRYPTOCAP:OSMO is finally waking up. 👀
Price just pushed into the $0.055 resistance zone with strong volume. If it breaks above $0.0565 and holds, I’m looking for a move toward $0.067, then $0.08 to $0.09.
The setup looks promising, but I want to see price hold the breakout instead of getting rejected back into the range. 📈
OSMO at macro floor: base recovery toward $0.0345The Macro Picture 🗺️
OSMO ground down from the $0.1286 macro ceiling all the way to the $0.0263 floor and has flattened onto it at $0.0267. The long, steady bleed has given way to a base right on support — exhaustion rather than continuation.
The Setup ⚙️
The Accumulation Zone 🟢
$0.0263–0.0267 is where the selling has dried up. The macro floor has held on retest, and this is the demand shelf a recovery would build from.
The Decision Point 🔴
$0.0352 (Local High) is the structural gate. Before
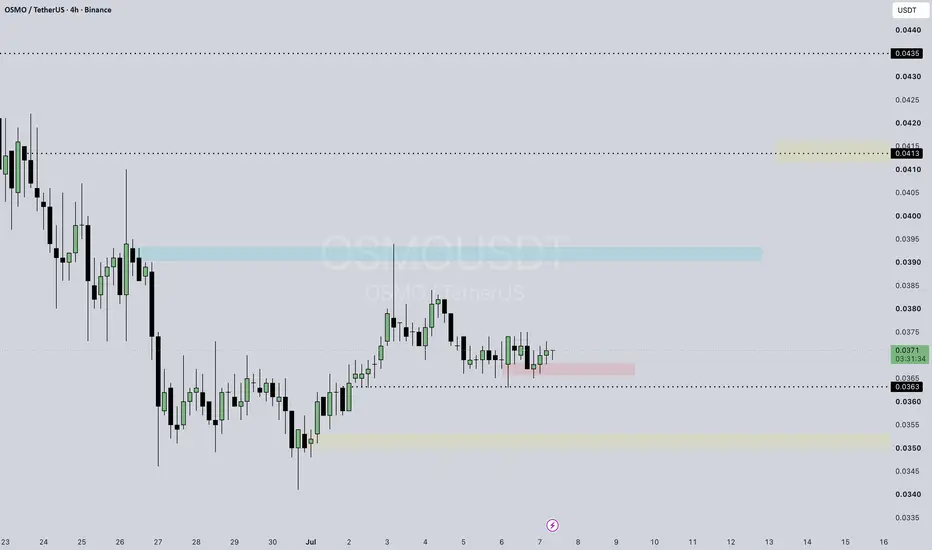
OSMOBINANCE:OSMOUSDT
**Analysis:** 📊
- Current price: **~0.0366 USDT** 🔍
- Resistance: **0.0370 – 0.0380** 🚧
- Major resistance: **0.0413 – 0.0420** ⛰️
- Support: **0.0363** 🛡️
- Major support: **0.0340 – 0.0330** ⚓
**Bounce Zone:** 🔁
- Price is sitting near support around **0.0363** 📍
- Bounce possible from current area if support holds ✅
Disclaimer: Not Financial Advice. Low Cap. ⚠️
OSMO: Institutional Re-Accumulation & Cosmos Ecosystem DynamicsMacro Regime
The current macroeconomic climate for the Cosmos ecosystem, and Osmosis (OSMO) in particular, is defined by the maturation of cross-chain interoperability protocols.
As of May 2026, market participants are rotating capital from monolithic blockchains into interoperable "AppChains." Osmosis remains the primary liquidity hub for the IBC (Inter-Blockchain Communication) network. Recent data shows a significant increase in protocol-owned liquidity and fee-sharing mechanisms, which ha
OSMO Cosmos Is Pumping AgainThe Cosmos ecosystem has a habit of creating some of the craziest pumps in crypto.
First comes:
explosive price action 🚀
massive hype 🔥
“new era” narratives 🌌
people calling for another 10x
We saw it with:
-Terra
-MANTRA
-and now maybe Osmosis
What makes this move interesting is that OSMO is rising with almost no major news, no huge announcements, and no strong media attention.
Sometimes the strongest pumps start exactly like this.
But Cosmos history also shows a repeating pattern:
parabo
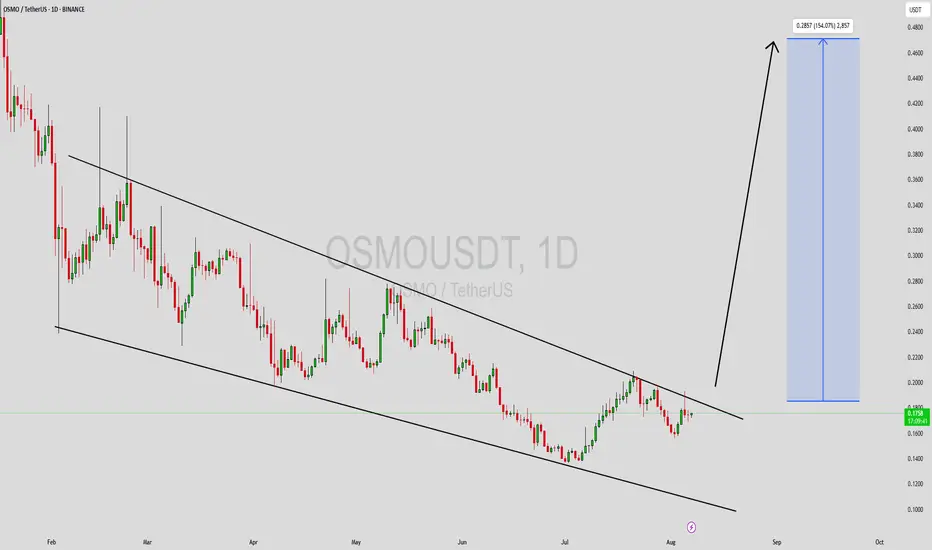
OSMOUSDT Forming Falling WedgeOSMOUSDT is showing a classic falling wedge pattern on the chart, which is widely considered a bullish reversal setup in technical analysis. This pattern often signals the end of a downtrend and the beginning of a potential breakout rally. With strong trading volume supporting the structure, OSMO has caught the attention of investors who are anticipating significant upside momentum in the coming sessions.
The falling wedge breakout scenario aligns well with current market dynamics, where OSMO h
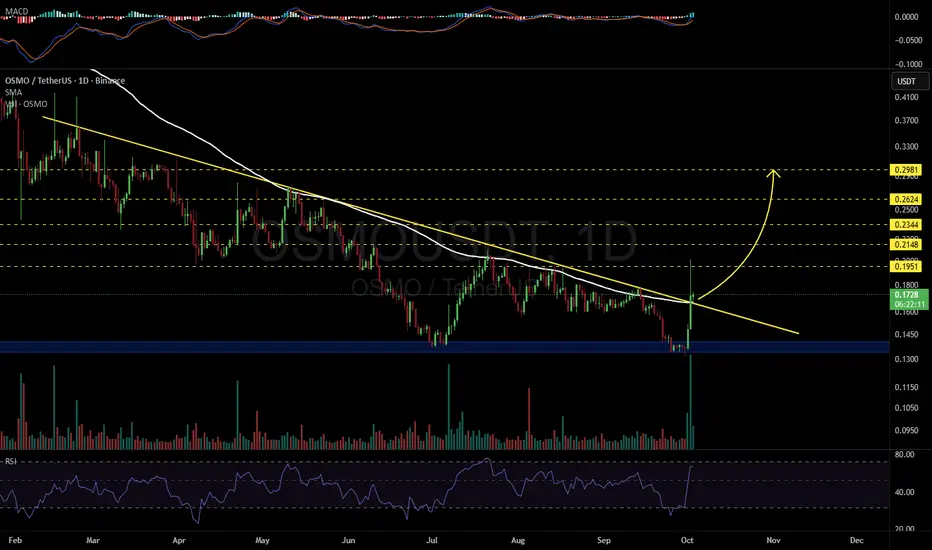
Is $OSMO Ready for a Rebound?After a long and painful downtrend, SEED_DONKEYDAN_MARKET_CAP:OSMO is finally showing signs of accumulation near key historical support at ~$0.135.
🟢 Technical Setup:
– Consolidation near macro support
– Clear range formation with strong reaction wicks
– Upside target: $0.47+ (≈277% from current levels)
📌 Why OSMO deserves attention:
– Deflationary model: the team regularly burns tokens, reducing total supply
– Core utility in Cosmos: Every transaction within the Cosmos ecosystem routes thro
OSMOUSDT Forming Falling WedgeOSMOUSDT is currently displaying a well-formed falling wedge pattern, a classic bullish reversal signal that often precedes strong upward momentum. This pattern is characterized by a narrowing price range, which reflects decreasing selling pressure and a potential shift in market sentiment. As the wedge tightens, a breakout becomes increasingly likely—especially when accompanied by growing volume and investor interest as seen in the recent OSMOUSDT price action.
The falling wedge setup on OSMOU
OSMO/USDT 1W🌱 SEED_DONKEYDAN_MARKET_CAP:OSMO ⁀➷
#Osmosis. Macro chart Another
🌴 Intermediate Target - $2.80
🍃 Macro Target 1 - $4.93
🍃 Macro Target 2 - $10.50
🍃 Macro Target 3 - $20.54
- Not financial advice, trade with caution.
#Crypto #Osmosis #OSMO #Investment
✅ Stay updated on market news and developments that may influence the price of Osmosis. Positive or negative news can significantly impact the cryptocurrency's value.
✅ Exercise patience and discipline when executing your trading plan. Avo
$OSMO just broke out SEED_DONKEYDAN_MARKET_CAP:OSMO just broke out! 🚀
Falling wedge breakout confirmed on the daily chart with strong volume.
The Price is now above the key resistance 50ema.
Target: $0.5671 (+230%)
Momentum is building — this could be the start of something big!
OLong
OSMOUSDT Trade Setup (92% Long Probability Printed on the Chart)Market Structure
The probability algorithm has printed 92% Long Probability the Chart coupled with RSI and trend breakout.
Price has been moving in a downward channel, indicating a longer‑term downtrend. However, there may be signs of a potential base forming near the lower boundary of the channel.
The recent price action around the 0.30–0.31 region could be an attempt to stabilize or stage a bounce.
Entry
Entry at CMP: Enter a long position around the current market price (near 0.30).
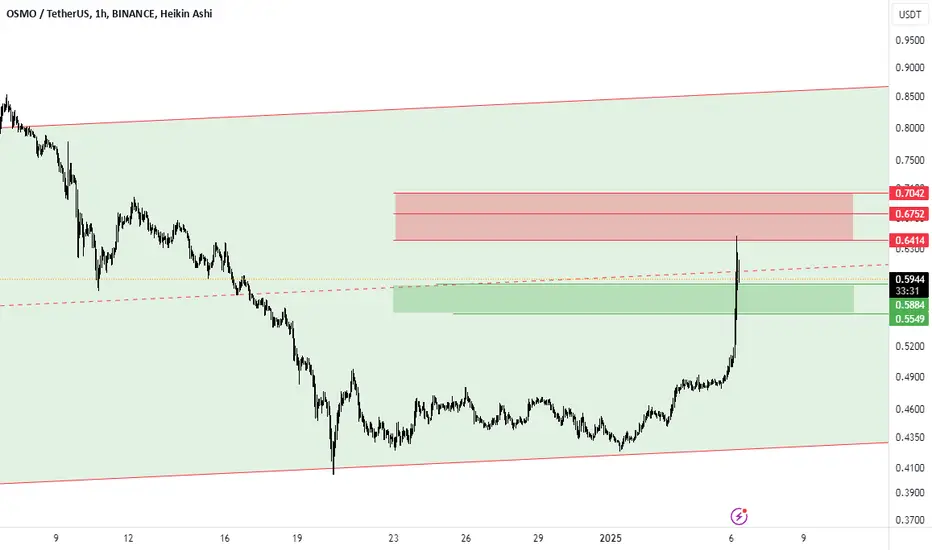
osmoGiven that it has reacted to the midline of the channel, if it can maintain the green box in the short term, it can play between the green and red boxes until a breakout occurs. A breakout from the red box can lead to the channel ceiling, and a breakout from the green box can lead to the channel floor.
OSMOUSDT - ANALYSISHello friends, I want to share my opinion on the OSMO cryptocurrency with you.
My expectation for this cryptocurrency is that it will start its upward trend soon. The reason for this is the failure of EMA200 on the daily time frame.
And my first target for it is 1.3450 .
Trade safe
Osmo | Two ScenariosWe had previously engaged with the Osmosis and experienced tremendous success, exceeding 350%. However, currently, the chart appears indecipherable, impeding our ability to determine a clear direction.
The coin has not exhibited significant movement amidst recent strong Bitcoin increases, and it has remained unaffected during correction periods, casting doubt on the presence of buying power or even selling interest, especially with many network users recently stacking.
Technically, upon exa
potential upward price movement after a period of consolidation.### Trade Advice for Cup and Handle Pattern
A bullish continuation pattern that indicates a In this analysis, we will identify entry points, stop-loss levels, and target prices based on the chart provided.
Key Levels
Cup Bottom:$0.3464
Handle Resistance: $0.4053
Target Price:$0.5931
Enter a long position around the breakout level at $0.4053 or slightly above to confirm the breakout.
Set a stop-loss just below the handle at $0.3800.
Trading Advice: Cup and Handle Pattern for OSMO Be ready to enter! Watch the price breakout above the handle resistance, this is the right time to enter the deal.
Protect your investment! Place the stop loss below the lowest point in the handle to minimise risk.
Be ready to enter Watch the price break above the handle resistance, this is the right time to enter the deal.
Place the stop loss below the lowest point in the handle to minimise risk.
With a target price of $0.59 calculate potential profits based on your entry price. Use the h
Osmo big move inshallah#OSMO is setting up for a significant breakout forming a hand and cup pattern, indicating a potential move of 92.5%.
Currently trading at $0.40, this setup has a target of $0.77 at the top of the hand and cup. This presents an excellent opportunity to capitalize on this upward momentum! Don't miss out on this exciting potential!