OSMOBINANCE:OSMOUSDT
**Analysis:** 📊
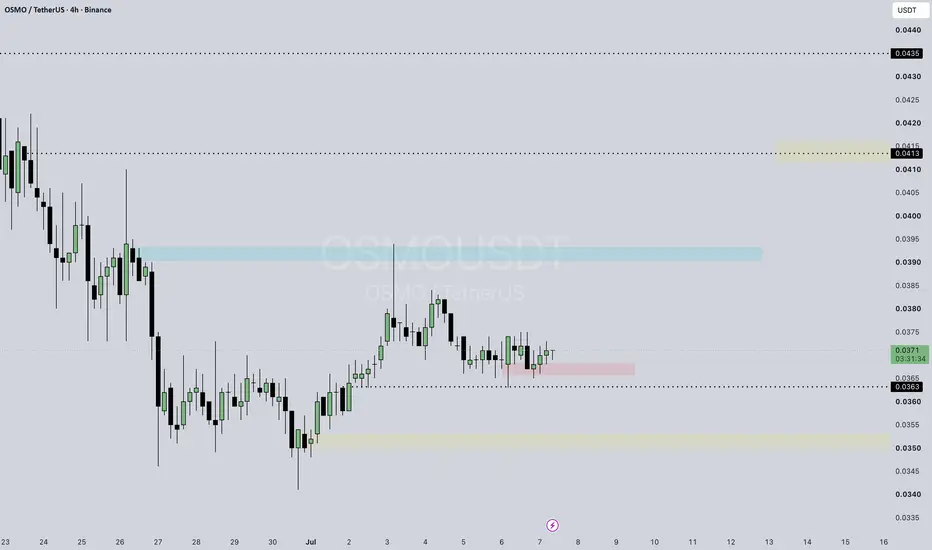
- Current price: **~0.0366 USDT** 🔍
- Resistance: **0.0370 – 0.0380** 🚧
- Major resistance: **0.0413 – 0.0420** ⛰️
- Support: **0.0363** 🛡️
- Major support: **0.0340 – 0.0330** ⚓
**Bounce Zone:** 🔁
- Price is sitting near support around **0.0363** 📍
- Bounce possible from current area if support holds ✅
Disclaimer: Not Financial Advice. Low Cap. ⚠️
In-depth trading ideas
OSMO: Institutional Re-Accumulation & Cosmos Ecosystem DynamicsMacro Regime
The current macroeconomic climate for the Cosmos ecosystem, and Osmosis (OSMO) in particular, is defined by the maturation of cross-chain interoperability protocols.
As of May 2026, market participants are rotating capital from monolithic blockchains into interoperable "AppChains." Osmosis remains the primary liquidity hub for the IBC (Inter-Blockchain Communication) network. Recent data shows a significant increase in protocol-owned liquidity and fee-sharing mechanisms, which has begun to attract institutional yield-seekers. In a broader market context, as Bitcoin dominance stabilizes, high-utility DeFi protocols like OSMO often benefit from "liquidity trickling down" the risk curve.
Concept Explanation: An "AppChain" is a blockchain dedicated to a single application (like a specialized exchange). "Liquidity trickling down" means that after investors make money in big assets like Bitcoin, they move that profit into smaller, higher-growth projects.
Liquidity Conditions
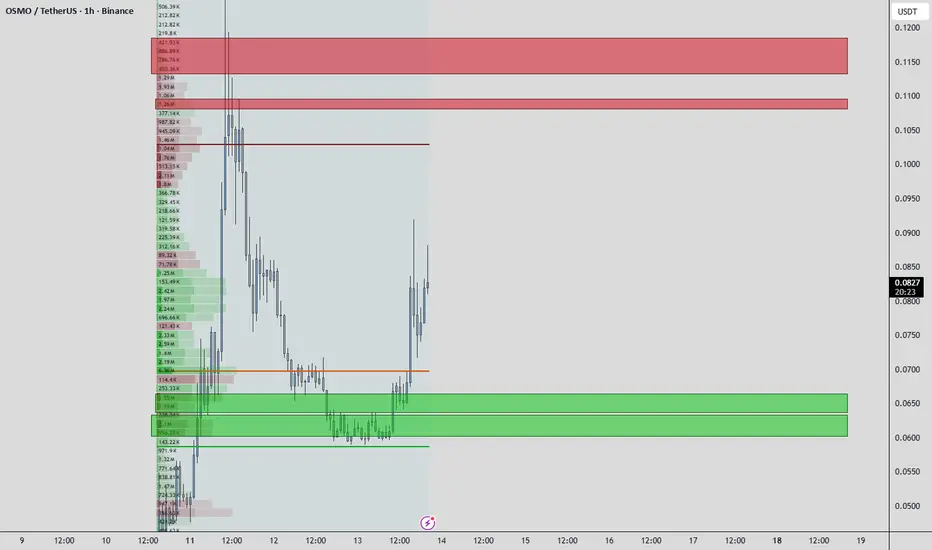
Analysis of chart reveals two distinct institutional interest zones:
The Green Demand Zone : This is a high-conviction re-accumulation area. The volume profile shows significant "Passive Absorption" here, where large participants utilized limit orders to catch the previous sell-off.
The Red Supply Overhang : These zones represent "Unfilled Institutional Sell Orders." Because the price dropped rapidly from here previously, many large sell orders remain waiting for a revisit.
Concept Explanation: "Passive Absorption" is when big players act like a "sponge," buying everything that panicked sellers throw at them without letting the price drop further. A "Supply Overhang" is an area where a lot of people are waiting to sell their tokens because they missed the chance during the last drop.
Market Structure
OSMO is currently transitioning from a "Distribution Phase" into a "Markup Phase." The price successfully defended the High Volume Node (HVN) near $0.0700 (indicated by the orange line). This level acted as the Point of Control (POC), the fair value price where most trading occurred. The recent impulsive bounce from the green boxes suggests that "Smart Money" has finished accumulating and is now ready to challenge the upper liquidity targets.
Concept Explanation: The "Point of Control" (POC) is the price level where the most trading activity happened. It acts like a magnet for the price. A "Markup Phase" is the stage of the market cycle where the price starts a sustained move upward.
Order Flow / Footprint Behavior
To confirm a continuation toward the $0.1100 red zone, we are monitoring for two specific footprint signatures:
Cumulative Delta Divergence: We want to see the price rising even if the "Delta" (the difference between market buys and sells) stays flat. This indicates that sellers are exhausted and buyers don't need to be aggressive to move the price.
Buyers with Result: As price approaches the POC ($0.0700) and the mid-range resistance, we look for "Stacked Buy Imbalances",multiple levels of aggressive market buying that successfully push the price higher.
Concept Explanation: "Cumulative Delta" tracks whether more people are clicking "Buy" or "Sell" at the market price. "Stacked Imbalances" happen when buyers are so aggressive that they overwhelm sellers at several price levels in a row, signaling strong institutional intent.
Correlated Assets
The primary intermarket relationship for OSMO is with ATOM (Cosmos Hub) and BTC. Currently, OSMO is showing "Relative Strength" against ATOM. This suggests that ecosystem-specific capital is flowing directly into the DEX token rather than the general hub token. If BTC remains in a "sideways" consolidation, it provides the perfect low-volatility environment for OSMO to expand toward its red supply zones.
Risk Sentiment
Sentiment is shifting from "Fear" to "Calculated Optimism." The successful defense of the $0.0600 level has provided a psychological floor for retail participants, while the institutional footprint shows a preference for holding (HODLing) rather than day-trading. This reduces the "sell pressure" on every minor bounce.
Institutional Interpretation
Institutional desks view the current price action as a "Re-Test of Value." Having established a floor at the green liquidity zone, they are likely aiming to "sweep" the liquidity sitting above the $0.1200 highs. The goal of large players here is to "induce" retail shorts at the POC, only to use those shorts as "buy liquidity" for a further squeeze higher.
Concept Explanation: A "Short Squeeze" happens when people betting against the price (shorts) are forced to buy back their positions to stop their losses, which ironically pushes the price up even faster.
Key Invalidation Levels
The Bullish Thesis Invalidation: A 4-hour close below the green box ($0.0600). This would indicate that the "Passive Bids" have been overwhelmed and that a "Liquidity Void" exists below, potentially leading to a move back toward $0.0400.
Concept Explanation: "Invalidation" is the specific price point where our plan is proven wrong. If price goes there, the "Big Players" have changed their minds and we should exit the trade.
Upcoming Macro Catalysts
Keep an eye on the upcoming Cosmos ecosystem governance upgrades and the "Staking Rewards" adjustments. Any increase in the "Real Yield" for OSMO stakers will act as the fundamental fuel required to break through the $0.1100 red resistance zone.
Conclusion
OSMO is at a textbook institutional pivot point. After a successful defense of the green demand zone, the market is now testing the strength of the POC. The structural path of least resistance is toward the red supply zones at $0.1100+. We are waiting for footprint confirmation of "Buyers with Result" at the current levels to solidify the move. Manage risk at the $0.0600 level and watch for the liquidity grab at the highs.
OSMO Cosmos Is Pumping AgainThe Cosmos ecosystem has a habit of creating some of the craziest pumps in crypto.
First comes:
explosive price action 🚀
massive hype 🔥
“new era” narratives 🌌
people calling for another 10x
We saw it with:
-Terra
-MANTRA
-and now maybe Osmosis
What makes this move interesting is that OSMO is rising with almost no major news, no huge announcements, and no strong media attention.
Sometimes the strongest pumps start exactly like this.
But Cosmos history also shows a repeating pattern:
parabolic rally → market euphoria → brutal dump.
Right now OSMO has one of the strongest charts in the altcoin market 📈
Momentum is clearly there.
The real question is:
Is this the beginning of a new Cosmos cycle…
or just another liquidity trap before the next collapse? 🩸
Watching closely. 👀
⚠️ Disclaimer: This post is for educational and entertainment purposes only and is not financial advice. Always do your own research before investing in cryptocurrencies.
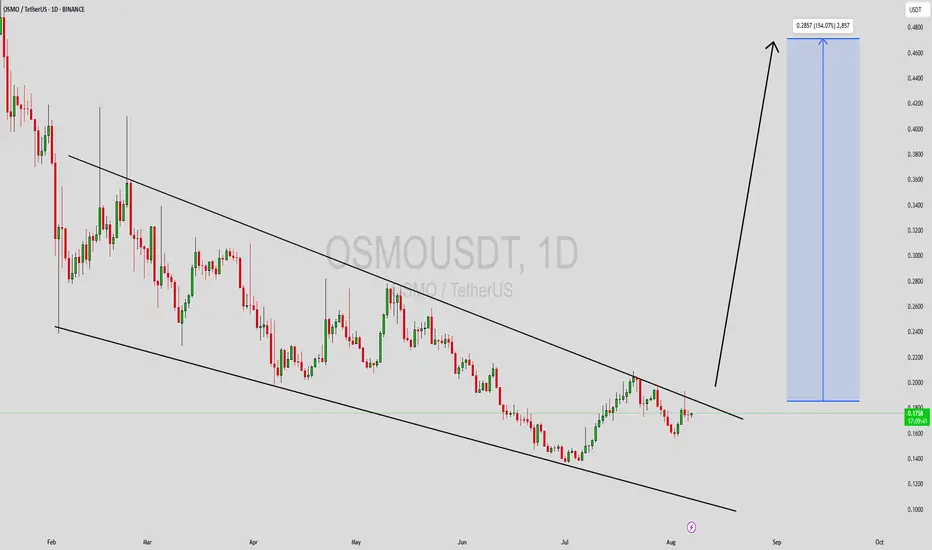
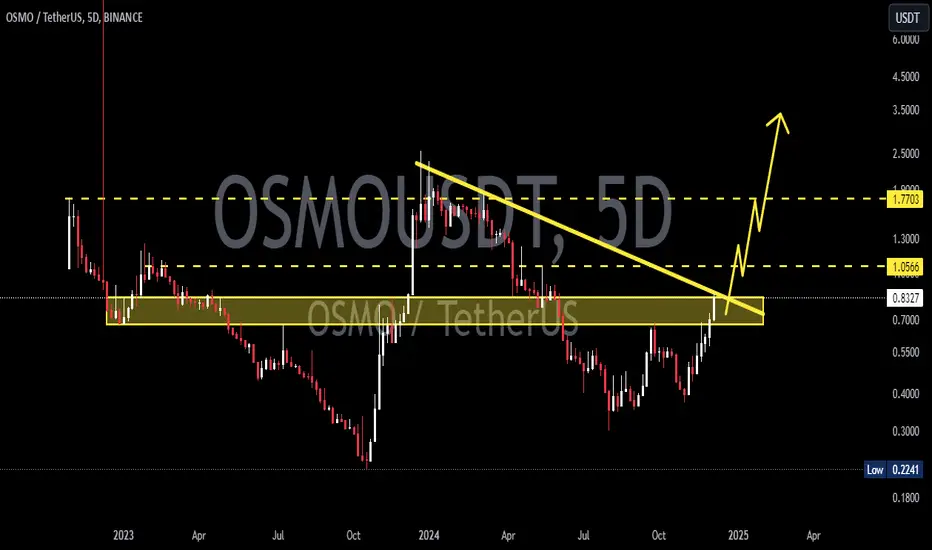
OSMOUSDT Forming Falling WedgeOSMOUSDT is showing a classic falling wedge pattern on the chart, which is widely considered a bullish reversal setup in technical analysis. This pattern often signals the end of a downtrend and the beginning of a potential breakout rally. With strong trading volume supporting the structure, OSMO has caught the attention of investors who are anticipating significant upside momentum in the coming sessions.
The falling wedge breakout scenario aligns well with current market dynamics, where OSMO has been consolidating at lower levels and building buying pressure. A confirmed breakout from this wedge could trigger a strong move to the upside, with expectations pointing toward a gain of 90% to 100%+. This makes OSMOUSDT an attractive pair for traders looking for high-reward opportunities.
Investor interest in OSMO is steadily growing, adding fuel to the bullish outlook. If the current volume levels sustain, the price action could accelerate quickly, targeting higher resistance zones with strong momentum. The key factor will be whether the breakout can hold above its support levels and attract further institutional and retail participation.
✅ Show your support by hitting the like button and
✅ Leaving a comment below! (What is You opinion about this Coin)
Your feedback and engagement keep me inspired to share more insightful market analysis with you!
Is $OSMO Ready for a Rebound?After a long and painful downtrend, SEED_DONKEYDAN_MARKET_CAP:OSMO is finally showing signs of accumulation near key historical support at ~$0.135.
🟢 Technical Setup:
– Consolidation near macro support
– Clear range formation with strong reaction wicks
– Upside target: $0.47+ (≈277% from current levels)
📌 Why OSMO deserves attention:
– Deflationary model: the team regularly burns tokens, reducing total supply
– Core utility in Cosmos: Every transaction within the Cosmos ecosystem routes through OSMO, giving it massive transactional relevance
– As more chains join Cosmos IBC, OSMO’s on-chain activity increases naturally
💡 Sentiment is still quiet, but that’s when smart money positions. If volume steps in and $0.20–$0.22 range gets cleared, this could move fast.
Not financial advice — just a setup worth watching.
OSMOUSDT Forming Falling WedgeOSMOUSDT is currently displaying a well-formed falling wedge pattern, a classic bullish reversal signal that often precedes strong upward momentum. This pattern is characterized by a narrowing price range, which reflects decreasing selling pressure and a potential shift in market sentiment. As the wedge tightens, a breakout becomes increasingly likely—especially when accompanied by growing volume and investor interest as seen in the recent OSMOUSDT price action.
The falling wedge setup on OSMOUSDT is further supported by a notable uptick in volume, signaling that accumulation may be underway. Historically, falling wedges break to the upside with strong momentum, often leading to rapid price expansion. In this case, the projected upside move is estimated to be in the range of 140% to 150% from current levels. This makes OSMO one of the more attractive breakout candidates in the mid-cap altcoin space, especially for traders seeking high-reward setups.
The overall market sentiment around Osmosis has also been increasingly positive, with more eyes turning toward decentralized finance projects and blockchain infrastructure plays. OSMO, being a core player in the Cosmos ecosystem, is well-positioned for strong speculative interest, particularly as its technicals align with favorable chart patterns and renewed on-chain activity.
For those tracking breakout patterns and looking to capitalize on explosive moves, OSMOUSDT offers a technically sound and timely opportunity worth serious consideration.
✅ Show your support by hitting the like button and
✅ Leaving a comment below! (What is You opinion about this Coin)
Your feedback and engagement keep me inspired to share more insightful market analysis with you!
OSMO/USDT 1W🌱 SEED_DONKEYDAN_MARKET_CAP:OSMO ⁀➷
#Osmosis. Macro chart Another
🌴 Intermediate Target - $2.80
🍃 Macro Target 1 - $4.93
🍃 Macro Target 2 - $10.50
🍃 Macro Target 3 - $20.54
- Not financial advice, trade with caution.
#Crypto #Osmosis #OSMO #Investment
✅ Stay updated on market news and developments that may influence the price of Osmosis. Positive or negative news can significantly impact the cryptocurrency's value.
✅ Exercise patience and discipline when executing your trading plan. Avoid making impulsive decisions driven by emotions, and adhere to your strategy even during periods of market volatility.
✅ Remember that trading always involves risk, and there are no guarantees of profit. Conduct thorough research, analyze market conditions, and be prepared for various scenarios. Trade only with funds you can afford to lose and avoid excessive risk-taking.
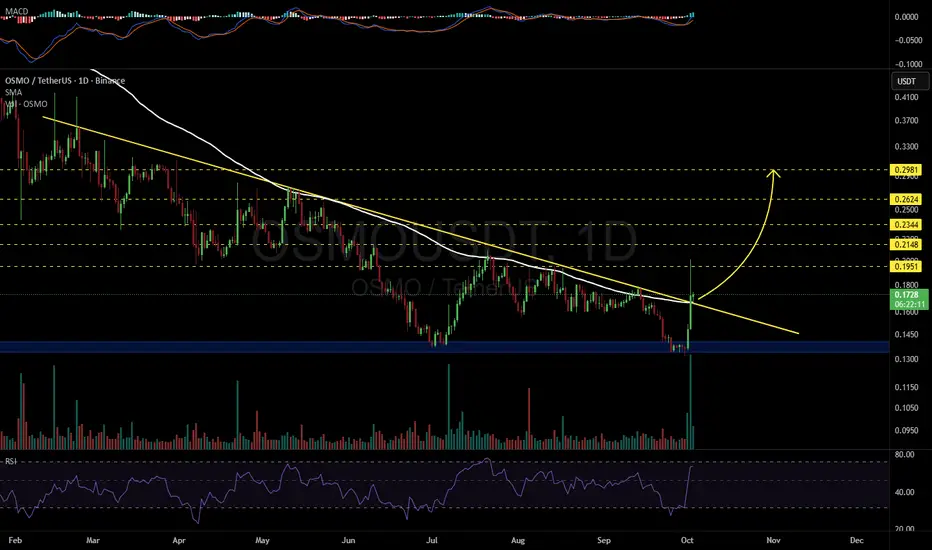
$OSMO just broke out SEED_DONKEYDAN_MARKET_CAP:OSMO just broke out! 🚀
Falling wedge breakout confirmed on the daily chart with strong volume.
The Price is now above the key resistance 50ema.
Target: $0.5671 (+230%)
Momentum is building — this could be the start of something big!
OLong
OSMOUSDT Trade Setup (92% Long Probability Printed on the Chart)Market Structure
The probability algorithm has printed 92% Long Probability the Chart coupled with RSI and trend breakout.
Price has been moving in a downward channel, indicating a longer‑term downtrend. However, there may be signs of a potential base forming near the lower boundary of the channel.
The recent price action around the 0.30–0.31 region could be an attempt to stabilize or stage a bounce.
Entry
Entry at CMP: Enter a long position around the current market price (near 0.30).
Stop Loss
Place your stop loss below the recent swing low or below the lower boundary of the channel to protect against a false breakout or further downside.
For instance, a stop loss around 0.26–0.27 provides a buffer below the local lows. Adjust slightly based on your risk tolerance.
Take Profit Targets
Because the market has been trending downward, it’s wise to scale out of the position at multiple targets. This way, you can lock in gains if the bounce remains limited, while still benefiting if the trend truly reverses.
Target 1: 0.34–0.35 (near the midline of the descending channel or a prior support/resistance zone).
Target 2: 0.38–0.40 (a stronger resistance area from earlier consolidation).
Target 3: 0.45+ (if price shows significant strength and breaks above the upper channel boundary).
Trade Management
Position Sizing: Use a position size that keeps your account risk manageable—many traders risk no more than 1–2% of their capital on a single trade.
Adjusting the Stop: If price moves favorably and breaks above short‑term resistance, consider moving your stop loss to breakeven or just below a new higher low.
Partial Profit‑Taking: Take partial profits at each target level and move your stop loss to secure gains.
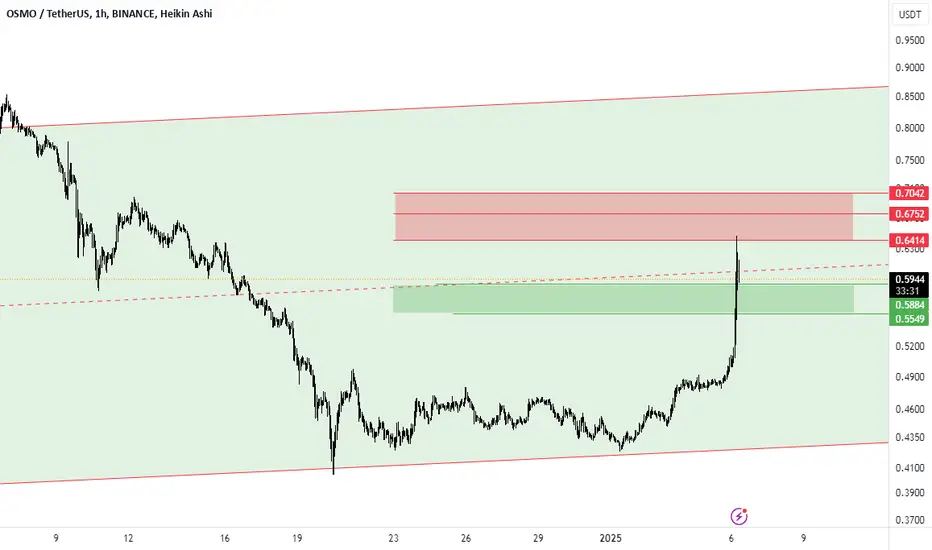
osmoGiven that it has reacted to the midline of the channel, if it can maintain the green box in the short term, it can play between the green and red boxes until a breakout occurs. A breakout from the red box can lead to the channel ceiling, and a breakout from the green box can lead to the channel floor.
OSMOUSDT - ANALYSISHello friends, I want to share my opinion on the OSMO cryptocurrency with you.
My expectation for this cryptocurrency is that it will start its upward trend soon. The reason for this is the failure of EMA200 on the daily time frame.
And my first target for it is 1.3450 .
Trade safe
Osmo | Two ScenariosWe had previously engaged with the Osmosis and experienced tremendous success, exceeding 350%. However, currently, the chart appears indecipherable, impeding our ability to determine a clear direction.
The coin has not exhibited significant movement amidst recent strong Bitcoin increases, and it has remained unaffected during correction periods, casting doubt on the presence of buying power or even selling interest, especially with many network users recently stacking.
Technically, upon examining the daily chart, we observe what resembles a bearish flag, although it seems like a fake-out.
We could consider entering a trade based on this analysis, discounting slightly from the current price, while maintaining an undisputed stop-loss.
Looking at the two-day chart, the situation worsens with a semi-confirmed bearish pennant, indicating a strong downward movement, at least towards previous strong accumulation zones.
Personally, I prefer to wait for confirmation or for a strong corrective candle before jumping in.
In the event of another descent to the indicated accumulation zones on the chart, I don't believe we should miss this opportunity again.
Best of luck.
potential upward price movement after a period of consolidation.### Trade Advice for Cup and Handle Pattern
A bullish continuation pattern that indicates a In this analysis, we will identify entry points, stop-loss levels, and target prices based on the chart provided.
Key Levels
Cup Bottom:$0.3464
Handle Resistance: $0.4053
Target Price:$0.5931
Enter a long position around the breakout level at $0.4053 or slightly above to confirm the breakout.
Set a stop-loss just below the handle at $0.3800.
Trading Advice: Cup and Handle Pattern for OSMO Be ready to enter! Watch the price breakout above the handle resistance, this is the right time to enter the deal.
Protect your investment! Place the stop loss below the lowest point in the handle to minimise risk.
Be ready to enter Watch the price break above the handle resistance, this is the right time to enter the deal.
Place the stop loss below the lowest point in the handle to minimise risk.
With a target price of $0.59 calculate potential profits based on your entry price. Use the height of the cup to select the target.
Make sure there is an increase in trading volume when breaking out, this indicates the strength of momentum.
Follow the general direction of the market. An uptrend can enhance your trading chances of success.
Be careful in the use of capital. Be careful not to risk more than a small percentage to ensure the continuation of the game.
We wish you a successful trade and abundant profits
Osmo big move inshallah#OSMO is setting up for a significant breakout forming a hand and cup pattern, indicating a potential move of 92.5%.
Currently trading at $0.40, this setup has a target of $0.77 at the top of the hand and cup. This presents an excellent opportunity to capitalize on this upward momentum! Don't miss out on this exciting potential!
$OSMO We are so back innit again where R:R for most of the alts is so excellent. Slowly Scale in and comeback by start of Q4!
Reward/Risk is so good you dont have to fade away.
Things to remind you is bid on tokens with good funding, good team & innovating tech.
Osmo had a good run since TIA incubation (hype died) still there is a reason behind it.
(Osmosis is a decentralized cryptocurrency exchange (DEX) built on the Cosmos network. It allows users to trade a variety of digital assets, access liquidity from over 100 ecosystems, and leverage features like margin trading and liquid staking. Osmosis offers capital-efficient liquidity pools, a user-friendly interface, and a strong community governance model. It aims to be a central hub for DeFi applications and cross-chain transactions, making it a significant player in the multichain future of decentralized finance.)