Tokyo Electron - Value Accepted Above VT.Price has closed above the Value Triangle (VT), confirming acceptance. Structure remains valid above the red Boundary Line (BL), with prior VT behaviour supporting continuation.
T1 projected from VT; exit on a close below BL.
Sector context:
Semiconductor sector remains supportive, with AI-driven d
Tokyo Electron Ltd.
No trades
No trades
Compare with Tokyo Electron Ltd.
4.14 USD
3.81 B USD
16.22 B USD
Next report date
—
Report period
—
EPS estimate
—
Revenue estimate
—
Details
Sector
Industry
CEO
Toshiki Kawai
Website
Headquarters
Tokyo
Founded
1951
IPO date
Jun 2, 1980
ISIN
US8891101029
CUSIP
889110102
FIGI
BBG000JXJRY9
Identifiers
ISIN US8891101029
Tokyo Electron Ltd. engages in the development, manufacture, and sale of semiconductor production equipment and industrial electronics products for flat panel display manufacturing equipment. It operates through the Semiconductor Production Equipment (SPE) segment. SPE handles the development, manufacture, service, and distribution of coaters/developers, plasma etch systems, thermal processing systems, single wafer deposition systems, cleaning systems, wafer probers, and other semiconductor production equipment. The company was founded on November 11, 1963 and is headquartered in Tokyo, Japan.
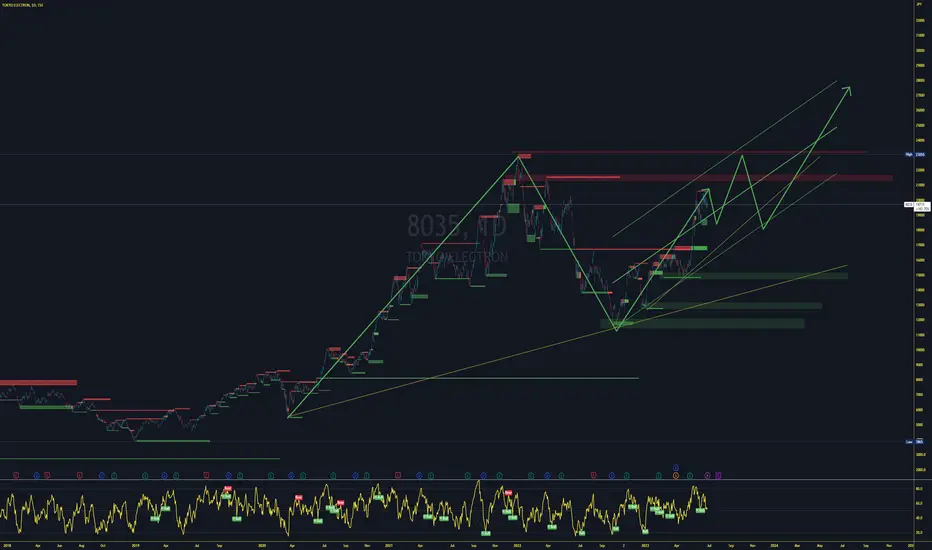
Taking the first bite for potential reversal rallyTSE:8035 is looking at a potential reversal to the upside after elliott wave structure suggest that there is an end to the corrective wave structure. As such, we are looking at a potential reversal. Furthermore, the potential inverted head and shoulder is looking at a potential reversal. While the
Tokyo Electron Stock Chart Fibonacci Analysis 042825Trading Idea
1) Find a FIBO slingshot
2) Check FIBO 61.80% level
3) Entry Point > 21,510/61.80%
Chart time frame:D
A) 15 min(1W-3M)
B) 1 hr(3M-6M)
C) 4 hr(6M-1year)
D) 1 day(1-3years)
Stock progress: B
A) Keep rising over 61.80% resistance
B) 61.80% resistance
C) 61.80% support
D) Hit the botto
Tokyo Electron (TYO: 8035) Slumps on US-China Trade War Fears Tokyo Electron (TYO: 8035) shares experienced a significant decline exceeding 7% on Wednesday following reports suggesting the US administration is considering imposing stricter trade restrictions on China, potentially limiting access to advanced semiconductor technology.
Fundamental Analysis:
TEL 8035 TOKYO ELECTRON LongAll TEL Group Companies in Japan Achieve a rate of 100% renewable energy usage
Tokyo Electron
announced that all TEL Group companies in Japan*1 achieved a rate of 100% renewable energy usage at plants and offices*2 in fiscal year 2023*3 as a result of its drive to use renewable energy (electricity)
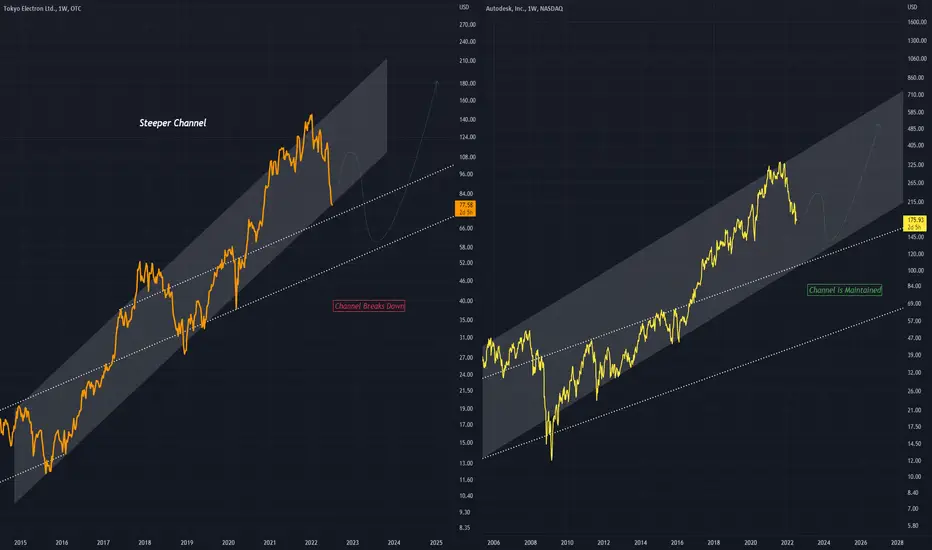
Comparing Ascending ChannelsOn the left shows an Ascending Channel which is common between the two
However the left Channel (TOELY) is quite a bit steeper (on a greater angle) compared to the right ( ADSK )
This 'Steepness' may affect the channels strength which I have shown on the left as a breakdown to a lower support line
TOELY looking comfortable at new ATHTOELY has performed on-par with the rest of the sector throughout the Covid era, despite its OTC status and comparative obscurity for ordinary traders (70B mkt cap vs ASML, AMAT etc). Another new ATH reached just before earnings, and a rosy outlook ahead. Rising support levels still accelerating, pr
See all ideas
Summarizing what the indicators are suggesting.
Neutral
SellBuy
Strong sellStrong buy
Strong sellSellNeutralBuyStrong buy
Neutral
SellBuy
Strong sellStrong buy
Strong sellSellNeutralBuyStrong buy
Neutral
SellBuy
Strong sellStrong buy
Strong sellSellNeutralBuyStrong buy
An aggregate view of professional's ratings.
Neutral
SellBuy
Strong sellStrong buy
Strong sellSellNeutralBuyStrong buy
Neutral
SellBuy
Strong sellStrong buy
Strong sellSellNeutralBuyStrong buy
Neutral
SellBuy
Strong sellStrong buy
Strong sellSellNeutralBuyStrong buy
Displays a symbol's price movements over previous years to identify recurring trends.
Weight0.46%
Market value5.09 M
Weight0.16%
Market value4.79 M
Weight1.77%
Market value3.76 M
Weight0.93%
Market value1.79 M
Weight2.87%
Market value859.95 K
Weight0.30%
Market value717.19 K
Weight2.25%
Market value495.31 K
Weight1.21%
Market value386.15 K
Weight0.42%
Market value68.85 K
Explore more ETFs