PARTIUSDT: Bears Stay in Control – More Downside Ahead?PARTIUSDT remains in a clear short-term downtrend after rejecting higher prices. As long as the price stays below 0.03048, the bearish momentum remains intact.
A continuation below the current support could push the price toward 0.02890, making this the next key downside target.
Trade Setup
Entry: 0.03016
Target: 0.02890
Stop Loss: 0.03048
I'll be watching for continued selling pressure and increasing volume to confirm the move. A break above the stop-loss level would invalidate the bearish setup.
This is my personal analysis, not financial advice.
In-depth trading ideas
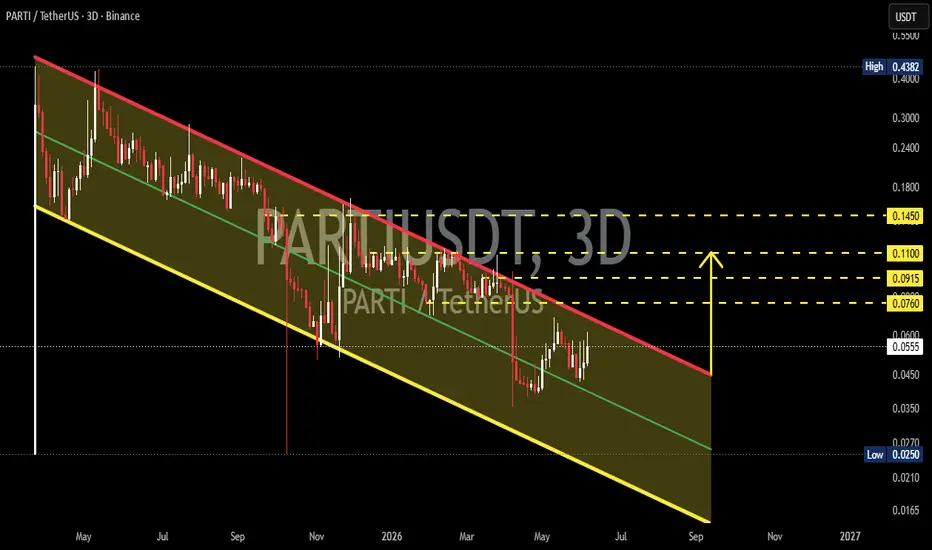
PARTIUSDT - Descending Channel, Massive Recovery Ahead?PARTI/USDT on the 3-Day (3D) timeframe remains trapped inside a well-defined Descending Channel that has been developing since its previous major peak. This structure reflects a medium-term downtrend that is still technically valid, but price is now approaching a critical decision zone that could determine the next major move.
Currently trading around the 0.05 USDT region, the asset has started showing signs of recovery from channel support. As price approaches the apex of the channel, the probability of a significant impulsive move increases, either through a bullish breakout or a bearish continuation.
---
📉 Pattern Formation: Descending Channel
A Descending Channel is a chart pattern formed when price moves between two parallel downward-sloping trendlines.
🔍 Characteristics Visible on the Chart:
✅ Descending resistance trendline (red) remains the primary barrier.
✅ Lower channel support (yellow) continues to hold selling pressure.
✅ Multiple rebounds have occurred from the lower boundary of the channel.
✅ Price is currently advancing toward the channel resistance, which will likely determine the next major direction.
From a technical perspective, a Descending Channel often represents an accumulation phase within a larger trend if a strong breakout to the upside occurs.
---
🎯 Key Price Levels
🔺 Resistance Levels:
📍 0.0760 USDT
📍 0.0915 USDT
📍 0.1100 USDT
📍 0.1450 USDT
🔻 Support Levels:
📍 0.0450 USDT
📍 Mid-channel support zone
📍 Major channel support near 0.0250 USDT
---
🟢 Bullish Scenario
✅ Bullish Confirmation:
If price successfully breaks above the Descending Channel resistance and secures a strong close above the trendline, the prolonged bearish structure may finally come to an end.
🎯 Potential Upside Targets:
🥇 Target 1 → 0.0760 USDT
🥈 Target 2 → 0.0915 USDT
🥉 Target 3 → 0.1100 USDT
🏆 Target 4 → 0.1450 USDT
A breakout from the channel could trigger:
🚀 Short covering
🚀 Increased buying pressure
🚀 FOMO-driven momentum
🚀 Market structure shift from bearish to bullish
The stronger the breakout volume, the higher the probability of reaching these projected targets.
---
🔴 Bearish Scenario
⚠️ Bearish Confirmation:
If price faces another rejection at channel resistance and fails to break out, the prevailing downtrend will likely remain intact.
🎯 Potential Downside Targets:
📉 Return to the mid-channel support zone
📉 Retest of the lower channel boundary
📉 Potential decline toward 0.0250 USDT if selling pressure intensifies
A breakdown below channel support would be a strong bearish signal and could open the door for a new lower low formation.
---
👀 What Traders Should Watch
🟢 Bullish Signals
✅ Breakout above channel resistance
✅ 3D candle close above the red trendline
✅ Significant increase in trading volume
✅ Formation of a new higher high
🔴 Bearish Signals
❌ Strong rejection from channel resistance
❌ Weakening buying volume
❌ Breakdown below channel support
❌ Formation of a new lower low
---
📌 Conclusion
PARTIUSDT is currently approaching one of the most important technical zones on the chart, the upper resistance of its long-term Descending Channel. The current structure reflects a compression phase, which often precedes a major directional move.
As long as price remains inside the channel, the bearish trend cannot be considered fully invalidated. However, if a confirmed breakout occurs, the path toward 0.0760 – 0.1450 USDT could become increasingly achievable.
The channel resistance remains the most critical area to monitor, as it will likely determine PARTI's direction for the coming weeks and potentially months.
#PARTI #PARTIUSDT #Binance #Crypto #Cryptocurrency #Altcoin #Trading #TechnicalAnalysis #TradingView #PriceAction #ChartAnalysis #DescendingChannel #Breakout #Bullish #Bearish #Support #Resistance #Trendline #CryptoTrading #Altseason #BinanceTrading #MarketStructure #SwingTrading #Trader #CryptoAnalysis #ChartPattern #Accumulation #BreakoutSetup #PARTIAnalysis #CryptoNuclear
PARTIUSDT 2D#PARTI is moving within a falling wedge pattern on the 2-day timeframe. Accumulating some PARTI within the wedge could be a suitable strategy for a mid-term position. The RSI is showing signs of a potential bullish move.
In case of a breakout above the wedge resistance, the following upside targets could come into play:
🎯 $0.0865
🎯 $0.1152
🎯 $0.1385
🎯 $0.1617
🎯 $0.1948
🎯 $0.2369
⚠️ Always remember to use a tight stop-loss and maintain proper risk management.
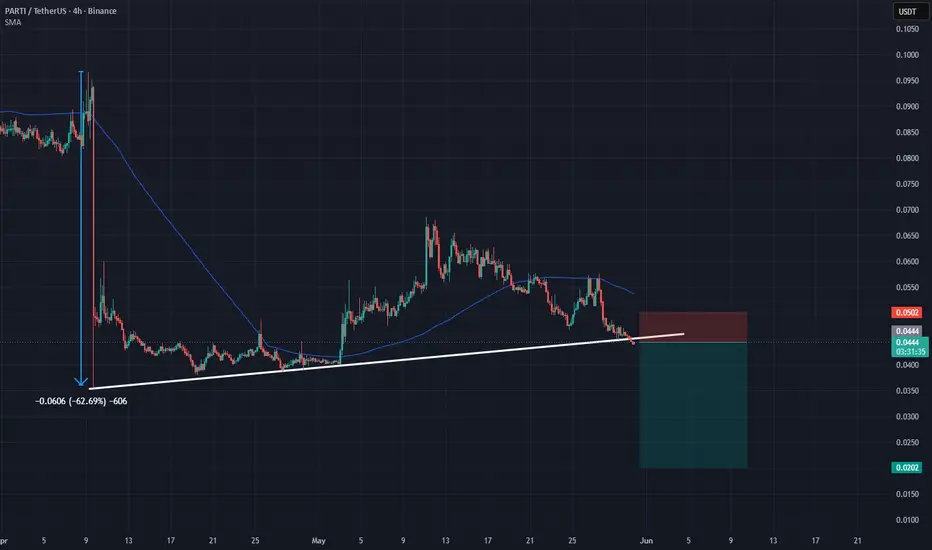
PARTI: Recovery Structure Fractured PARTI: Recovery Structure Fractured – An Optimal Trend-Following Short Opportunity
PARTI is opening up a highly decisive technical pivot point on the chart, signaling a powerful return of the bears in 2026. Looking back at historical data, after enduring heavy selling pressure with a deep plunge of over 62% in early April, the asset attempted to construct a short-term ascending trendline to seek a recovery baseline. However, this upward move was essentially a temporary psychological trap, as macro capital flows entirely lacked the consensus needed to drive the price higher.
Observing the chart , bearish signals are converging very clearly. Previously, the price candles attempted to challenge the 100-period moving average (MA100) but failed completely against tight overhead supply. The decisive blow landed when the candlestick structure shattered the critical $0.05 psychological boundary. Immediately after losing this mark, market demand vanished, neutralizing any reversal chances for the bulls.
The current price action has completely broken the short-term ascending support, unlocking a high-probability Short entry. The disciplined strategy here is to establish a trend-following Short position within this zone. A strategic stop-loss should be placed tightly above the breached trendline or above the solid $0.05 resistance cluster to decisively preserve your capital.
this is not investment advice, DYOR
PARTI: Fragile Recovery at the Triangle BoundaryPARTI is approaching a sensitive technical pivot point after undergoing a macro devaluation of 2.5 times its previous value. Although the current structure outlines an ascending triangle pattern, through the lens of a professional analyst, this recovery appears quite fragile. In fact, the apex of the triangle has only reclaimed about 30% of the preceding decisive decline, proving that buyers remain in an "exhausted" state and lack the impulse to fully break the dominant 2026 downtrend.
Why should we prioritize a Short position right now? In the investing world, an upward-sloping accumulation phase following a freefall is often just a resting period for bears to "reload" before continuing the downward journey. When price candles touch the upper boundary of the triangle without an accompanying explosion in active capital flow, it presents a golden opportunity to establish a position. The most disciplined strategy is to look for entries near the upper resistance boundary, placing an extremely tight stop-loss (SL) just above the trendline to decisively secure capital. The take-profit (TP) target is directed toward the psychological round number below—where bearish momentum typically seeks a new equilibrium. The Risk-to-Reward (RR) ratio of this setup is highly attractive because the technical hurdles are clearly defined. Keep a cool head and patiently wait for confirmation at the pivot point to optimize trading efficiency as momentum returns.
this is not investment advice, DYOR
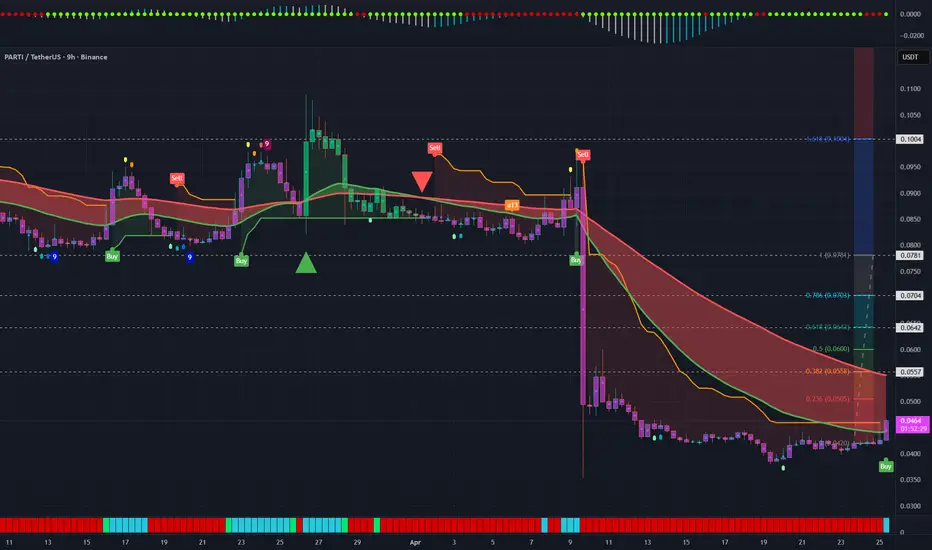
Particle Network (PARTI) Reversal Signal Particle Network is an L1 blockchain designed to fix one of Web3’s biggest problems: fragmentation.
Its core idea is Universal Accounts — one account that works across all chains, without bridging, switching networks, or managing multiple gas tokens.
TA : on more time-frames we can see many bullish signals (indicators)start to line up
This could also be a complete fake out!
Particle Network did experience a serious drop on 9 April ,time to get back to 0.078?$
PARTIUSDT Forming Bullish PennantPARTIUSDT is forming a clear bullish pennant pattern, a classic bullish continuation signal that often indicates an upcoming breakout. The price has been consolidating within a narrowing range, suggesting that selling pressure is weakening while buyers are beginning to regain control. With consistent volume confirming accumulation at lower levels, the setup hints at a potential bullish breakout soon. The projected move could lead to an impressive gain of around 90% to 100% once the price breaks above the pennant resistance.
This bullish pennant pattern is typically seen after a strong upward move followed by a brief consolidation phase, and it represents a pause before the continuation of the prevailing bullish trend. Traders closely watching PARTIUSDT are noting the strengthening momentum as it nears a breakout zone. The good trading volume adds confidence to this pattern, showing that market participants are positioning early in anticipation of continuation.
Investors’ growing interest in PARTIUSDT reflects rising confidence in the project’s long-term fundamentals and current technical strength. If the breakout confirms with sustained volume, this could mark the resumption of a powerful bullish leg. Traders might find this a valuable setup for medium-term gains, especially as the pennant pattern completes and buying momentum accelerates.
✅ Show your support by hitting the like button and
✅ Leaving a comment below! (What is your opinion about this Coin?)
Your feedback and engagement keep me inspired to share more insightful market analysis with you!
PARTI/USDT — compression → expansion attemptStrong moves don’t start from strength.
They start from pressure building under resistance.
Right now PARTI is trading around 0.100 after a sharp impulsive move and immediate rejection.
The structure is reacting — but not resolved.
What the current structure shows
• Strong impulse → immediate pullback
• Price holding inside fresh range
• Medium volatility → controlled environment
At the same time:
• No clean continuation yet
• Buyers not fully in control
This matters.
Impulse + hesitation = potential continuation, not confirmation
What AI highlights (this is key)
The setup supports a LONG scenario:
• Entry aligns with current support (0.1000–0.1010)
• Buyer pressure is present, but not aggressive
• Order flow is balanced → no heavy selling
But:
👉 This is a speculative setup
Which means:
• Move can stall near resistance
• False continuation is possible
• Momentum needs confirmation
Key levels to work with
Support / Entry: 0.1000 – 0.1011
Invalidation: 0.0958
Resistance: 0.1109
Targets:
• 0.1109
• 0.1160
Two scenarios from here
Continuation scenario
If price holds above 0.100 and builds acceptance:
• Gradual push toward 0.1109
• Buyers start taking control
This is where expansion confirms.
Failure scenario
If price loses 0.100:
• Range breaks down
• Momentum shifts back to sellers
• Deeper rotation likely
Practical approach
This is not a breakout trade.
This is positioning after an impulse.
In this type of market:
• Entries near support only
• No chasing spikes
• Respect invalidation
The edge is not in speed.
It’s in positioning.
Buyers are active.
But control still needs to be proven.
🧩 Structured plan, not a prediction.
🧠 No confirmation — no trade.
PARTIUSDT Forming Falling WedgePARTIUSDT is forming a clear falling wedge pattern, a classic bullish reversal signal that often indicates an upcoming breakout. The price has been consolidating within a narrowing range, suggesting that selling pressure is weakening while buyers are beginning to regain control. With consistent volume confirming accumulation at lower levels, the setup hints at a potential bullish breakout soon. The projected move could lead to an impressive gain of around 80% to 90% once the price breaks above the wedge resistance.
This falling wedge pattern is typically seen at the end of downtrends or corrective phases, and it represents a potential shift in market sentiment from bearish to bullish. Traders closely watching PARTIUSDT are noting the strengthening momentum as it nears a breakout zone. The good trading volume adds confidence to this pattern, showing that market participants are positioning early in anticipation of a reversal.
Investors’ growing interest in PARTIUSDT reflects rising confidence in the project’s long-term fundamentals and current technical strength. If the breakout confirms with sustained volume, this could mark the start of a fresh bullish leg. Traders might find this a valuable setup for medium-term gains, especially as the wedge pattern completes and buying momentum accelerates.
✅ Show your support by hitting the like button and
✅ Leaving a comment below! (What is your opinion about this Coin?)
Your feedback and engagement keep me inspired to share more insightful market analysis with you!
PARTIUSDT Forming Bullish PennantPARTIUSDT is forming a clear bullish pennant pattern, a classic bullish continuation signal that often indicates an upcoming breakout. The price has been consolidating within a narrowing range, suggesting that selling pressure is weakening while buyers are beginning to regain control. With consistent volume confirming accumulation at lower levels, the setup hints at a potential bullish breakout soon. The projected move could lead to an impressive gain of around 80% to 90% once the price breaks above the pennant resistance.
This bullish pennant pattern is typically seen after a strong upward move (the flagpole) followed by a brief consolidation phase, and it represents a pause before the continuation of the prevailing bullish trend. Traders closely watching PARTIUSDT are noting the strengthening momentum as it nears a breakout zone. The good trading volume adds confidence to this pattern, showing that market participants are positioning early in anticipation of continuation.
Investors’ growing interest in PARTIUSDT reflects rising confidence in the project’s long-term fundamentals and current technical strength. If the breakout confirms with sustained volume, this could mark the resumption of a powerful bullish leg. Traders might find this a valuable setup for medium-term gains, especially as the pennant pattern completes and buying momentum accelerates.
✅ Show your support by hitting the like button and
✅ Leaving a comment below! (What is your opinion about this Coin?)
Your feedback and engagement keep me inspired to share more insightful market analysis with you!
PARTI/USDT Forming Falling Wedge — Breakout Setup or Reversal?The PARTI/USDT chart on the 2D timeframe shows a prolonged downward structure forming a large descending channel / falling wedge since the previous price peak. Price action has consistently created lower highs and lower lows, indicating bearish dominance in the medium to long term trend.
However, in the most recent phase, the structure is beginning to change. Price has started forming an ascending support line, pushing price toward the apex of the pattern. This condition often represents a volatility compression phase before a significant move occurs.
Currently, price is positioned at the convergence between descending resistance and rising support, which is typically a decisive point that determines the next major direction.
---
Pattern Structure
1. Large Falling Wedge / Descending Channel
The primary pattern visible on the chart is a large descending channel, characterized by:
Descending resistance (red trendline)
Descending support (yellow trendline)
In many cases, this structure can act as a bullish reversal pattern once price successfully breaks above the upper resistance.
2. Ascending Support (Mini Rising Structure)
In the latest price action, a small ascending support line has formed, suggesting that buying pressure is gradually increasing. This can indicate that sellers are beginning to lose momentum.
3. Price Compression Toward the Apex
Price is gradually compressing toward the tip of the wedge, a situation that often precedes a strong breakout movement.
---
Key Levels
Main Resistance:
0.10850 USDT → major horizontal resistance
Descending resistance trendline (red) → dynamic resistance of the pattern
Main Support:
0.07280 USDT → important horizontal support
0.05735 USDT → critical support level
Extreme Channel Support:
0.02500 USDT
---
Bullish Scenario
The bullish scenario will be confirmed if price breaks above the descending resistance trendline and manages to close a candle above this area.
Bullish confirmation:
Break and hold above 0.10850
Potential upside targets:
1. 0.14000
2. 0.17000
3. 0.21000
If strong momentum follows the breakout, the price could potentially exit the long-term bearish structure and begin forming a new bullish trend reversal.
---
Bearish Scenario
If price fails to break the resistance and experiences a strong rejection, the market could move back down to test lower support levels.
Support levels to watch:
0.07280 → first support level
0.05735 → critical support zone
If 0.05735 breaks, price may continue its decline toward the lower boundary of the channel support.
---
Conclusion
PARTI is currently sitting at a critical point within a large wedge structure. The price is entering a compression phase near the apex, which often signals that a significant move may happen soon.
A breakout above the resistance could trigger a strong bullish reversal, while a rejection at this level may push the price back toward lower support zones.
Traders should closely watch the price reaction near the wedge resistance, as this area will likely determine the next major market direction.
#PARTI #PARTIUSDT #CryptoAnalysis #TechnicalAnalysis #Altcoin #CryptoTrading #FallingWedge #DescendingChannel #BreakoutSetup #CryptoMarket #TradingViewIdeas #AltcoinSeason #BullishBreakout #SupportAndResistance
PARTI/USDT – Strong Uptrend|Key Support & Breakout Zone in FocusPARTI is moving in a very healthy manner and remains in a clear uptrend. Price is currently consolidating below resistance. A strong breakout above the upper resistance can trigger a solid bullish rally.
Key zones to watch: $0.10106 – $0.09482
If price takes support from these levels with strong confirmation, it will attempt to break the upper resistance.
However, a breakdown below $0.09482 may lead to a retest of the lower support zone.
Trade with confirmation. Patience pays. 📈
SPK | PARTI | STEEM | STBL | 1D Chart - Bearish StructuresCurrently monitoring four altcoin pairs trading into higher timeframe resistance zones on the daily chart.
BINANCE:SPKUSDT
Price rallying into established resistance within broader weak structure. Watching for rejection or failed breakout.
BINANCE:PARTIUSDT
Relief rally into macro supply zone. Lower-high sequence remains intact on higher timeframe.
BINANCE:STEEMUSDT
Testing overhead distribution region. Momentum slowing into resistance area.
GATE:STBLUSDT
Structure remains vulnerable below prior breakdown region. Current move appears corrective into supply.
Common Technical Context:
• Higher timeframe resistance in play
• Liquidity resting above recent highs
• Relief rally within broader weak structure
• Short bias only valid upon confirmation
• Invalidation above structural break
This analysis is based strictly on price structure and risk-to-reward within derivatives markets.
Trade with defined risk.
Particle Network long-term ascending bullish compressionPARTIUSDT (Particle Network) has been moving on a long-term ascending channel, clearly revealing a bullish bias.
This project has been producing higher lows since the market flush in October 2025. With each passing day, it gets closer to a major move. This move now has an easy 156% profits potential when approaching the previous trading range, followed by more than 500% as an easy higher high and new all-time high. This can all unfold really fast as the period of consolidation is already old.
There is one signal that I've been showing you today which is present here once more. EMA55.
PARTIUSDT has been trading safely above EMA55 since 6-February, and the action continues to happen above this level with a full green candle today.
As long as buying and selling continues to happen above this long-term support, we can expect a strong bullish move to develop at anytime. Here not only EMA55 but also the longer, stronger and rather more important moving average EMA89 is working as support. Giving us confidence that is not only possible to see 1-3 months of sustained bullish action but this has already been confirmed by the charts.
Patience is key. We are going up.
Hundreds of altcoins can't be wrong.
This is the beauty of the altcoins coupled with technical analysis. When in doubt, look at around. All this doubt will be gone.
When in doubt, look at the altcoins market. What one does, the rest follows.
We are going up.
Namaste.
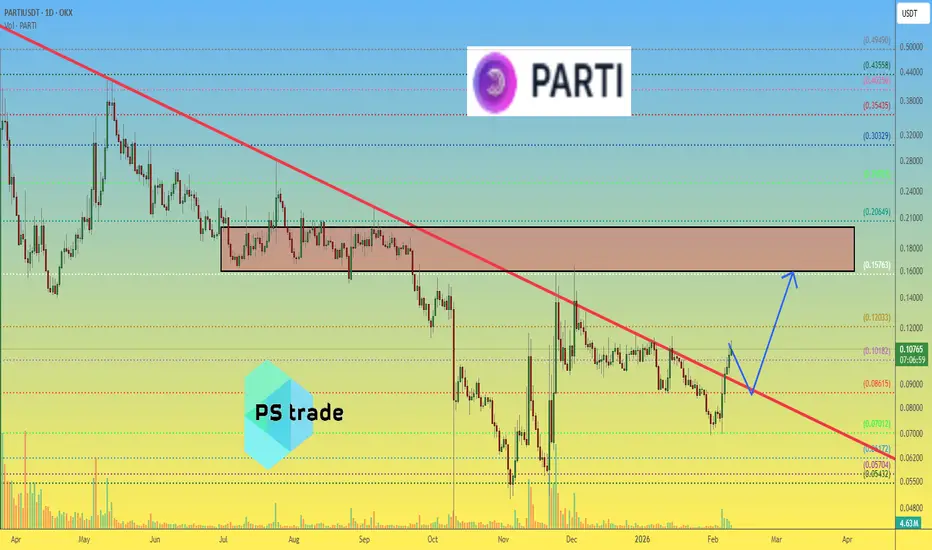
Particle Network PARTI price analysisWhile the whole crypto market is busy asking “is this the bottom or not?”, CRYPTOCAP:PARTI seems to be living in its own reality 😏
And that’s not surprising.
Particle Network has a market cap of only ~$25M, which means thinner liquidity and much more freedom for market makers to shape price action.
🔍 Scenario:
If OKX:PARTIUSDT gets confirmed above the trendline, for example above $0.086, there are currently very few technical obstacles up to the $0.16+ zone.
That opens the door for a potential x2 move, assuming structure holds.
⚠️ At the same time, low cap means volatility works both ways — fast upside moves, but also sharp pullbacks if momentum fades.
❓ Do you see CRYPTOCAP:PARTI as a controlled breakout in the making, or just short-term noise while the broader market is undecided ?
______________
◆ Follow us ❤️ for daily crypto insights & updates!
🚀 Don’t miss out on important market moves
🧠 DYOR | This is not financial advice, just thinking out loud
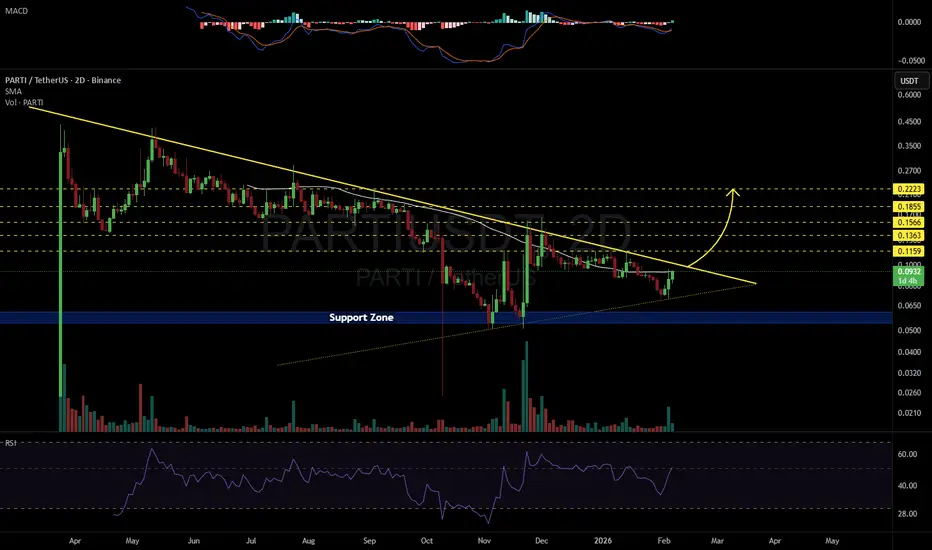
PARTIUSDT 2D#PARTI is currently testing the SMA50 on the 2-day timeframe. A small position can be considered at current levels and near the support zone. If price breaks above the SMA50 and the descending resistance, the potential upside targets are:
🎯 $0.1159
🎯 $0.1363
🎯 $0.1566
🎯 $0.1855
🎯 $0.2223
⚠️ Always apply tight stop-losses and maintain strict risk management.
PARTIUSDT Forming Falling WedgePARTIUSDT is forming a clear falling wedge pattern, a classic bullish reversal signal that often indicates an upcoming breakout. The price has been consolidating within a narrowing range, suggesting that selling pressure is weakening while buyers are beginning to regain control. With consistent volume confirming accumulation at lower levels, the setup hints at a potential bullish breakout soon. The projected move could lead to an impressive gain of around 140% to 150% once the price breaks above the wedge resistance.
This falling wedge pattern is typically seen at the end of downtrends or corrective phases, and it represents a potential shift in market sentiment from bearish to bullish. Traders closely watching PARTIUSDT are noting the strengthening momentum as it nears a breakout zone. The good trading volume adds confidence to this pattern, showing that market participants are positioning early in anticipation of a reversal.
Investors’ growing interest in PARTIUSDT reflects rising confidence in the project’s long-term fundamentals and current technical strength. If the breakout confirms with sustained volume, this could mark the start of a fresh bullish leg. Traders might find this a valuable setup for medium-term gains, especially as the wedge pattern completes and buying momentum accelerates.
✅ Show your support by hitting the like button and
✅ Leaving a comment below! (What is your opinion about this Coin?)
Your feedback and engagement keep me inspired to share more insightful market analysis with you!
PARTIUSDT Forming Falling WedgePARTIUSDT is forming a clear falling wedge pattern, a classic bullish reversal signal that often indicates an upcoming breakout. The price has been consolidating within a narrowing range, suggesting that selling pressure is weakening while buyers are beginning to regain control. With consistent volume confirming accumulation at lower levels, the setup hints at a potential bullish breakout soon. The projected move could lead to an impressive gain of around 190% to 200% once the price breaks above the wedge resistance.
This falling wedge pattern is typically seen at the end of downtrends or corrective phases, and it represents a potential shift in market sentiment from bearish to bullish. Traders closely watching PARTIUSDT are noting the strengthening momentum as it nears a breakout zone. The good trading volume adds confidence to this pattern, showing that market participants are positioning early in anticipation of a reversal.
Investors’ growing interest in PARTIUSDT reflects rising confidence in the project’s long-term fundamentals and current technical strength. If the breakout confirms with sustained volume, this could mark the start of a fresh bullish leg. Traders might find this a valuable setup for medium-term gains, especially as the wedge pattern completes and buying momentum accelerates.
✅ Show your support by hitting the like button and
✅ Leaving a comment below! (What is your opinion about this Coin?)
Your feedback and engagement keep me inspired to share more insightful market analysis with you!
Scalp SHORT – PARTI🐻 Scalp SHORT – PARTI
PARTI has surged aggressively, pushing RSI into overbought territory on both the 1h and 4h timeframes. The 1h chart now confirms a strong bearish divergence, signaling weakening bullish momentum. Current price action shows fading buying strength and early signs of reversal pressure. A corrective move is becoming increasingly likely.
Key Signals
Overbought on 1h & 4h after a sharp rally
Strong bearish divergence on 1h → momentum exhaustion
Price action turning weak → reversal risk rising
🎯 TP: 0.0684
🛡️ SL: 0.1519
📊 RR: 1 : 3.6
A high-probability short setup anticipating a decisive correction.
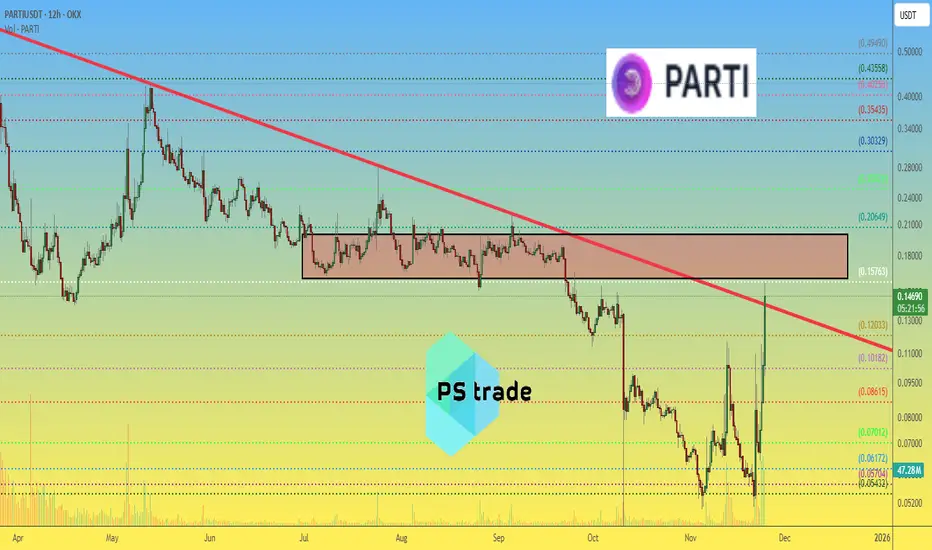
PARTI price analysis🎉 Looks like someone decided to throw a real "#partі" on the OKX:PARTIUSDT chart!
Strong move up, boosted by rising volume — but as always, there are a couple of “BUTs”… 😅
⚠️ 1. Price has slammed straight into the trendline
Nice pump, but the market loves to test patience.
⚠️ 2. Even if the trendline breaks above, the price will enter the liquidity zone at $0.16–0.20
That’s where a huge batch of longs was opened earlier — and many of them will likely sell “at breakeven,” creating extra resistance.
📊 #ParticleNetwork ’s market cap is only around $30M right now.
So the big question is: does it still make sense to keep holding — or is it safer to secure profits now? 🤔
❓ Do you think #Parti has enough strength to push through the trendline and the liquidity wall — or will sellers crush the momentum?
______________
◆ Follow us ❤️ for daily crypto insights & updates!
🚀 Don’t miss out on important market moves
🧠 DYOR | This is not financial advice, just thinking out loud
PARTIUSDT Forming Falling WedgePARTI/USDT appears to be carving out a classic falling wedge pattern, a technical formation that often heralds a bullish reversal once breakout occurs. The range is narrowing, price action is compressing, and recently the volume has shown signs of rising — all indicators that accumulation could be underway and that a breakout may be imminent. If this structure holds true, the price could surge significantly once the upper trendline is breached.
On the fundamentals front, PARTI represents the native token of Particle Network, a next-gen modular Layer 1 blockchain built on the Cosmos SDK and CometBFT consensus. The project’s focus is on delivering chain-abstraction, universal accounts, universal liquidity, and universal gas — simplifying cross-chain operations and lowering the barrier to Web3 adoption. Tokenomics show a total supply of 1 billion PARTI, with a significant portion circulating while the rest remains locked or vested, which potentially adds a supply-side catalyst as the ecosystem matures.
From a strategy perspective, traders should watch for a clean breakout above the wedge’s upper boundary with confirmation via increased volume and sustained follow-through. An actionable entry might be after such a breakout or on a retest of the breakout level. Risk management is key — placing a stop below the recent swing low or the lower trendline of the wedge ensures a clearly defined risk. If the bullish case wins out, the reward potential could be strong given the foundational narrative and structural setup.