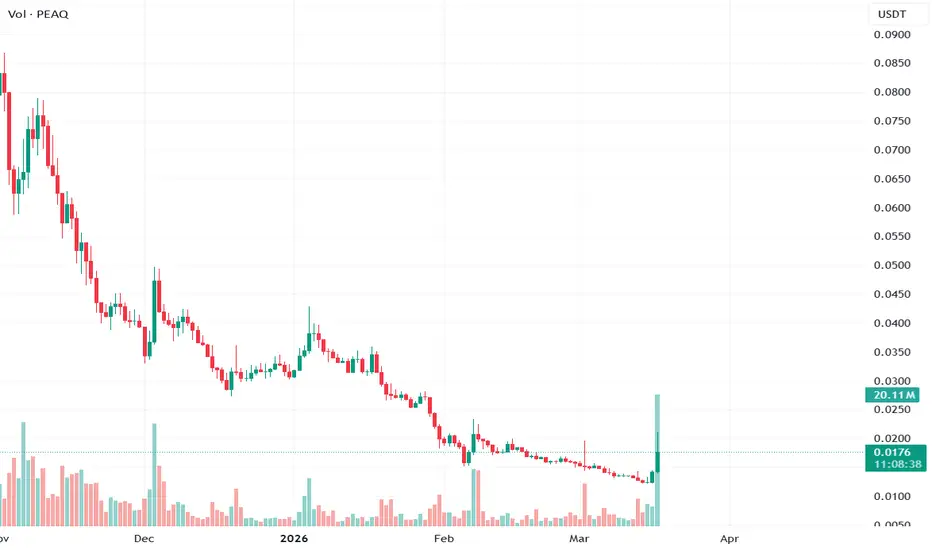
PEAQ/KRW finally broke, possible nice long here to 0.40s and +After the LP adding of PEAQ/KRW, PEAQ saw a decline , but for this moment, that decline seems to be over . PEAQ is a great solution, with nice partners, adding to all this, it seems to be very positive for now. I guess it's time to go bull.
I place a suggestion LONG with TPs and SL.
DYOR as alwa
PEAQ Network about to make another pea(q) ? Bottom can be IN!
// ==================================
// ====THE===========================
// ========MACHINE=============^^====
// ===============NEEDS===TALK=======
// ====================TO============
// ==================================
Is this the time?
Chart Recap
🔍 Pattern:
Price formed a fa
PEAQUSDT Squeeze Fired Deep Bull PEAQUSDT is trading at 0.01884 spot with futures at 0.01848, a backwardation of -1.91% at Z -4.7 — a strongly elevated reading classified Bull, meaning the futures discount is statistically significant and historically precedes spot-led recovery. Spot volume stands at 47.32M tokens against 29M futur
PEAQUSDT - Short REKTPEAQUSDT spot at 0.0176 at 4.1% Bottom of its 200-bar range between 0.0124 and 0.1387. S/F Vol at 347.42M spot against 382.22M futures — 1.1x Spot Heavy leverage at 65.8% Mid, near-balanced market. AT Max 1.66x hit only 74 bars ago showing leverage compressed rapidly.
21 bull signals against 27 bea
PEAQ – Watching the BreakoutPossible upside movement on PEAQ! We just broke through resistance with some volume, which could signal strength for a continuation move.
I’ll be watching closely for a clean retest of that broken resistance — if it holds as support, we could see another leg higher from here.
Patience pays — waiti
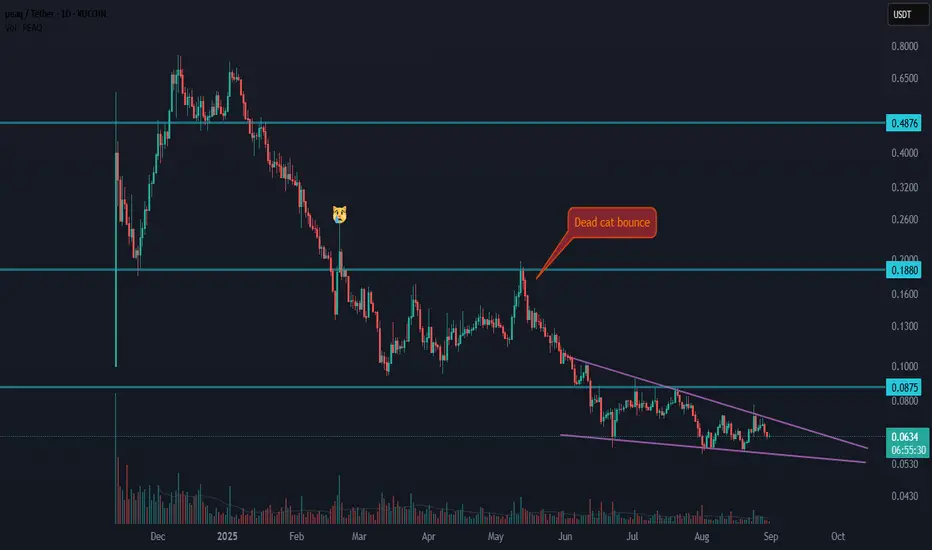
Update & Technical Analysis — PEAQ🔄 Update: In the previous setup, price made a dead cat bounce with a fake breakout, and continued its downside move.
Now, the chart has formed a falling wedge, which is considered a strong bullish pattern.
A breakout above the wedge’s resistance could be a solid trigger.
✅ Confirmation of trend re
peaq · Higher & Higher · Bottom Prices · Bitcoin $120,000Here I see a correction that will transform into a bullish impulse, notice the C wave... It can happen that the correction is not over and the C wave goes a bit lower, once more, before turning bullish. This scenario doesn't have to be a primary one but it tends to happen. Always when the low is in
PEAQ TA: Bullish Breakout Above Key ResistanceSymbol: PEAQUSDT
Timeframe: 4H
Current Price: $0.0753
Date: July 9, 2025
CRYPTO:PEAQUSD has successfully broken above the critical resistance zone of $0.069-$0.075, marking this level a strong resistance where sellers are exhausted, as prices have been above this level for over 2 weeks.
Multiple
PEAQ — Fibonacci Meets Wyckoff Structure +100% SetupAfter more than 70 days of sideways action, PEAQ is finally showing signs of life — with a well-defined structure that suggests accumulation is giving way to a potential new trend.
What we’re seeing aligns closely with a classic Wyckoff Accumulation pattern. A local bottom formed around the psychol
See all ideas
Summarizing what the indicators are suggesting.
Oscillators
Neutral
SellBuy
Strong sellStrong buy
Strong sellSellNeutralBuyStrong buy
Oscillators
Neutral
SellBuy
Strong sellStrong buy
Strong sellSellNeutralBuyStrong buy
Summary
Neutral
SellBuy
Strong sellStrong buy
Strong sellSellNeutralBuyStrong buy
Summary
Neutral
SellBuy
Strong sellStrong buy
Strong sellSellNeutralBuyStrong buy
Summary
Neutral
SellBuy
Strong sellStrong buy
Strong sellSellNeutralBuyStrong buy
Moving Averages
Neutral
SellBuy
Strong sellStrong buy
Strong sellSellNeutralBuyStrong buy
Moving Averages
Neutral
SellBuy
Strong sellStrong buy
Strong sellSellNeutralBuyStrong buy
Displays a symbol's price movements over previous years to identify recurring trends.