ConstitutionDAO PEOPLE price analysis🔔 #ConstitutionDAO CRYPTOCAP:PEOPLE was quite crypto viral and hype stories At its peak, the project reached a market capitalization of around $700–800M. Today, it's worth only about $35M.
As far as we know, the original mission never succeeded. The community failed to acquire the rare copy of the U.S. Constitution they were raising funds for, and token holders were eventually given the option to redeem their CRYPTOCAP:PEOPLE tokens for CRYPTOCAP:USDT
There's just one small detail... The token price has already collapsed by then. 🙂
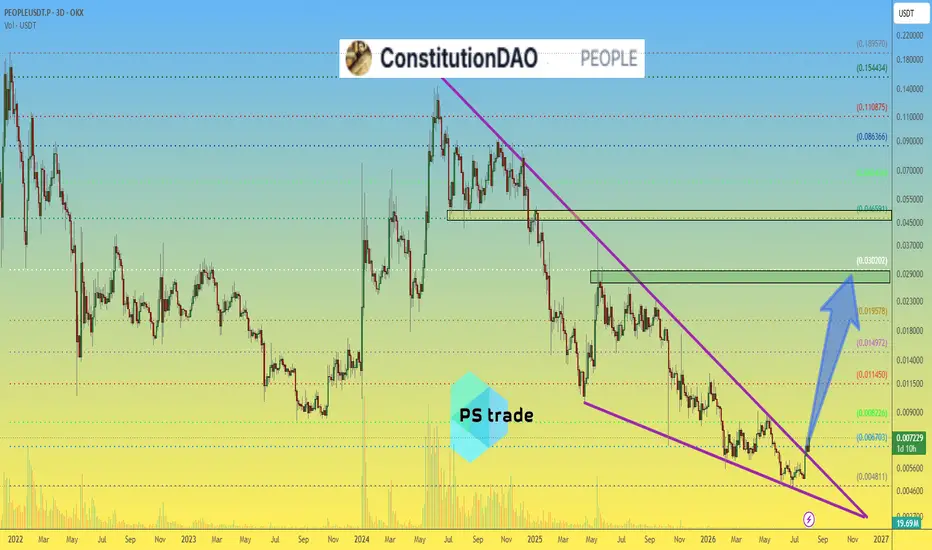
Purely from a price action perspective, OKX:PEOPLEUSDT is starting to look interesting again.
👉 Why?
• Open Interest has been rising for more than a week.
• The project has a relatively small market cap.
• The entire token supply is already in circulation.
🚀 If the market decides to revisit this old narrative, we see two potential target zones:
🟢 $0.027–0.030
🟡 $0.046–0.050
Would a 3–5x move be speculative? Absolutely.
Impossible? In crypto... we've seen much crazier things.
💬 Do you think CRYPTOCAP:PEOPLE still has one more surprise left, or is this chapter already over?
______________
◆ Follow us ❤️ for daily crypto insights & updates!
🚀 Don’t miss out on important market moves
🧠 DYOR | This is not financial advice, just thinking out loud
In-depth trading ideas
#PEOPLEUSDT looking extremely bullish#PEOPLE
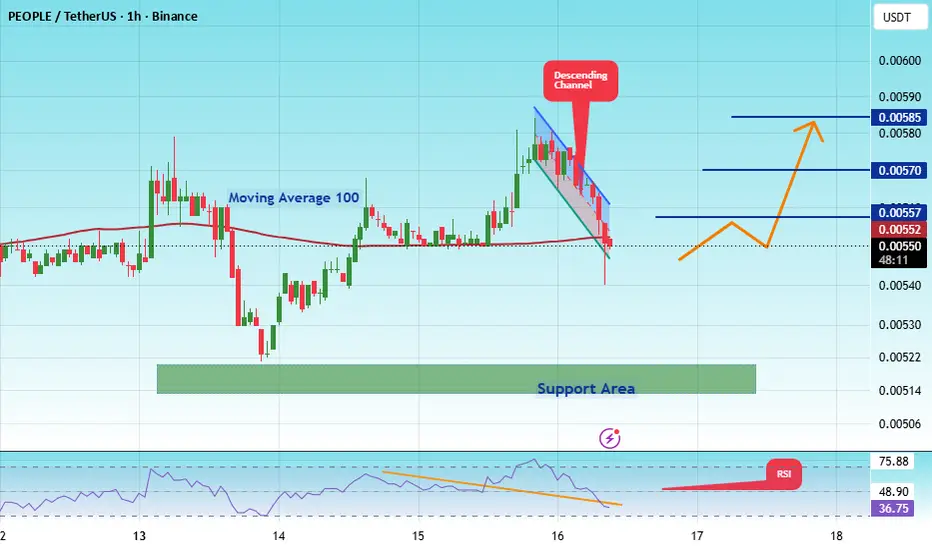
The price is moving within a descending channel on the 1-hour timeframe and has reached the lower boundary. It is now poised for a bounce and is expected to retest this boundary.
The Relative Strength Index (RSI) indicates a downward trend, which is likely to continue given the overbought conditions.
There is a key support zone in green at 0.00510. The price has bounced off this zone several times, making it a strong support level.
The price is trending towards the 100-period moving average, which we are approaching. This trend supports an upward move.
Entry Price: 0.00540
Target 1: 0.00557
Target 2: 0.00570
Target 3: 0.00585
Stop Loss: At the resistance zone in green
Remember this simple rule: Money management.
Any questions? Please leave a comment.
Thank you.
PEOPLEUSDT Forming Bullish MomentumPEOPLEUSDT is forming a clear bullish momentum pattern, a classic bullish wave signal that often indicates an upcoming breakout. The price has been consolidating within a narrowing range, suggesting that selling pressure is weakening while buyers are beginning to regain control. With consistent volume confirming accumulation at lower levels, the setup hints at a potential bullish breakout soon. The projected move could lead to an impressive gain of around 40% to 50% once the price breaks above the pattern resistance.
This bullish momentum pattern is typically seen at the end of downtrends or corrective phases, and it represents a potential shift in market sentiment from bearish to bullish. Traders closely watching PEOPLEUSDT are noting the strengthening momentum as it nears a breakout zone. The good trading volume adds confidence to this pattern, showing that market participants are positioning early in anticipation of a reversal.
Investors’ growing interest in PEOPLEUSDT reflects rising confidence in the project's long-term fundamentals and current technical strength. If the breakout confirms with sustained volume, this could mark the start of a fresh bullish leg. Traders might find this a valuable setup for medium-term gains, especially as the pattern completes and buying momentum accelerates.
✅ Show your support by hitting the like button and
✅ Leaving a comment below! (What is You opinion about this Coin)
Your feedback and engagement keep me inspired to share more insightful market analysis with you!
PEOPLEUSDT - Descending Trendline, Reversal or Rejection?🪙 Coin: MYX:PEOPLE / #PEOPLEUSDT
⏳ Time Frame: 2D
📉 Pattern: Descending Trendline (Long-Term Resistance)
📌 The chart shows that PEOPLEUSDT has been in a long-term downtrend since mid-2025. Price is now retesting the Descending Trendline, which has acted as a strong dynamic resistance for months.
⚡ The next move will likely determine whether PEOPLE can initiate a trend reversal or continue its long-term bearish trend.
━━━━━━━━━━━━━━━━━━
📊🔍 Technical Analysis
📉 Descending Trendline (Major Resistance)
🔸 The yellow Descending Trendline has rejected price multiple times throughout the downtrend.
🔸 The more frequently a resistance level is tested, the greater the chance it eventually weakens.
🔸 Price is now approaching and attempting to break above this critical trendline.
✅ A confirmed breakout would be an early signal of a potential market structure shift from bearish to bullish.
━━━━━━━━━━━━━━━━━━
🔥 Bullish Momentum Is Building
🟢 Bullish candles have started to form after establishing a relatively stable support base.
📈 Buyers are gradually gaining strength following an extended downtrend.
💥 If the breakout is accompanied by strong trading volume, the probability of a sustained rally will increase significantly.
━━━━━━━━━━━━━━━━━━
🎯 Next Resistance Targets
If the breakout is successfully confirmed, the next resistance levels are:
🟡 Target 1: 0.007480 USDT
🎯 Target 2: 0.008700 USDT
🚀 Target 3: 0.011500 USDT
💎 Target 4: 0.012500 USDT
⚠️ These levels represent key horizontal resistance zones, where profit-taking or temporary consolidation may occur.
━━━━━━━━━━━━━━━━━━
🟢🚀 Bullish Scenario (Probability: ~60%)
✅ Price successfully closes above the Descending Trendline on the 2D timeframe.
📊 The breakout is confirmed with increasing trading volume.
💪 The 0.007480 USDT resistance is broken and flips into support.
If these conditions are met, the next upside targets become:
🎯 0.008700 USDT
🚀 0.011500 USDT
💎 0.012500 USDT
📈 This breakout could mark the end of the prolonged downtrend and signal the beginning of a new bullish trend.
━━━━━━━━━━━━━━━━━━
🔴⚠️ Bearish Scenario (Probability: ~40%)
❌ Price fails to sustain the breakout.
🚫 Strong rejection occurs at the Descending Trendline.
📉 Buying volume begins to weaken.
If this scenario unfolds, PEOPLE may decline toward the previous support zone around:
🛡️ Support: 0.005200 USDT
⚠️ If this support fails, price could revisit its previous low and continue the broader bearish trend.
━━━━━━━━━━━━━━━━━━
📌✨ Conclusion
📍 PEOPLEUSDT is currently trading at a decisive technical level.
📍 The Descending Trendline remains the primary resistance that must be broken to shift the market structure toward a bullish outlook.
📍 A breakout without strong volume confirmation still carries the risk of becoming a false breakout, making candle close confirmation essential.
📍 As long as price successfully holds above the breakout zone after confirmation, the path toward higher resistance levels remains open.
━━━━━━━━━━━━━━━━━━
⚠️ Disclaimer
📖 This analysis is based on Price Action, Market Structure, and Technical Analysis.
🚫 This is not financial advice or a recommendation to buy or sell any asset.
🛡️ Always DYOR (Do Your Own Research) and apply proper Risk Management before making any investment or trading decisions.
━━━━━━━━━━━━━━━━━━
#PEOPLE #PEOPLEUSDT #ConstitutionDAO #Crypto #Altcoin #TradingView #TechnicalAnalysis #PriceAction #Trendline #Breakout #Bullish #Bearish #Support #Resistance #CryptoTrading #CryptoAnalysis #ChartAnalysis #SwingTrading #MarketStructure
PEOPLE / PEOPLEUSDT Bullish Setup | Futures Trade IdeaMARKET ANALYSIS
PEOPLE is currently reacting from a key technical area highlighted on the chart.
As long as the protected support zone remains intact, the bullish market structure remains valid and higher liquidity targets may continue to attract price action.
A breakdown below the invalidation level would weaken the current bullish scenario and require a reassessment of market conditions.
📍 Entry, Stop Loss and Take Profit levels are marked directly on the chart.
━━━━━━━━━━━━━━
⚠️ DISCLAIMER
This publication is provided solely for educational and market observation purposes.
Nothing contained in this analysis should be considered financial advice, investment advice, or a recommendation to buy or sell any financial instrument.
All trading and investment decisions remain solely the responsibility of the individual trader.
Always conduct your own research and apply proper risk management before entering any position.
━━━━━━━━━━━━━━
🎯 PARALOG
▪️Crypto Market Analysis
▪️BTC Futures Signals
▪️Bitcoin & Altcoin Market Analysis
Precision • Momentum • Timing
━━━━━━━━━━━━━━
Exchange: #MEXC Futures
#bitcoin #btc #crypto #futures #technicalanalysis
peopleusdt longInstructions:
Entry point: yellow
Stop loss: red
Take profit: green
👉Leverage x 5-10-20 for crypto
👉Leverage x 20-50-100 for commodities, stocks, indices, and forex
👉Margin 1-5% max.
Always practice risk and money management.
Invest a maximum of 5% on any trade or across all your trades.
Invest only what you can afford to lose, as no one is in control of the market.
👉Our analyses are primarily based on:
breakouts: two trend lines (ascending and descending) and a line indicating a horizontal breakout.
chart patterns: shoulders and head, triangle parttern, elliott impulse, etc etc.
We don't always have the time to track them at all times or to represent them visibly, given the numerous signals, the number of channels to manage, and especially because of the often rapid pace of market movements.
indicators: We associate at least two indicators with this technique.
👉Depending on the circumstances, we use specific indicators, often setting 3 or more take profit levels.
👉Indeed, there are good days in trading and also bad days. No one can promise to win every trade, and like all traders worldwide, we also experience stop-loss orders. However, we win more than we lose and remain positive.
👉You can close the position before or after the take profit orders indicated by the green lines if you are personally satisfied; the same applies to stop loss orders.
👉We must stay positive, clear-headed, and humble.
we cannot provide all instructions or all trades here on this channel.
Good luck to us all, and may God guide us. Amen.
#PEOPLEUSDT looking extremely bullish#PEOPLE
The price is moving within a descending channel on the 1-hour timeframe and has reached the lower boundary. It is now poised for a bounce and is expected to retest this boundary.
The Relative Strength Index (RSI) indicates a downward trend, which is likely to continue given the overbought conditions.
There is a key support zone (in green) at 0.00513. The price has bounced off this zone several times, making it a strong support level.
The price is trending towards the 100-period moving average, which we are approaching. This trend supports an upward move.
Entry Price: 0.00548
Target 1: 0.00557
Target 2: 0.00570
Target 3: 0.00585
Stop Loss: At the resistance zone (in green)
Remember this simple rule: Money management.
Any questions? Please leave a comment.
Thank you.
#PEOPLEUSDT#PEOPLE
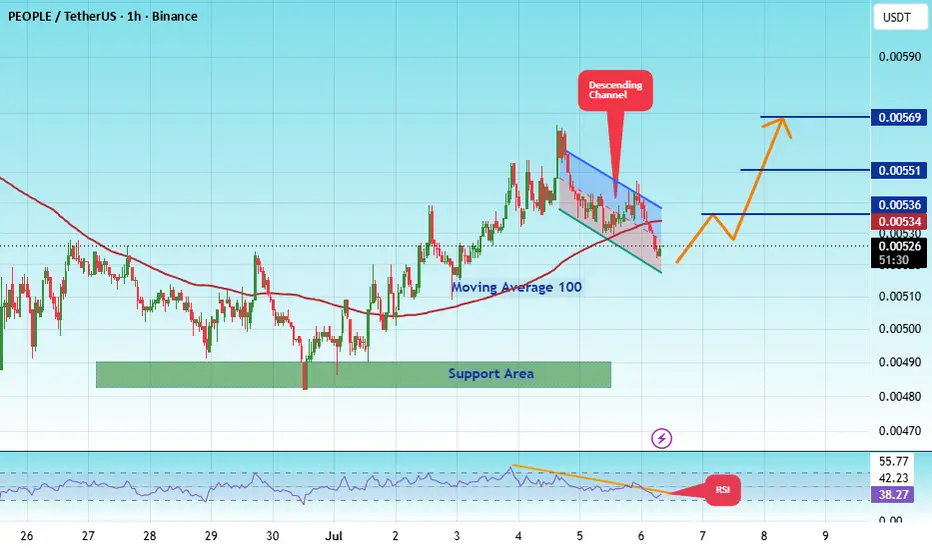
The price is moving within a descending channel on the 1-hour timeframe and has reached the lower boundary. It is now poised for a bounce and is expected to retest this boundary.
The Relative Strength Index (RSI) indicates a downward trend, which is likely to continue given the overbought conditions.
There is a key support zone (in green) at 0.00484. The price has bounced off this zone several times, making it a strong support level.
The price is trending towards the 100-period moving average, which we are approaching. This trend supports an upward move.
Entry Price: 0.00526
Target 1: 0.00536
Target 2: 0.00551
Target 3: 0.00569
Stop Loss: At the resistance zone (in green)
Remember this simple rule: Money management.
Any questions? Please leave a comment.
Thank you.
#PEOPLEUSDT looking extremely bullish#PEOPLE
The price is moving within a descending channel on the 1-hour timeframe and has reached the lower boundary. It is now poised for a bounce and is expected to retest this boundary.
The Relative Strength Index (RSI) indicates a downward trend, which is likely to continue given the overbought conditions.
There is a key support zone in green at 0.00515. The price has bounced off this zone several times, making it a strong support level.
The price is trending towards the 100-period moving average, which we are approaching. This trend supports an upward move.
Entry Price: 0.00538
Target 1: 0.00543
Target 2: 0.00553
Target 3: 0.00570
Stop Loss: At the resistance zone in green
Remember this simple rule: Money management.
Any questions? Please leave a comment.
Thank you.
#PEOPLEUSDT looking extremely bullish#PEOPLE
The price is moving within a descending channel on the 1-hour timeframe and has reached the lower boundary. It is now poised for a bounce and is expected to retest this boundary.
The Relative Strength Index (RSI) indicates a downward trend, which is likely to continue given the overbought conditions.
There is a key support zone in green at 0.00480. The price has bounced off this zone several times, making it a strong support level.
The price is trending towards the 100-period moving average, which we are approaching. This trend supports an upward move.
Entry Price: 0.00525
Target 1: 0.00536
Target 2: 0.00552
Target 3: 0.00570
Stop Loss: At the resistance zone in green
Remember this simple rule: Money management.
Any questions? Please leave a comment.
Thank you.
#PEOPLEUSDT looking extremely bullish#PEOPLE
The price is moving within a descending channel on the 1-hour timeframe and has reached the lower boundary. It is now poised for a bounce and is expected to retest this boundary.
The Relative Strength Index (RSI) indicates a downward trend, which is likely to continue given the overbought conditions.
There is a key support zone (in green) at 0.00624. The price has bounced off this zone several times, making it a strong support level.
The price is trending towards the 100-period moving average, which we are approaching. This trend supports an upward move.
Entry Price: 0.0680
First Target: 0.00703
Second Target: 0.00729
Third Target: 0.00758
You can stop at the first and second targets and close the price, or continue towards the third target. Stop Loss: At the resistance zone (in green).
Remember this simple rule: Money Management.
Any questions? Please leave a comment.
Thank you.
#PEOPLE/USDT looking extremely bullish#PEOPLE
The price is moving within a descending channel on the hourly timeframe. It has reached the lower boundary and is trending towards a bounce. A retest of this boundary is expected.
The Relative Strength Index (RSI) indicates a downward trend, and this trend is likely to continue due to the overbought condition.
A key support zone has been identified in green at 0.00665, and the price has bounced off this zone several times, making it a strong support level.
The price is trending towards the 100-period moving average, which we are approaching. This trend supports an upward move.
Entry Price: 0.00750
First Target: 0.00788
Second Target: 0.00808
Third Target: 0.00840
You can close at the second target or wait for the third target to be reached. The choice is yours.
Stop Loss: At the resistance zone in green.
Remember this simple rule: Money Management.
Any questions? Please leave a comment.
Thank you.
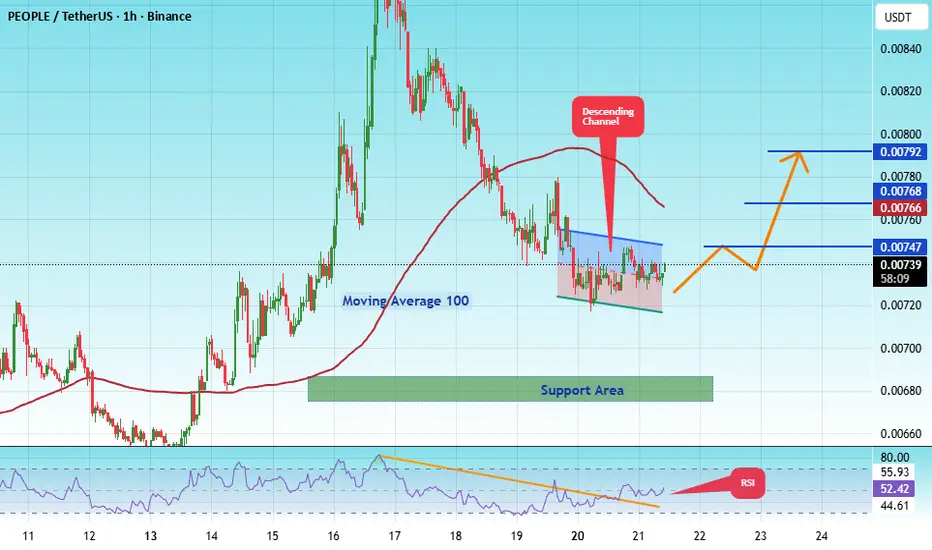
#PEOPLEUSDT looking extremely bullish#PEOPLE
The price is moving within a descending channel on the 1-hour timeframe and has reached the lower boundary. It is now poised for a bounce and is expected to retest this boundary.
The Relative Strength Index (RSI) indicates a downward trend, which is likely to continue given the overbought conditions.
There is a key support zone in green at 0.00674. The price has bounced off this zone several times, making it a strong support level.
The price is trending towards the 100-period moving average, which we are approaching. This trend supports an upward move.
Entry Price: 0.00735
First Target: 0.00747
Second Target: 0.00768
Third Target: 0.00792
You can stop at the first and second targets and close the price, or continue towards the third target.
Stop Loss: At the resistance zone in green.
Remember this simple rule: Money Management.
Any questions? Please leave a comment.
Thank you.
#PEOPLE/USDT looking extremely bullish#PEOPLE
The price is moving within a descending channel on the hourly timeframe. It has reached the lower boundary and is trending towards a bounce. A retest of this boundary is expected.
The Relative Strength Index (RSI) indicates a downward trend, and this trend is likely to continue due to the overbought condition.
There is a key support zone in green at 0.00706, and the price has bounced off this zone several times, making it a strong support level.
The price is trending towards the 100-period moving average, which we are approaching. This trend supports an upward move.
Entry Price: 0.00722
Target 1: 0.00741
Target 2: 0.00761
Target 3: 0.00788
Stop Loss: At the resistance zone in green
Remember this simple rule: Money management.
Any questions, please leave a comment.
Thank you.
PEOPLEUSDT — Descending Channel: Reversal or Fakeout?The PEOPLE/USDT chart shows a strong downtrend structure formed since the high around 0.0394, with price consistently moving within a Descending Channel (parallel downward channel).
This channel is characterized by:
Continuously forming Lower Highs (red resistance line)
Decreasing Lower Lows (yellow support line)
Relatively clean price movement inside the channel → indicating a valid bearish trend
Currently, price is:
Testing the upper boundary (channel resistance)
Showing signs of an initial breakout attempt with a strong bullish candle
---
📐 Pattern: Descending Channel (Bullish Reversal Potential)
This pattern is typically:
A bearish continuation pattern, but
Can become a bullish reversal signal if a breakout occurs
Key observations in this chart:
Long-term channel (multi-month trend)
Signs of accumulation near the lower range
Breakout attempt → critical phase
---
📈 Bullish Scenario (Breakout Confirmation)
If price manages to:
Break and close above the channel resistance (~0.0091)
Successfully retest and hold as support
Then potential upside targets:
Target 1: 0.0110
Target 2: 0.0125
Target 3: 0.0138
Main target: 0.0158
💡 These levels represent layered resistance zones (yellow lines), ideal for staged profit-taking.
➡️ Momentum strengthens if:
A higher high forms after breakout
Market structure shifts from lower high → higher high
---
📉 Bearish Scenario (Fakeout / Rejection)
If price:
Fails to hold above the channel resistance
Gets rejected around 0.0091
Then likely outcome:
Price falls back into the channel
Downtrend continues
Downside targets:
Minor support: 0.0075 – 0.0065
Major support: 0.0055
Worst case: lower channel area near 0.0040
⚠️ This would confirm a fakeout (bull trap)
---
⚖️ Conclusion
The primary trend remains bearish, but price is at a key decision zone
A breakout from the descending channel could signal an early reversal
Confirmation is crucial — avoid entering based on wicks or spikes alone
#PEOPLEUSDT #CryptoAnalysis #TechnicalAnalysis #Altcoins #Breakout #DescendingChannel #BullishReversal #BearishTrend #CryptoTrading #SupportResistance #SmartMoney #PriceAction
#EOPLEUSDT looking extremely bullish#PEOPLE
The price is moving within a descending channel on the 1-hour timeframe and has reached the lower boundary. It is now poised for a bounce and is expected to retest this boundary.
The Relative Strength Index (RSI) indicates a downward trend, which is likely to continue given the overbought conditions.
There is a key support zone in green at 0.00624. The price has bounced off this zone several times, making it a strong support level.
The price is trending towards the 100-period moving average, which we are approaching. This trend supports an upward move.
Entry Price: 0.00624
Target 1: 0.00672
Target 2: 0.00684
Target 3: 0.00700
Stop Loss: At the resistance zone in green
Remember this simple rule: Money management.
Any questions? Please leave a comment.
Thank you.
#PEOPLEUSDT looking extremely bullish#PEOPLE
The price is moving within a descending channel on the 4-hour timeframe. It has reached the lower boundary and is heading for a bounce. A retest of this boundary is expected.
The Relative Strength Index (RSI) indicates a downward trend, and this trend is likely to continue due to the overbought condition.
There is a key support zone in green at 0.00600. The price has bounced off this zone several times, making it a strong support level.
The price is trending towards the 100-period moving average, which we are approaching. This trend supports an upward move.
Entry Price: 0.00639
Target 1: 0.00649
Target 2: 0.00660
Target 3: 0.00675
Stop Loss: At the resistance zone in green
Remember this simple rule: Money management.
Any questions, please leave a comment.
Thank you.
#PEOPLEUSDT looking extremely bullish#PEOPLE
The price is moving within a descending channel on the hourly timeframe. It has reached the lower boundary and is trending towards a bounce. A retest of this boundary is expected.
The Relative Strength Index (RSI) indicates a downward trend, and this trend is likely to continue due to the overbought condition.
There is a key support zone in green at 0.00599. The price has bounced off this zone several times, making it a strong support level.
The price is trending towards the 100-period moving average, which we are approaching. This trend supports an upward move.
Entry Price: 0.00622
Target 1: 0.00636
Target 2: 0.00651
Target 3: 0.00669
Stop Loss: At the resistance zone in green
Remember this simple rule: Money management.
Any questions, please leave a comment.
Thank you.
#PEOPLE/USDT looking extremely bullish#PEOPLE
The price is moving within a descending channel on the hourly timeframe. It has reached the lower boundary and is trending towards a bounce. A retest of this boundary is expected.
The Relative Strength Index (RSI) indicates a downward trend, and this trend is likely to continue due to the overbought condition.
There is a key support zone in green at 0.00700. The price has bounced off this zone several times, making it a strong support level.
The price is trending towards the 100-period moving average, which we are approaching. This trend supports an upward move.
Entry Price: 0.00716
Target 1: 0.00731
Target 2: 0.00747
Target 3: 0.00762
Stop Loss: At the resistance zone in green
Remember this simple rule: Money management.
Any questions, please leave a comment.
Thank you.
PEOPLEUSDT Forming Falling WedgePEOPLEUSDT is forming a clear falling wedge pattern, a classic bullish reversal signal that often indicates an upcoming breakout. The price has been consolidating within a narrowing range, suggesting that selling pressure is weakening while buyers are beginning to regain control. With consistent volume confirming accumulation at lower levels, the setup hints at a potential bullish breakout soon. The projected move could lead to an impressive gain of around 190% to 200% once the price breaks above the wedge resistance.
This falling wedge pattern is typically seen at the end of downtrends or corrective phases, and it represents a potential shift in market sentiment from bearish to bullish. Traders closely watching PEOPLEUSDT are noting the strengthening momentum as it nears a breakout zone. The good trading volume adds confidence to this pattern, showing that market participants are positioning early in anticipation of a reversal.
Investors’ growing interest in PEOPLEUSDT reflects rising confidence in the project’s long-term fundamentals and current technical strength. If the breakout confirms with sustained volume, this could mark the start of a fresh bullish leg. Traders might find this a valuable setup for medium-term gains, especially as the wedge pattern completes and buying momentum accelerates.
✅ Show your support by hitting the like button and
✅ Leaving a comment below! (What is your opinion about this Coin?)
Your feedback and engagement keep me inspired to share more insightful market analysis with you!
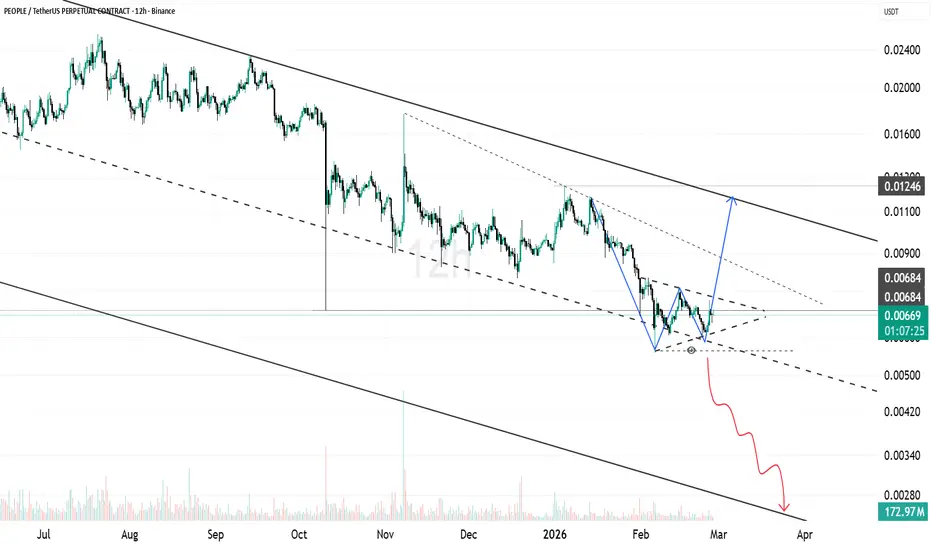
PEOPLE Trading in the Middle of Macro Downtrend StructurePEOPLE remains inside a broad descending channel on the higher timeframe, with price consistently printing lower highs under the macro descending trendline. The dominant structure is still bearish.
However, on the 12H timeframe price is now compressing near the middle of the channel. Recent price action shows a tightening range with higher lows forming against horizontal support around 0.0066 to 0.0068. This creates a short term symmetrical compression inside a larger downtrend.
This type of structure often leads to a volatility expansion.
If price holds above the 0.0066 region and breaks above the short term descending resistance, upside targets sit near 0.0090 first, followed by 0.0124 which aligns with the major descending trendline.
On the other hand, if 0.0066 fails and the lower dashed support breaks, continuation toward 0.0050 and potentially 0.0030 becomes likely, following the direction of the macro channel.
Right now price is sitting at a decision point.
Support holding favors a corrective bounce toward mid channel resistance.
Breakdown confirms continuation of the broader bearish structure.
#PEOPLE/USDT looking extremely bullish#PEOPLE
The price is moving within a descending channel on the hourly timeframe. It has reached the upper boundary and is heading towards breaking it. A retest of this boundary is expected.
The Relative Strength Index (RSI) is showing an upward trend, as it has approached the upper boundary. A bearish reversal is expected.
There is a key support zone in green at 0.00600. The price has bounced from this zone several times and is expected to bounce again.
A consolidation trend is observed above the 100-period moving average, which we are approaching. This trend supports a decline towards this level.
Entry Price: 0.00670
Target 1: 0.00689
Target 2: 0.00721
Target 3: 0.00772
Stop Loss: Above the green support zone.
Don't forget one simple thing: Money Management.
For any questions, please leave a comment.
Thank you.
PEOPLEUSDT 3D#PEOPLE is trading within a falling wedge on the 3-day timeframe. Keep an eye on it for a mid-term setup, and only consider entry after a breakout above both the wedge resistance and the 3-day SMA50. If confirmed, the potential mid-term targets are:
🎯 $0.01355
🎯 $0.01848
🎯 $0.02246
🎯 $0.02644
🎯 $0.03212
🎯 $0.03934
🎯 $0.04938
⚠️ Always apply tight stop-losses and maintain strict risk management.