PEPE: Potential Big Return#PEPE
#PEPE is nearing the end of its long two-year correction following its massive 2024 rally, with a potential major trend reversal ahead.
As long as the price holds above $0.000000867, the bullish outlook remains valid. Passing above $0.000004580 would confirm the trend reversal.
In-depth trading ideas
PEPE Retesting a Major Long-Term Support TrendlinePEPE is currently sitting on a multi-month ascending support trendline that has held the market structure together since the early stages of its bull cycle.
After a prolonged downtrend from the major highs, price has compressed into a critical support area where buyers and sellers are fighting for control. This is a high-risk, high-reward zone because the next move could define the medium-term trend.
Short-Term Outlook
As long as price remains above the rising trendline support, bulls retain a chance of recovery.
Targets: 0.0000040 → 0.0000060 → 0.0000080
Stop-loss: Below the trendline support
Long-Term Outlook
The broader structure is still attempting to hold a higher-low formation relative to the beginning of the major rally.
The current area could become an accumulation zone if buyers step in aggressively.
A successful bounce from support may trigger a strong relief rally due to the extended correction already seen.
Targets: 0.0000080 → 0.0000120 → 0.0000180
Stop-loss: Weekly close below the trendline
Summary
PEPE is testing one of the most important support levels on the entire chart: the long-term ascending trendline. If buyers successfully defend this area, the token could begin a recovery phase toward 0.0000060–0.0000080 initially, with potential for a larger move toward 0.0000120+ over time.
However, a decisive breakdown below the trendline would be a major technical warning sign and could trigger another wave of selling pressure, invalidating the bullish setup and increasing the risk of new cycle lows.
Pepe momentum building as traders eye another meme‑coin squeezeCurrent Price: 0.00001
Direction: LONG
Confidence level: 58%(Bullish social sentiment with 45 bullish vs 5 bearish tweets and improving technical indicators such as RSI above 60 and bullish MACD divergence, but limited direct professional trader commentary reduces certainty.)
Targets
Target 1: 0.0000108
Target 2: 0.0000116
Stop Levels
Stop 1: 0.0000092
Stop 2: 0.0000086
Wisdom of Professional Traders:
This analysis synthesizes insights from thousands of professional traders and market experts, combining what traders are saying across platforms to find solid opportunities. When multiple sources—from trader discussions to social sentiment—start leaning in the same direction, it often highlights momentum shifts before they become obvious on the chart.
Key Insights:
Here’s what’s driving this setup right now. Social sentiment around PEPE is clearly leaning bullish. Out of roughly 95 trading‑related posts on X, bullish commentary dominates the conversation with around 45 bullish mentions compared to only about 5 bearish ones. That kind of imbalance usually shows growing speculation and momentum—especially in meme coins where sentiment often leads price.
Another factor I’m watching is technical momentum. Several technical analyses referenced RSI readings in the high‑50s to mid‑60s and early bullish MACD signals. That combination usually means momentum is building but not yet overheated. In meme coin markets, that zone often precedes quick bursts of upside if volume shows up.
There’s also chatter about whales accumulating PEPE wallets. That doesn’t guarantee a rally, but historically meme coins tend to run when large holders begin accumulating during quiet consolidation phases.
Recent Performance:
PEPE has been quietly grinding higher over the past week. Market data shows the token up roughly 8–10% during recent trading sessions while maintaining a steady upward bias. Over the last month the asset has also managed a modest gain despite broader altcoin volatility. That steady climb is important because meme coins usually rally after these slow accumulation periods.
Expert Analysis:
Several professional traders watching the meme‑coin sector have pointed out that PEPE’s technical indicators are improving. RSI sitting above 60 suggests bullish momentum without being overbought yet. At the same time, MACD signals are starting to show bullish divergence, which often appears before momentum expansions.
What caught my attention is the imbalance between bullish and bearish commentary across trading communities. Many traders see PEPE consolidating before a breakout move, especially if broader crypto sentiment remains positive. When meme coins start trending during a stable BTC environment, they can move quickly.
News Impact:
The broader crypto market also helps the bullish case. Bitcoin holding strong near the $78k–$80k zone is supporting risk appetite across altcoins. When majors stabilize, speculative capital often rotates into meme coins like PEPE. Add in renewed attention around meme‑coin rallies in 2026, and it creates a favorable environment for short‑term upside attempts.
Trading Recommendation:
Putting it all together, I’m leaning LONG on PEPE for a short‑term momentum trade this week. Social sentiment is clearly bullish, technical momentum indicators are improving, and meme coins tend to move fast once speculation builds.
My approach would be accumulating near the current $0.00001 level with upside targets at $0.0000108 and $0.0000116. Risk management matters here because meme coins can reverse quickly, so I’d protect the position with stops at $0.0000092 and $0.0000086.
If sentiment keeps heating up on social platforms, PEPE could see a quick speculative push this week.
PEPE – Critical Support Test After Prolonged DowntrendTrend Overview:
Pepe is clearly in a long-term downtrend after a speculative blow-off top. Price has been consistently making lower highs and lower lows, showing strong bearish control.
Key Technical Points:
1. Major Support Zone (Black Trendline):
• Price is currently sitting on a long-term descending support
• This level has held multiple times in the past
→ A decisive break or bounce here is very important
2. Moving Average (Orange Line):
• Price remains below the MA, confirming bearish momentum
• MA is acting as dynamic resistance
3. Volatility Compression:
• Price action is tightening near support
→ This often leads to a sharp move (breakout or breakdown)
Scenarios:
Bullish Scenario (Relief Bounce):
• If support holds and price breaks above short-term resistance
→ Potential move toward 0.0000060 – 0.0000080
Bearish Scenario (More Probable):
• If support breaks decisively
→ Continuation toward new lows (low liquidity zone below current price)
Conclusion:
This is a high-risk, high-volatility setup. The overall trend is still bearish, and unless a strong reversal structure forms, downside continuation is more likely.
Will Crypto Break Out Following a Market Warning?PEPE with ETH Overlaid:
The same format we saw around the turn of the year may be about to happen again.
The curved arrow shows the ETH Shooting Star down on the daily chart (curved arrow).
Notice how that acted as a higher time frame bearish warning for the next wave down.
But did the market immediately fall away? No. Instead meme coins had an enormous pump, with PEPE being the strongest, up around 100% (up arrow) ~ see linked idea.
If something similar plays out again, then this may still be very early in the move as most coins have not yet broken out of their trading ranges.
As I write, a small pullback is printing on the PEPE chart.
This is one to keep an eye on if momentum begins to build.
That said, it is still a dangerous environment with TOTAL and BTC both closing last week with Shooting Stars 🧐.
- I also covered crypto as part of the weekend All Market video linked in this thread.
Not advice
PEPE - Compression Before Expansion?Pepe is one of those coins that lives and dies on sentiment. There’s no deep fundamental story here - it’s momentum, liquidity and hype. But that doesn’t mean it can’t move.
Pros:
• When meme coins catch momentum, they move fast.
• Liquidity is strong compared to smaller alts.
• Clean technical structure = tradable volatility.
• Retail flows hard into names like this during bullish phases.
Cons:
• No real utility backing it.
• Extremely volatile — it can drop as fast as it pumps.
• Whale activity can distort structure quickly.
• If hype fades, so does the move.
Bottom line:
This isn’t a “marry the project” trade. It’s a calculated risk. If structure confirms and momentum builds, there’s opportunity. If it fails, you cut it and move on.
Trade it for what it is - speculative.
PEPE might be due for some big wick energyGiven the setup for Ethereum which I already laid out as being probably the best risk/reward trade you'll likely see all year here, PEPE which is the best eternal memecoin of all time is likely to see a similar pump - though it may be amplified as when ETH runs, PEPE often runs about 4-5x harder.
I plan to accumulate more PEPE during this cycle while crypto ranges and idiot boomers continue to call crypto dead ahead of a massive global liquidity increase.
Buy levels for PEPE .000002-.000004
TP1 .000012
TP2 .000014
TP3 .000020
PEPE: $0.000 00 624 | Waypoint to Greatnessbuilding a community takes time
accumulating for generational wealth also takes time
PEPE with strong hands and dedicated believers
can be as rewarding as MONERO
as it BUILDS a following
and a BASE for strong hands to even afford to BUY beyond ATH
the lower the cost the more you accumulate
the easier to push the price to fresh highs
$PEPE: MAJOR HEAD and SHOULDERS BREAKDOWN WARNING.🐸🐸🐸
⚠️⚠️⚠️
Pattern formed, Big Move Ahead?
The weekly chart of #Pepe has confirmed a classic head and shoudlers pattern - a powerful bearish setup.
After over 1.5 years of building this structure, price decisively pierced the neckline with a sharp drop.
Suggesting that a weekly close below the neckline could trigger an accelerative towards the pattern target.
Key Levels
Neckline: $0.0000058599
Target: $0.0000012091
Why does it matter?
Head and shoulders are the most trusted reversal technical patterns. Coupled with declining and weakening sentiment. This pattern warns of more downside--- unless buyers can mount a quick rescue.
What's your strategy?
Are you shorting the breakdown, waiting for the target, or looking for a fake-out reversal?
Drop your thoughts/Analysis or questions in the comments!
ABOUT PEPE, BEARISH MOVEMENTS WITHOUT GOVERMENTS ^) Hello dear traders! It's Nika...
Today I want to share with you this trading idea, about purpose.
As this technical analysis shows, our indicator has these yellow-marked circles.
This movement of price may happen so easily... So soon.
There are so many support levels that can be checked.
So, my personal opinion is market is bearish, and we can see downfall of a price decline.
Wishing you a profitable day.
Good Luck!
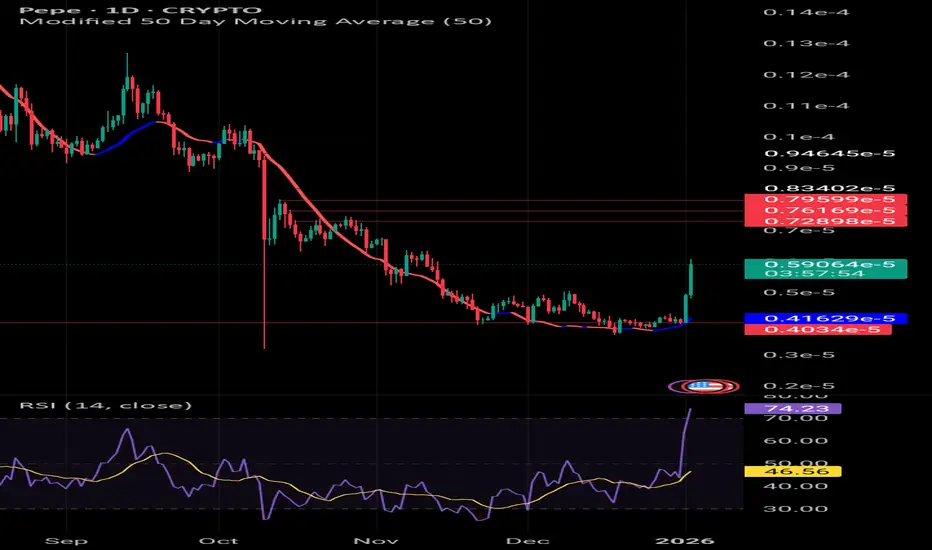
PEPE/USDT – Daily Timeframe AnalysisBias: Bullish Reversal → Momentum Building
PEPE/USDT is showing strong signs of a trend reversal after an extended bearish phase.
Price has formed a clear base around the 0.40e-5 demand zone, followed by a decisive bullish reaction, indicating that sellers are losing control and buyers are stepping in aggressively.
Technical Confluence
Price has reclaimed short-term structure after prolonged distribution.
RSI (14) has surged into the 70+ region, confirming strong bullish momentum.
The recent impulse suggests a change in market character (ChoCH) from bearish to bullish.
Key Levels to Watch
Major Support: 0.40e-5 – 0.42e-5
Immediate Resistance: 0.72e-5 – 0.80e-5
Higher Resistance Target: 0.94e-5
Bullish Scenario
Holding above 0.42e-5 keeps the bullish structure valid.
A confirmed breakout above 0.80e-5 could trigger continuation toward 0.94e-5 and above.
Bearish Invalidation
A breakdown below 0.40e-5 would invalidate the bullish bias and signal potential continuation of the broader downtrend.
Conclusion
PEPE is transitioning from accumulation to expansion.
Momentum currently favors the bulls, but continuation requires holding above key demand levels.
Trade with confirmation. Risk management remains essential.
Meme Coins Flying While You Celebrate New YearMeme coins absolutely flying - printing a bullish pivot exactly as the clock struck midnight at the turn of the year.
This is what crypto does - just as you're celebrating and drinks are popping, this market is also popping.
But relative to duration this is still quite early and is another aspect of the risk canon I described in a previous thread (see linked idea).
And that is - higher risk moves first.
Meme coins are highest risk (since they have 0 fundamentals) and so they move first.
And when they do they really pump hard.
Many traders cannot understand why to buy meme coins, especially when they are hodlers that make purchases based on what a coin project actually does.
But obviously the charts here answer that question - and while you're waiting for your upper tier coin to make a move, the frog coin is already up nearly 50% for the year - in less than 2 days.
These coins are not only great trades if you can catch them, but they are also great leading indicators as per the described risk canon.
And so when they have a incredible pop, it signals that lower risk may also be about to make a move.
In order of decreasing risk, the canon would continue: other altcoins (not meme), Bitcoin, stock indexes.
And so these meme move might just be a signal that stock indexes will move bullish in January.
That said, this could yet be a bull trap shakeout before regular trading hour stock indexes open in the next hour.
But I am favouring the bullish case currently since these meme pops have been so strong.
Volatility may arrive as regular trading hour markets open for the year so we'll be watching out for that.
And we'll see what is on the other side when that fades.
If you've been following my trickle of ideas you'll know that I called Litecoin as warming up last week.
And for now - crypto appears to be warming up.
We'll see how the day plays out.
This analysis is shared for educational purposes only and does not constitute financial advice. Please conduct your own research before making any trading decisions.
PEPE - Shooting Star = Market WarningPEPE Had a nice 17% pop since yesterday.
But it has just printed quite a nasty Shooting Star.
The Star pierces through resistances and trendline so there is plenty of liquidity sweeping here.
This signals a potential move back down.
Overall this I think the market is getting close to a significant bounce but this is a little price action warning here.
Perhaps there may be yet another market wobble in the pipeline.
I took profit here - can't hold in front of this star and may be a dip to buy later 👍.
This analysis is shared for educational purposes only and does not constitute financial advice. Please conduct your own research before making any trading decisions.
PEPEUSDT Bullish setup 4HBINANCE:PEPEUSDT is showing early signs of a trend reversal on the 4H timeframe. Price has reclaimed the mid-band of the volatility channel and is holding above the short-term EMA ribbon – a key bullish confluence suggesting buyers are slowly regaining control. Momentum is shifting upward with higher lows building and volatility compression hinting at an upcoming expansion.
I’ve aligned my targets with the Fibonacci extension levels:
🔹 TP1 – 38.2% Fib: ~0.000004948
🔹 TP2 – 61.8% Fib: ~0.000005176
🔹 TP3 – 100% Fib: ~0.000005400–0.000005540 zone
As long as price stays above the lower channel support and maintains its ascending structure, the upside remains favored. A break and close above the mid-range resistance could accelerate the move toward the 100% Fib target at 54.
PEPE/USD (2 hour chart Analysis)🟢 PEPE/USD (2-Hour Chart Analysis)
PEPE is currently trading around $0.00000620, sitting slightly below its 50-period moving average, which shows that the short-term trend is still under pressure. The RSI on the 2-hour chart is hovering below 50 — meaning momentum remains weak, but not oversold enough to confirm exhaustion. Price has formed a shallow base near the $0.00000590-$0.00000600 zone, an area that also aligns with a small fair value gap (FVG), suggesting it could act as short-term support if buyers step back in. This area will likely determine whether the next move is a bounce or another slide.
My bias is mildly bullish, but only if confirmation steps in. If PEPE breaks above the 50-period MA with convincing volume, it could trigger a short-term upside move toward $0.00000640-$0.00000650. However, if the price fails to reclaim that moving average and loses support near $0.00000590, a deeper correction could follow. The best move here is patience — let the market show its hand before reacting. As always, PEPE is a high-volatility meme token, so manage risk wisely and never trade with emotions.
PEPE – Relief Rally, Then More Pain?CRYPTO:PEPEUSD is still testing the 2025 lows, which could trigger a short-term bounce in the coming weeks. However, unless the rally breaks above the October high, the structure suggests this is just a corrective move before further downside resumes.
📉 Key Levels to Watch:
Support: 2025 lows – potential bounce zone
Resistance: October high – likely cap for relief rally
Outlook: Bearish continuation favored unless bulls reclaim key resistance
A map of PepeusdtA right and left shoulder is made + head + Elyot waves analysis. This is a corrective rise and not a motive .. The movement
It is expected to land on the area specified below in the coming weeks
*In principle, I am not a supporter of any direction, but I am only giving my point of view, which may be right or wrong. If the analysis helps you, then this is for you. If you do not like this analysis, there is no problem. Just ignore it. My goal is to spread the benefit. I am not one of the founders of the currency.
Is the same cycle starting again for $PEPE ?Pepe is forming a new base structure that closely resembles the one seen before its previous major rally.
Once the formation is complete, the door to a parabolic phase will open once again, as it did in the past.
The silence is deep but this chart looks like it did before.
Pepecoin🐸