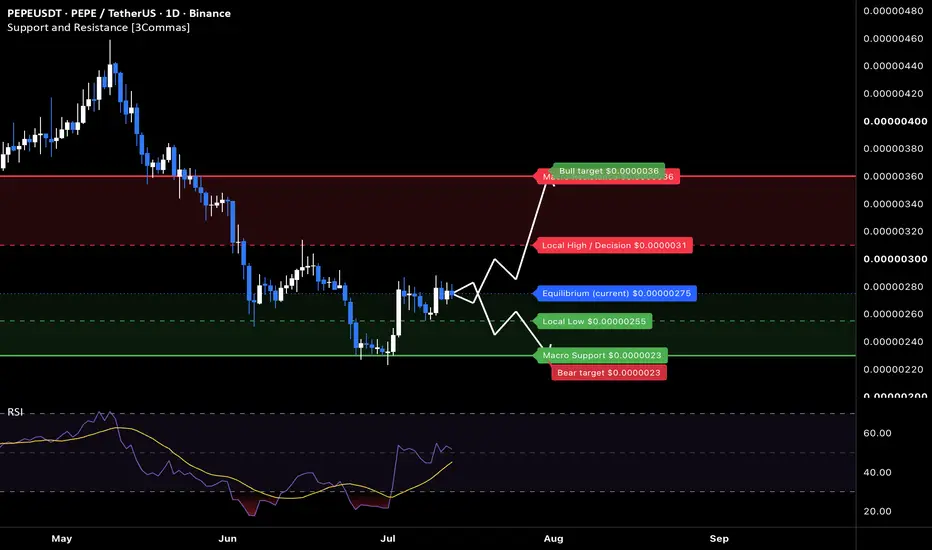
memcoin PEPE price analysis🐸 What if CRYPTOCAP:PEPE delivered another rally like it did in 2024? 🙂
At this point, that still feels more like wishful thinking than a realistic base-case scenario.
For now, OKX:PEPEUSDT is approaching several important resistance levels. The first one sits around $0.0000035, followed by a m
PEPE/USDT: Multi-Month Base Formation Could Fuel the Next PumpPEPE has spent the better part of the past year in a prolonged corrective phase, steadily retracing from its previous highs while forming what now appears to be a long-term accumulation base. After months of declining volatility and persistent selling pressure, price has returned to a historically a
PEPEUSDT 1D#PEPE is trading within a falling wedge pattern on the daily timeframe. The price is currently holding above the 50-day SMA, which supports the bullish outlook. A confirmed breakout above the wedge resistance could trigger a move toward the following upside targets:
🎯 $0.00000347
🎯 $0.00000418
🎯 $0
PEPE at macro floor: base recovery toward $0.0000036The Macro Picture 🗺️
PEPE unwound its May $0.0000046 highs through a persistent descending structure, and the selling finally bottomed at $0.0000023 in early July. The tape has since changed character: price carved out a higher low, reclaimed the equilibrium, and dragged RSI back above the midline
Is PEPE the best memecoin in history? C & H- (4HR) LONG 🙋♀️🙋♂️💡⭐👋🌍 Hello all 🌍🙋♂️🙋♀️🐼👋💡
Today I was just checking a few charts and PEPE couldnt help but catch my eye 👁️
I have had PEPE on my radar for a while now as I believe it has more potential than any other memecoin we have seen to date and no one is even aware yet.
Why?? ⬇️⬇️
Well l
PEPE Testing Falling Wedge ResistancePEPE is currently trading within a potential falling wedge pattern, a structure that is often associated with bullish reversals but still requires confirmation before a breakout can be expected. Price is now approaching a significant resistance zone formed by the 0.618 Fibonacci retracement and a de
PEPEUSDT at macro floor: bearish flush toward $0.00000220The Macro Picture 🗺️
Since the May 2026 structural peak at $0.00000460, PEPE has executed a clean structural reset — the multi-month $0.00000310 macro floor cracked in early June and the entire former accumulation range has now flipped into thick overhead supply. The mid-June reclaim attempt faile
PEPE Holds Key Supportm Bullish Bounce ?PEPE is currently trading at a critical daily support zone that could determine the direction of the next major move. Price action has pulled back into an area that combines two important technical factors: a significant daily support level and the 0.618 Fibonacci retracement. This confluence create
PEPE Is Quietly Setting a Trap…!Yello Paradisers! Are you prepared for a potential sharp move on #PEPE, or are you still underestimating what’s quietly building behind the scenes? At first glance, this structure might seem like a simple and healthy pullback. But when we strip away emotions and analyse the chart objectively, a comp
See all ideas
Summarizing what the indicators are suggesting.
Oscillators
Neutral
SellBuy
Strong sellStrong buy
Strong sellSellNeutralBuyStrong buy
Oscillators
Neutral
SellBuy
Strong sellStrong buy
Strong sellSellNeutralBuyStrong buy
Summary
Neutral
SellBuy
Strong sellStrong buy
Strong sellSellNeutralBuyStrong buy
Summary
Neutral
SellBuy
Strong sellStrong buy
Strong sellSellNeutralBuyStrong buy
Summary
Neutral
SellBuy
Strong sellStrong buy
Strong sellSellNeutralBuyStrong buy
Moving Averages
Neutral
SellBuy
Strong sellStrong buy
Strong sellSellNeutralBuyStrong buy
Moving Averages
Neutral
SellBuy
Strong sellStrong buy
Strong sellSellNeutralBuyStrong buy
Displays a symbol's price movements over previous years to identify recurring trends.