PAH USDT LONG SIGNAL#124. PHA/USDT – Trade Setup (LONG)
📈 Position Type: LONG
🕒 Timeframe: 1H
📊 Market: Futures
💰 Entry Zone:
0.02291
0.2170
🛑 Stop-Loss:
0.02114
🎯 Take-Profit Targets:
• TP1: 0.02374
• TP2: 0.02486
• TP3: 0.02606
• TP4: 0.02755
⚙️ Leverage:
3*
▫️ After TP1, move SL to Entry + 0.2%.
▪️ Exit Plan:
• 40% at TP1
• 20% at TP2
• 20% at TP3
20%. at. TP4
📌 Risk Management:
Risk only 1–2% of your capital per trade.
⚠️ Always check and confirm the setup on your chart before entering the trade.
In-depth trading ideas
PHAUSDT - Major Demand Zone – Rebound or Breakdown?📊📈 Technical Analysis
💰 Coin: PSE:PHA #PHAUSDT
⏳ Time Frame: 1D
📉 Pattern: Strong Demand Zone / Horizontal Support Retest
━━━━━━━━━━━━━━━━━━━━━━
🟨🛡️ Key Support Area
📍 Yellow Zone: 0.0227 – 0.0211
🟡 This area represents a major demand zone, where buyers have previously stepped in to prevent further declines. Price is now retesting this critical support, making the reaction around this zone extremely important for determining the next market direction.
💡 As long as price remains above this demand zone, the possibility of a technical rebound remains valid.
━━━━━━━━━━━━━━━━━━━━━━
🔍📉 Pattern Formation
📌 Horizontal Support Retest
📉 Price continues to form Lower Highs (LH) and Lower Lows (LL), indicating that the medium-term trend remains bearish.
🛡️ However, the market has now reached a historical support level that has previously triggered strong buying pressure and price recoveries.
📊 Price is currently moving sideways above the demand zone, showing an ongoing battle between buyers 🟢 and sellers 🔴.
⚠️ As long as this support is not broken with strong confirmation, the opportunity for a technical rebound remains intact.
━━━━━━━━━━━━━━━━━━━━━━
🟢🚀 Bullish Scenario (Rebound)
✅ If the 0.0227 – 0.0211 support zone holds and buying volume begins to increase 📈, PHA could stage a relief rally toward the nearest resistance levels.
🎯 Resistance Targets:
🥇 0.0245
🥈 0.0270
🥉 0.0300
🚀 A strong breakout above 0.0300 would signal that bullish momentum is returning and could open the door for a much larger upward move.
📈 Such a breakout would significantly improve the overall market structure.
━━━━━━━━━━━━━━━━━━━━━━
🔴📉 Bearish Scenario (Breakdown)
❌ If price fails to hold the 0.0227 – 0.0211 support zone and a daily candle closes below it with strong selling volume 📊, the bearish trend is likely to continue.
⚠️ A breakdown below this major demand zone could trigger panic selling 😨, as an important support level would have been lost.
📉 In that case, PHA could form a new Lower Low, extending the current downtrend until a new support area is found.
🔻 The downside risk will increase if sellers continue to dominate trading volume.
━━━━━━━━━━━━━━━━━━━━━━
📌📝 Conclusion
📍 PHAUSDT is currently trading at a major decision zone.
🟢 If support holds ✅
➡️ Potential rebound toward: 🎯 0.0245 ➡️ 🎯 0.0270 ➡️ 🎯 0.0300
🔴 If support breaks ❌
➡️ Selling pressure could regain control. ➡️ The bearish trend may continue with the formation of a new Lower Low.
💡📊 It is advisable to wait for candle confirmation 🕯️ and volume confirmation 📈 before making any trading decisions, as the price reaction within this demand zone will likely determine the next major move.
━━━━━━━━━━━━━━━━━━━━━━
#PHA #PHAUSDT #Crypto 🚀 #Altcoin 💎 #TechnicalAnalysis 📊 #TradingView 📉 #CryptoTrading #PriceAction #SupportResistance #DemandZone #Bullish 🟢 #Bearish 🔴 #CryptoAnalysis #ChartAnalysis #SwingTrading #OKX #BuyTheDip #CryptoSignals #MarketAnalysis #Trader
PHAUSDT Forming Falling WedgePHAUSDT is forming a clear falling wedge pattern, a classic bullish wave signal that often indicates an upcoming breakout. The price has been consolidating within a narrowing range, suggesting that selling pressure is gradually weakening while buyers are beginning to regain control. With consistent trading volume confirming accumulation at lower levels, the current setup hints at a potential bullish breakout in the near future. If the breakout is confirmed, the projected move could lead to an impressive gain of around 90% to 100%.
This falling wedge pattern is commonly seen at the end of downtrends or corrective phases, signaling a potential shift in market sentiment from bearish to bullish. Traders closely watching PHAUSDT are noticing strengthening momentum as the price approaches a key breakout zone. Healthy trading volume adds confidence to this setup, indicating that market participants are positioning early in anticipation of a sustained upward move.
Growing investor interest in PHAUSDT reflects increasing confidence in the project's long-term potential and its current technical structure. If buyers successfully push the price above the major resistance level with sustained volume, it could mark the beginning of a fresh bullish leg. The ongoing consolidation phase suggests steady accumulation, creating favorable conditions for a strong continuation rally once the breakout is confirmed.
Traders may find this an attractive medium-term opportunity, especially as the falling wedge pattern nears completion and buying pressure continues to build. A confirmed breakout could attract additional market participation and accelerate the move toward the projected upside target.
✅ Show your support by hitting the like button.
✅ Leaving a comment below! (What is You opinion about this Coin)
Your feedback and engagement keep me inspired to share more insightful market analysis with you!
Phala Network Bull Market Now High Probability (PP: 2000%+)I continue to see very interesting things. The impossible is still on track to happen. Impossible for who? The impossible for certain people to believe but not impossible for the Cryptocurrency market, the altcoins are set to grow really strong in 2026—and beyond.
Phala Network · PHAUSDT
A major drop broke a long-term support leading to a new all-time low. Since February 2025, trading volume started to rise. Getting closer to the present, trading volume continue to increase more and more. This volume signal is all we need.
The unusual increase in trading volume at low prices confirms the bottom is in and also a trend reversal. Hundreds of altcoins have been turning bullish so this is just another one.
The easy target is 149%. The high probability target is 789%. The $0.95 target with 2,152% can take much longer, it is something that will happen long-term.
Long-term, the $0.95 target is a must and easy to reach. When it comes to the current move, this is when it comes into question. Some projects are doing even better but each one is different. One can grow 4,000%, as we've seen already, and then crash, while another one can peak at 700-900%. Strong variations as usual.
The triangular bottom—v shape—on PHAUSDT is very strong, the $0.378 target becomes a minimum. With this chart and trading pair, you can aim to collect 800%.
Thank you for reading.
Namaste.
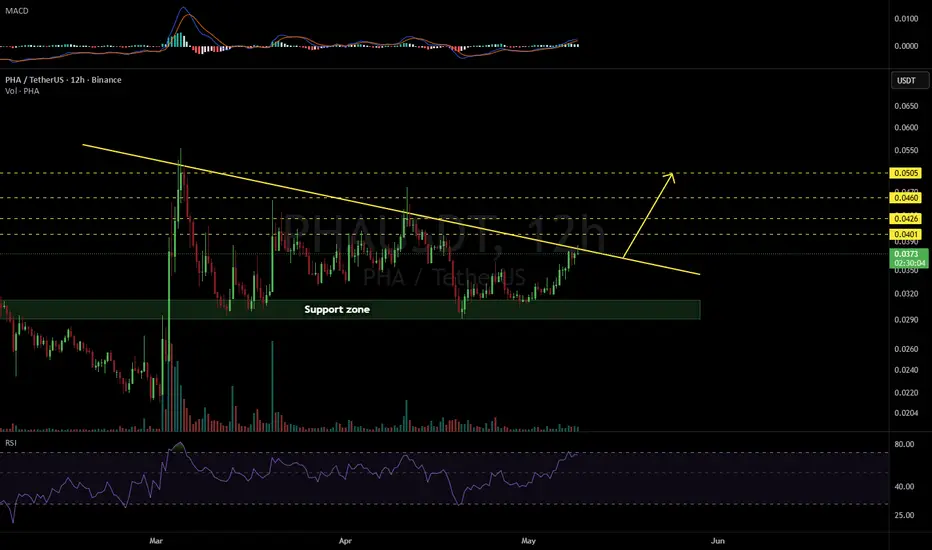
PHAUSDT 12H#PHA is moving inside a triangle pattern on the 12H timeframe chart. Consider buying a small bag here and near the support zone. In case of a breakout above the triangle resistance, the potential upside targets are:
🎯 $0.0401
🎯 $0.0426
🎯 $0.0460
🎯 $0.0505
⚠️ Always remember to use a tight stop-loss and maintain proper risk management.
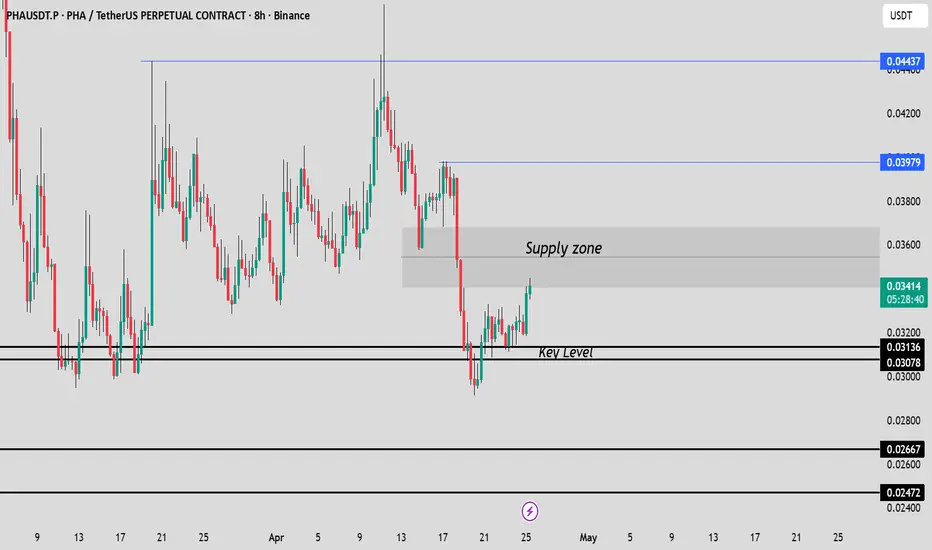
PHA / USDT At Supply Zone — Key Decision AreaPHA/USDT has swept prior liquidity and is now reacting inside a refined supply zone.
If price shows rejection here and forms a lower high, I’ll look for short opportunities targeting the $0.0313 support, with potential extension toward the $0.026–$0.024 demand zone.
Alternatively, a clean breakout and retest above the supply zone would confirm bullish continuation, opening the door for higher highs.
Key focus: reaction at supply + confirmation before entry. Risk management remains priority.
Phala Network 800% profits a high probability, 2000%+ long-term I continue to see very interesting things. The impossible is still on track to happen. Impossible for who? The impossible for certain people to believe but not impossible for the financial markets.
The chart is for Phala Network—PHAUSDT.
A major drop broke a long-term support leading to a new all-time low. Since February 2025, trading volume started to rise. Getting closer to the present, volume increased more and more. This volume signal is all we need.
The unusual increase in trading volume at low prices confirms the bottom is in and also a trend reversal. Hundreds of altcoins have been turning bullish so this is just another one.
The easy target is 149%. The high probability target is 789%. The $0.95 target with 2,152%, I don't know. It is possible but we will have to wait and see.
Long-term, the $0.95 target is a must and easy to reach. When it comes to the current move, this is when it comes into question. Some projects are doing even better but each one is different. One can grow 4,000%, as we've seen already, and then crash, while another one can peak at 700-900%. Strong variations as usual.
The triangular bottom—v shape—on PHAUSDT is very strong, the $0.378 target becomes a minimum. With this chart and trading pair, you can aim to collect 800%.
Thank you for reading.
Namaste.
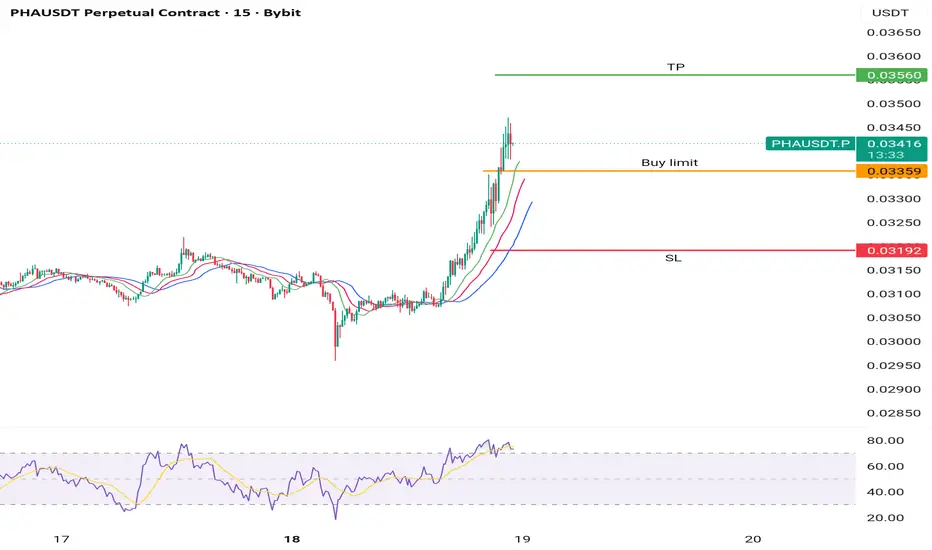
PHA/USDT — strong buyers, but unstable environmentNot every bullish setup is clean.
Some of the fastest moves happen in the most unstable conditions.
Right now PHA is trading around 0.041, after a sharp impulse upward, approaching local resistance.
The structure leans bullish — but the environment is not stable.
What the current structure shows
• Strong buyer activity (trade flow positive)
• Order book slightly favors buyers
• Price reacting above short-term support (0.03920)
• High volatility → potential for fast moves
At the same time:
• Volume is below average
• Liquidity is thin
This matters.
High volatility + low liquidity = sharp moves in both directions
What AI highlights (this is key)
The setup supports a LONG scenario:
• Entry aligns with support → controlled risk
• Strong buyer flow → momentum present
• Risk/Reward is favorable
But:
👉 This is a fast market, not a stable one
Which means:
• Moves can extend quickly
• But can reverse just as fast
Key levels to watch
Support: 0.03920
Resistance: 0.04180
Two scenarios from here
Continuation scenario
If price holds above support and pushes through 0.04180:
• 0.04370 area
• 0.04570 area
This would confirm momentum continuation.
Failure scenario
If price loses 0.03920:
• Structure weakens
• Move likely turns into fast downside rotation
Practical approach
This is not a “set and forget” trade.
This is a management trade.
In this type of environment:
• Entries should be precise (near support)
• Stops must be respected
• Position sizing matters more than usual
The risk here is not direction.
It’s volatility.
Final thought
Fast markets reward clarity.
Not confidence.
🧩 This is a structured market read, not a prediction.
🧠 No trade is also a decision.
**Liquidity Sweep → Order Block Reaction**
Price initially formed a **sell-side liquidity sweep (SSS)** which triggered a strong impulsive move to the upside. After the expansion, the market distributed and gradually retraced back into a **previous demand/order block zone**.
The zone has now been **tested multiple times with wick rejections**, indicating buyers are defending this POI. The reaction confirms the area as a valid institutional demand level.
**Execution Idea**
• POI: Bullish Order Block / Demand
• Entry: Reaction within the block
• Invalidation: Break below the OB low
• Target: Range highs / prior liquidity
As long as price holds the demand zone, the expectation remains **a rotation back toward internal liquidity above**.
PHAUSDT Forming Falling WedgePHAUSDT is forming a clear falling wedge pattern, a classic bullish reversal signal that often indicates an upcoming breakout. The price has been consolidating within a narrowing range, suggesting that selling pressure is weakening while buyers are beginning to regain control. With consistent volume confirming accumulation at lower levels, the setup hints at a potential bullish breakout soon. The projected move could lead to an impressive gain of around 140% to 150% once the price breaks above the wedge resistance.
This falling wedge pattern is typically seen at the end of downtrends or corrective phases, and it represents a potential shift in market sentiment from bearish to bullish. Traders closely watching PHAUSDT are noting the strengthening momentum as it nears a breakout zone. The good trading volume adds confidence to this pattern, showing that market participants are positioning early in anticipation of a reversal.
Investors’ growing interest in PHAUSDT reflects rising confidence in the project’s long-term fundamentals and current technical strength. If the breakout confirms with sustained volume, this could mark the start of a fresh bullish leg. Traders might find this a valuable setup for medium-term gains, especially as the wedge pattern completes and buying momentum accelerates.
✅ Show your support by hitting the like button and
✅ Leaving a comment below! (What is your opinion about this Coin?)
Your feedback and engagement keep me inspired to share more insightful market analysis with you!
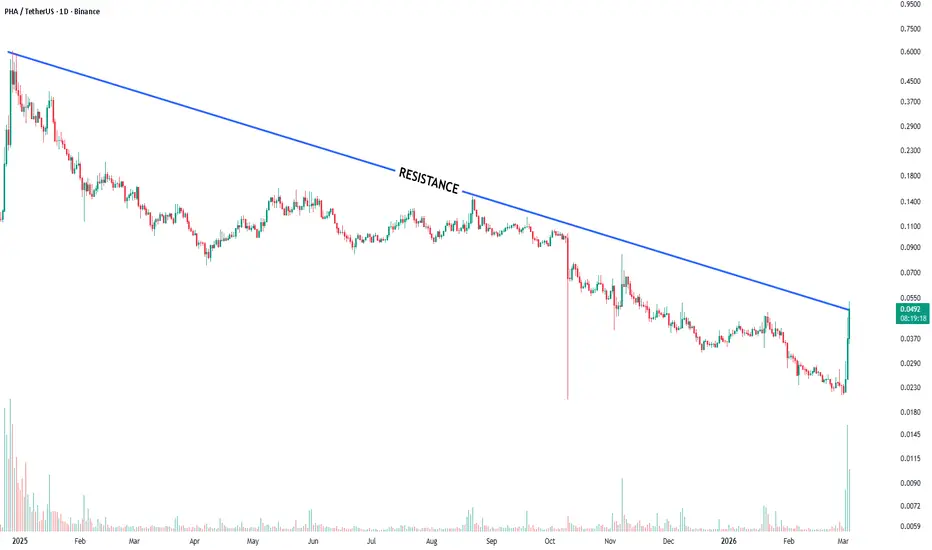
PHAUSDT – Major Resistance After 1 Year | Potential RejectionBINANCE:PHAUSDT has rallied sharply and is now testing a major descending resistance that has controlled the trend for nearly a year.
The current move has brought price directly back into this long-term supply zone.
Technical context
• Price approaching a descending resistance line from early 2025
• Multiple rejections have occurred from this level historically
• Current rally appears extended into resistance
If the resistance holds, the structure could favor a downside move toward the 0.028 area.
Trade Structure
Pair: PHA / TetherUS BINANCE:PHAUSDT
Bias: Short
Current price: 0.049
Target zone: 0.03
Invalidation level: 0.066
As always, confirmation and disciplined risk management remain essential when trading derivatives markets.
Markets often offer their best opportunities when price revisits major structural levels after long consolidations.
PHAUSDT — SHORT REKTPrice sitting at 0.036 with futures at 0.035, putting premium at -2.67% and a Z-score of -8.2. That is an extreme futures discount. When futures trade this far below spot, somebody is positioning aggressively short through derivatives while spot holds firm. That tension has to resolve.
Bull signals look strong on the surface. 78.2% vs 21.8% split with a 56.45% edge at 3.59x conviction. Bounce probability sits at 66.1% with a 6.7x multiplier. Squeeze has been firing for 13 bars with bullish momentum expanding. Whales are buying. Shorts are getting liquidated. All of that reads like a textbook breakout setup.
Now here is where it gets dangerous.
Futures volume Z-score is at 14.37. That is BlackSwan territory. Spot Z is 4.26 which is parabolic but nowhere near the futures side. The futures-to-spot ratio is over 12x. This is not real demand. This is leveraged speculation running the show while spot volume trails far behind.
Leverage is at 12.34x. That is the all-time maximum. Zero bars ago means it just hit this level right now. Percentile is 100%. Ceiling. There is literally no more room for leverage to expand. Every single time leverage hits ceiling while price sits at floor levels like 10.9%, you get a violent reset. Either longs get flushed to bring leverage down, or the move continues but on borrowed time.
The spot squeeze firing at 595.5% expansion with divergence showing real spot participation is the one saving grace. OBV Z at 1.47 confirms accumulation is genuine. But genuine accumulation does not need 12x leverage backing it.
Short term this can push higher as shorts continue getting liquidated. The cascade is already happening. But any long entry here is catching a move that is already extended on maximum leverage with a ghost market ratio that screams manipulation over substance. If you are already long, trail stops tight. If you are looking to enter, wait for leverage to pull back below the 80th percentile at minimum. The setup will still be there if the move is real.
Risk is to the downside despite every signal screaming bull. Leverage ceiling has historically been the single most reliable reversal signal regardless of what price or momentum says.
More analysis on my profile.
🎯 Target: 1K Followers
👉 Follow: stingrayea
#PHA Ready For a Major Massive Move. Don't Miss this opportunityYello, Paradisers! Is this just another fakeout, or is #PHA about to explode after weeks of silent accumulation? Let's view the #PhalaNetwork trading setup:
💎#PHAUSDT has been trading inside a well-defined descending channel, respecting both the upper resistance and lower support lines for months. But that might be about to change. The price just broke out of the channel and is currently retesting the breakout zone while sitting right above the strong demand area between 0.024 and 0.030.
💎What gives this setup even more power is the clear bullish divergence on the MACD, signaling a loss in bearish momentum right as the breakout occurred. On top of that, we already saw a bullish MACD crossover, adding extra confidence to this move.
💎If buyers manage to hold this support and flip the 50EMA into support, we expect a clean continuation to the upside. The first key target is the moderate resistance at 0.0613, but the real magnet for price is the strong resistance zone between 0.090 and 0.093, where we expect significant supply and profit-taking.
💎However, if #PHAUSD loses the 0.024 support zone, this entire bullish setup gets invalidated. A break below that level would confirm a lower structure and likely trigger another wave of downside.
Trade smart, Paradisers. This setup will reward only the disciplined.
MyCryptoParadise
iFeel the success🌴
PHAUSDT Forming Falling WedgePHAUSDT is forming a clear falling wedge pattern, a classic bullish reversal signal that often indicates an upcoming breakout. The price has been consolidating within a narrowing range, suggesting that selling pressure is weakening while buyers are beginning to regain control. With consistent volume confirming accumulation at lower levels, the setup hints at a potential bullish breakout soon. The projected move could lead to an impressive gain of around 90% to 100% once the price breaks above the wedge resistance.
This falling wedge pattern is typically seen at the end of downtrends or corrective phases, and it represents a potential shift in market sentiment from bearish to bullish. Traders closely watching PHAUSDT are noting the strengthening momentum as it nears a breakout zone. The good trading volume adds confidence to this pattern, showing that market participants are positioning early in anticipation of a reversal.
Investors’ growing interest in PHAUSDT reflects rising confidence in the project’s long-term fundamentals and current technical strength. If the breakout confirms with sustained volume, this could mark the start of a fresh bullish leg. Traders might find this a valuable setup for medium-term gains, especially as the wedge pattern completes and buying momentum accelerates.
✅ Show your support by hitting the like button and
✅ Leaving a comment below! (What is your opinion about this Coin?)
Your feedback and engagement keep me inspired to share more insightful market analysis with you!
PHAUSDT 12H#PHA is moving inside a falling wedge pattern on the 12H timeframe. Volume has spiked, which is a positive sign. In case of a breakout above the wedge resistance and the 12H SMA50, the potential targets are:
🎯 $0.0537
🎯 $0.0628
🎯 $0.0702
🎯 $0.0776
🎯 $0.0881
🎯 $0.1014
⚠️ Always remember to use a tight stop-loss and maintain proper risk management.