pi longthis crypto Pi have reached on technical trend bottom , with small stop loss and give it time Longby talwinfer121
Pi could be turning bullishIf the 0.2100 mark is successfully breached on the weekly TF. Then higher prices are most likely in place. Also remember that there’s a major news coming up on May 7. It could potentially push price higher.Longby pelumiajilore633
Pi Coin Posts Modest Gains as Pi Network Unveils New App Studio Pi Coin price posted modest gains after Pi Network announced new updates to its App Studio, drawing renewed attention from the crypto community. The update highlights the network’s continued focus on building real world utility rather than chasing short term speculation. Market participants viewed the announcement as a positive step toward strengthening the platform’s development infrastructure. This shift helped support a mild but steady improvement in market sentiment. Investors and users incPLongby CryptoLifeone3
PI Slips Back Into Demand – Bounce or Breakdown?Trend Check: Price is pressing deep into demand with weakening momentum. Last MSB was bullish, but structure is fragile. Indicators: RSI: 28.3 (oversold) MACD: Bearish momentum building Structure: Still within major demand, but consistent lower highs signal pressure. Watch for sweep and reclaim or breakdown. Position: Neutral → Short bias Entry Idea: Short below $0.200 Stop: Above $0.205 Targets: $0.195 → $0.188 Reasoning: Momentum is heavily bearish. If demand fails to hold, expect a cleShortby tomas_jntx3
Pi - 4hr chartT.A explained - BackSide (BS) FrontSide (FS) Inverse BS (Inv.BS) Inverse FS (Inv.FS) BS & FS levels are expected support when dashed lines, tested when dotted and resistance when solid lines. The inverse is true for the Inv. BS Inv. FS levels, they are resistance as dashed lines, tested as dotted and support as solid lines. Monthly timeframe is color pink weekly grey daily is red 4hr is orange 1hr is yellow 15min is blue 5min is green if they are shown. strength favors the higher timeframe. by StudyGuideTAUpdated 3
Pi Network (PI) Update, bullish reversal?Pi Network is developing a clear accumulation range above the $0.21 zone, showing stability after a period of corrective movement. Higher lows forming beneath the point of control indicate that buying pressure is gradually building. As long as PI continues to hold above this support region, the structure leans toward a potential rotation into higher resistance levels. A decisive reclaim of $0.26 would strengthen the bullish case and increase the probability of expansion toward the upper boundarPLongby The_Alchemist_Trader_7
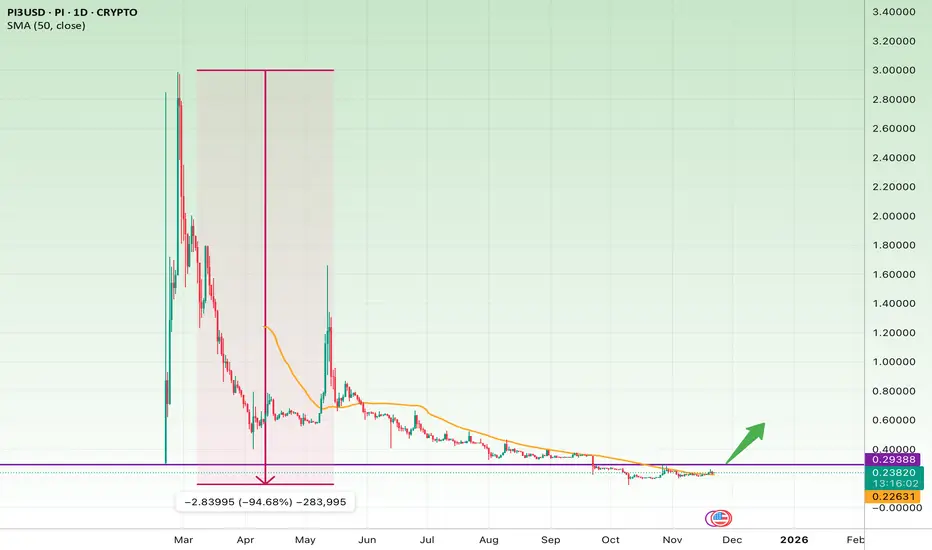
PI Coin Massive Capitulation, But a Potential Bottom Is FormingPI has experienced an extreme -95% collapse from its peak, followed by months of steady sideways consolidation. This kind of price behavior is typical after capitulation events, where sellers are completely exhausted and the market enters a long accumulation phase. Key Technical Observations 1. Major Capitulation (-94.68%) The sharp vertical drop shows panic selling. After such massive declines, markets often enter a stabilization zone. 2. Long-Term Support Zone (≈ $0.22 – $0.30) The chart sLongby isahebdadi14
Pi Coin Price Bounce Isn’t Over Yet? Two Bullish Charts Show WhyOKX:PIUSD ’s rebound remains intact. On the daily chart, the price has formed a higher low between October 30 and November 1, while the Relative Strength Index (RSI) made a lower low. This creates a hidden bullish divergence, which often signals that the broader uptrend may continue even after short pullbacks. If OKX:PIUSD manages a daily close above $0.255, it could extend gains toward $0.270, then $0.293, and possibly $0.340 if volume supports it. However, a drop below $0.215 would weaken tPLongby BeInCrypto3
Pi Network Rebounds from Golden Pocket — Is a Reversal Brewing?Pi Network (PI) is showing early signs of strength after rebounding from the 0.618 Fibonacci retracement level, accompanied by a bullish engulfing candle on the 4H chart. This confluence zone marks a crucial turning point where buyers are beginning to re-enter the market following an extended phase of selling pressure. If the 0.618 golden pocket continues to act as reliable support over the next few sessions, the probability of a rotational move toward $0.26 increases significantly. This level PLongby The_Alchemist_Trader_124
PI3/USD – Holding SMA200 Support🟢 LONG above $0.355 – target $0.360 Pi trades at $0.3557, hugging SMA200 ($0.3554). Resistance: $0.3600, support: $0.3540. RSI at 48, ticking higher, hinting at potential recovery. Favorable setup if $0.355 holds. 📖 Keywords: #PI3USD #PiNetwork #CryptoSetup #SupportPlayLongby tomas_jntx15
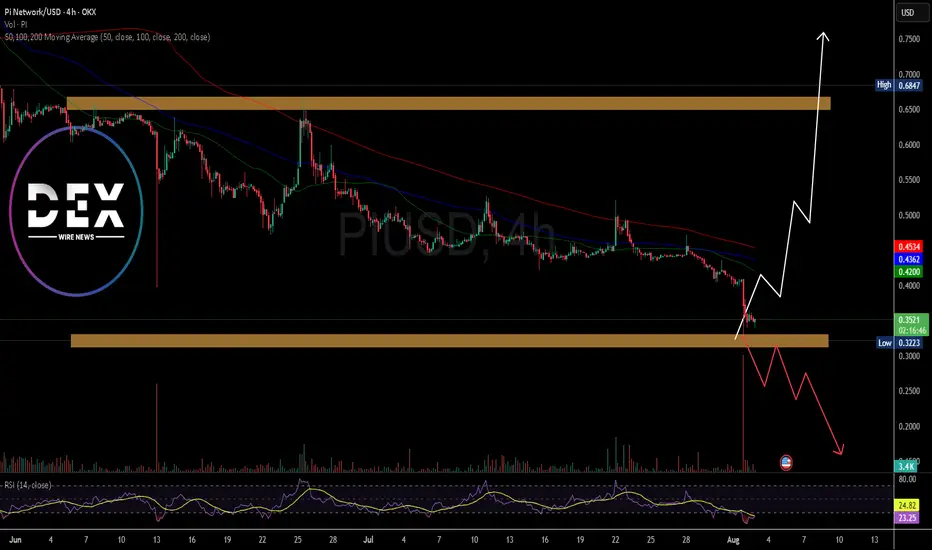
Is There Hope For PI Network? The Price of the notable altcoin NASDAQ:PI network has since seen a downtick of 80.86% since lunching and listing on major CEX like Kucoin, GateIo, OKX, etc. as per data from CMC. The altcoin has lost the psychological $0.66 resistance zone forming a support or baseline at the $0.33 price range. with increasing selling pressure, NASDAQ:PI might experience further price dip to the $0.20 price point eventually leading to a deja vu to the $0.60 price point. Possible factor to present price dPLongby DEXWireNews117
PI3USD – Bleeding With No BottomPI3 is in a clear multi-day downtrend, with successive lower highs and lower lows. Attempts to bounce have all been sold into quickly. The recent breakdown below $0.53 pushed price to new lows near $0.51. Until $0.535 is reclaimed convincingly, short setups dominate.Shortby tomas_jntx6
bullish on pi aprouching pi day 2buy now and hodle for later as pi continue making waves on crypto markets and the distribution of lockeck pi continues Longby MABRAD27
Long Trade Analysis – PI/USD (30M Chart)!📈 ✅ Setup Overview Chart Type: 30-minute timeframe Asset: PI Network / USD (OKX) Pattern: Descending trendline breakout with confirmation candle Trade Type: Long (Buy) 📌 Key Levels Entry Point: ~$0.6411 (just above trendline break) Stop Loss: ~$0.6258 (recent support) Target 1: ~$0.6624 (near resistance) Target 2: ~$0.6854 (upper green zone / stronger resistance) 📊 Trade Justification Breakout from a descending triangle/trendline. Bullish engulfing candle confirms breakout. Strong risPLongby ProfittoPath5
Trade Setup Summary – PIUSD (Pi Network / USD)!📈 Chart: 30m timeframe – OKX Exchange 🔺 Pattern: Symmetrical Triangle + Downtrend Line Breakout The price is pressing against confluence resistance – triangle top + descending trendline + yellow horizontal resistance. 📍 Entry Zone: Around $0.7396 Price is attempting a breakout; needs candle close above $0.74 for clean confirmation. 🛑 Stop-Loss (SL): $0.7261 Below triangle support and white horizontal support zone. 🎯 Target Levels (TP): TP1: $0.7580 (Red resistance – short-term barrier) TP2PLongby ProfittoPath3
PI/USD Breakout Confirmed – Bulls Taking Control!🟢 Trade Type: Long (Buy Setup) Pair: PI/USD (Pi Network vs US Dollar) Timeframe: 30-Minute Chart Current Price: $0.7410 🔍 Technical Setup Pattern: Falling wedge breakout (bullish reversal pattern) Entry Point: Breakout and retest around $0.7410 (highlighted with a yellow circle) Trend Reversal: Price broke a long-term downtrend line (pink), confirming breakout potential 🎯 Targets & Stop-Loss Take-Profit (TP): TP1: $0.8328 (previous resistance zone) TP2: $0.9393 (major supply zone) Stop-PLongby ProfittoPath3
Trade Setup – PI/USD Long!📈 Pattern: Falling Wedge Breakout (Bullish Reversal) Entry Zone: Around $0.7169 (confirmed breakout in progress) Support Zone: Around $0.6867 (marked in white) Resistance/Target Levels: TP1: $0.7706 (minor horizontal resistance) TP2: $0.8493 (major resistance/previous range top) Stop-Loss (SL): Below $0.6860 (structure invalidation area) 📊 Technical Highlights Falling wedge pattern breakout with a bullish candle. Price is respecting support (highlighted in yellow box). Bullish divergence PLongby ProfittoPath2
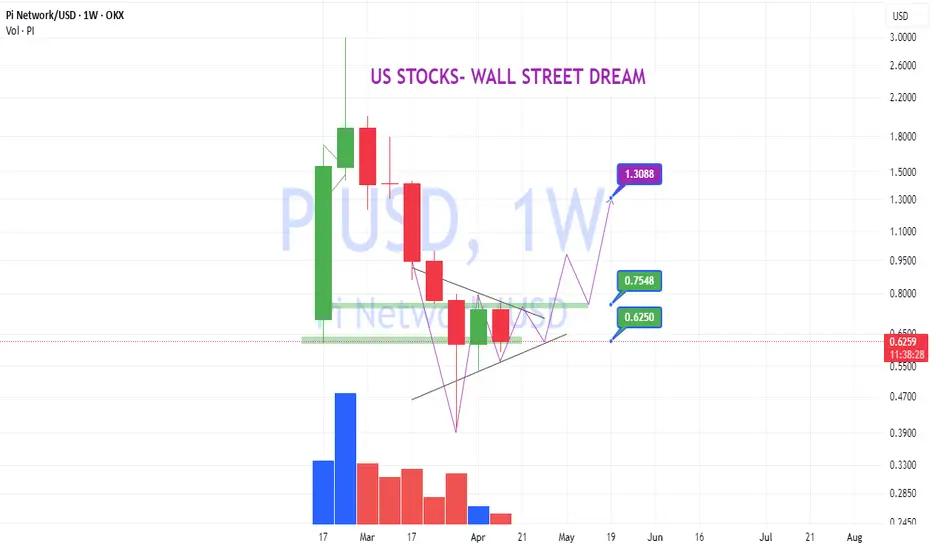
PIUSD: Buy herePIUSD: Buy here Pull back after surging. Demand zone support. PLongby usstockswallstreetdream2
Trade Setup: Falling Wedge Breakout (Bullish Reversal)!📈 🔹 Pattern: A falling wedge pattern has formed and appears to have broken out with a strong bullish candle. 📌 Entry Zone: Around $0.96 – near the breakout of the falling wedge pattern and previous horizontal support. ❌ Stop-Loss: Below $0.85 – under the wedge's lower trendline and previous support zone (shown in white and yellow lines). 🎯 Take Profit Targets: TP1: $1.0860 – nearest resistance level (white line) TP2: $1.2603 – next horizontal resistance (yellow zone) TP3 (Extended): $1.351PLongby ProfittoPath2
Long Trade Setup – PIUSD!📈 Timeframe: 30-Minute Chart Setup Type: Falling Wedge Breakout (Bullish Reversal) 📌 Trade Plan Entry Zone: Around $1.10 (breakout confirmation above trendline) Stop-Loss (SL): Below $0.95 (invalidates wedge & structure support) 🎯 Take Profit Targets TP1: $1.32 – Recent resistance zone TP2: $1.57 – Measured move from wedge breakout 🔍 Technical Highlights Falling wedge pattern signals reversal potential 📉➡📈 Clean breakout candle above the wedge with consolidation Strong demand at ascendinPLongby ProfittoPath6
PI:short target have been reachedPI:short target have been reached . Let's see how PI has run! . US STOCKS- WALL STREET DREAM- LET'S THE MARKET SPEAK!PLongby usstockswallstreetdream11
Pi network got sniped prove me wrong, I locked 600 away 3 years ago and now i see this, what a joke crypto has become. this is a warning to all people looking into crytpos, just stick to the well backed coins. Pby shaungomez82
PIUSD: Inside bar patternPIUSD: Inside bar pattern Less supply volume at the bottom. Tighter range. Wait and see a break! US STOCKS- WALL STREET DREAM- LET'S THE MARKET SPEAK!PLongby usstockswallstreetdream13
Have your heard of $Pi ?! NASDAQ:PI , an OG project that allows you to mine NASDAQ:PI coins on your mobile device, without draining your battery. Mainnet is out and coinbase could list NASDAQ:PI soon. PLongby Aanggg29

 Long